Reliability Analysis of Reinforced Concrete Columns after High Temperature under Comprehensive Considering Failure Paths
Reliability of reinforced concrete (RC) eccentric compression columns is influenced by many factors. Resistance model and limit state equations of RC eccentric compression columns are established through introducing strength reduction factors of reinforcement and concrete. A Monte Carlo method is utilized to simulate for assessing the reliability of RC eccentric compression columns after high temperature under comprehensive considering failure paths. A sample to determine fire and columns temperatures and the capacity of RC columns is adopted for this analysis to structure the methodology. Analysis results indicates that the reliability assessment method is fully different under the eccentricity is relatively large or small, and the reliability assessment is not safe under considering single failure path, so comprehensive considering failure paths is more matching the true situation than only considering single factor (axis or moment) when evaluate reliability of RC eccentric compression columns post-fire. In addition, the effects of some parameters on reliability index are analyzed, which supply theory basis on safe assessment, maintenance and strengthening of RC member post-fire.
Keywords: Fire; Monte Carlo Simulation; Reliability; Failure Paths
With the development of fire science theory, many researchers have obtained a lot of research results, and most of them focus on research of heating process of fire district, temperature distribution within the components under fire and mechanical and high-temperature properties of reinforcement and concrete at high temperature and post-high temperature, such as L i e, Venkatesh and Yih-Houng [1-3]. After fire, the problem concerned by people is the safety of buildings, which is to evaluate the damage of structural component, propose economic reinforcement scheme of repair or removal, reinstate as soon as possible and reduce economic loss. Currently, damage assessment of component after fire duration depends on the scene detection test results. As for the feature, under different fire duration temperature, internal temperature field and damage of different types of concrete components are not same with each other. Reliability of science detection test is not good enough [4]. So reliability analysis of concrete components after fire is quite necessary.
With development and improvement of reliability theory, structural reliability theory concept has been widely accepted. Reliability of concrete structure is now widely studied. Zhao Shang-chuan, et al. forecasted residual service life of existing RC structure, Plevris, et al. and Rebecca, et al. studied the reliability of concrete structures with externally-bonded fiber reinforce plastic reinforcement, in which the flexural strengthening was considered about RC beams subjected to typical building loads, The works of Frangorpol, et al. considered the correlation of the RC load when carrying about reliability assessment. In which, mechanical behavior of concrete, such as the linearly elastic is supposed to remain [5-10]. The work of Soares, et al. given an efficient method to solve the mechanical-reliability coupling when analyzes the reliability of large systems. Tang chang hui et al. studied the reliability of RC structure after be strengthened. But studies of combination of fire science theory and reliability theory are few [11]. Once fire occurs in service period for any a structure, reliability must be analyzed for further use. However, some methods used in reliability are still limited and do not fit for real situation. Furthermore, there are many drawbacks in the current approach of establishing resistance model and limit state equation of RC structure post fire.
Under normal condition of use, during reliability analysis of RC columns axial force and bending moment are treated associatively, it is can be said that column has only one failure path, but for the RC eccentric compression columns after high temperature, with different cooling mode and standing time, bending moments and axial forces are not entirely associated, and size of eccentric is not fixed during the column bearing force [12]. In this situation, if bending moments and axial forces are treated completely associative, then reliability index of column may be underestimated or overestimated. So for assessment of reliability of RC eccentric compression columns after high temperature, both complete association (one failure path) and independence (two failure paths) of bending moments and axial forces should all be taken consideration.
Reliability analysis of structural component after high temperature is based on the residual capacity of component, in this paper, strength reduced coefficient of reinforcement and concrete after high temperature are introduced, residual resistance expression of RC eccentric compression column encircled by fire is established. Comprehensively considering the failure path of eccentric compression columns after high temperature, reliability of eccentric compression columns after high temperature are analyzed. Analysis results of reliability are compared completely, and the difference is listed which can provide the theory basis for the safety assessment of eccentric compression columns after high temperature.
The reliability analysis condition of a damaged structure must be situation-specific and thus is a unique technical process that is difficult to codify, the concerns of safety, serviceability and durability are the same as with a new structure. The condition assessment must ensure that these performance requirements are met with acceptable reliability. However, current guidelines for evaluating damaged structures do not have a reliability basi; a new reliability assessment method is given in this paper.
Safety and serviceability provisions in codes and standards used in existing Structures and damaged structure take the form:
Required strength ≤ Design strength
Deformation due to service loads ≤ Deformation limit
Such reliability analysis are intended to ensure that the structure is safe under extreme loads and remains functional under building loads, especially for the damaged structure.
Uncertainties arise from variations in loads and material strength properties and member dimensions with different temperature, after the structure be fired, with the advances in structural reliability theory and probabilistic methods for analyzing uncertainty and setting performance criteria have accompanied the development of limit states equation as engineering field of endeavor. Limit state equation is defined based on the relation between stress S and resistance R, it occurs when exposure to stress exceeds the strength of the design. However, since
R and S are established by material performance and member dimension; they are characterized as random variables with corresponding means μS and μR, and σS and σR
probability distribution function are fs(s) And fR(s) , respectively. The reliability is defined as  , where Rr stands for reliability and fP stands for probability of failure which in turn is generally defined as:
The performance function is expressed as follow,
Z = 0 in the case defines the boundary between the failure and the safe or reliable regions.
The limit state function is then defined as a generalization of Z = R - S = 0, when Z
is defined on multiple variables(i.e. vector X = x1, x2. . ., xn) and the relation between them
That defines the failure can take any form, linear or nonlinear. The damaged structure may require an assessment of structural adequacy and lead to possible modifications for further use.
such that failure occurs when Z ( X ) < 0 .Thus, the limit state probability becomes e.g., [13]
In which fx () = joint density function of X and the integration is performed over the region of
X which Z(X)< 0. The integration in Eq.4 usually is difficult for realistic structural Problems.
First-and second-order reliability methods (FORM/SORM) is usually be used to provide an alternate measure of reliability in terms of a reliability index, β [14,15]. Provided that the limit state is well-behaved, the probability
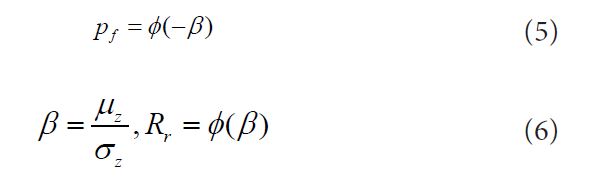
Often is an excellent approximation for the true limit state probability, making FORM a tool For approximate numerical integration of Eq.4 and β and Pf more or less Interchangeable as Reliability measures. Alternatively, with advances in computation have come highly efficient Monte Carlo methods for direct evaluation of Eq.4, e.g., and this method is also adopted in this paper [16,17]. and this method is also adopted in this paper.
Research results indicate that failure mode, limit strain of section and stress distribution of RC component after high temperature are similar to the one in room temperature [18]. So calculation method for the component in room temperature is suitable for the one after high temperature, but strength and deformation index of reinforcement and concrete are need to be modified. In this paper software SAFIR from literature is used to carry on thermal analysis of RC column to obtain the strength reduced coefficient [19]. Before the formula is introduced into this paper, the following assumptions were made:
(1) Concrete aggregate is siliceous, residual deformation of each element of concrete is same with each other, which means: residual stress is ignored, and component deformation made by uneven distribution of temperature meets the plane assumption.
(2)Component deformation made by shear is ignored.
(3)Column section size meets; b / h < 2.0, high temperature tensile resistance is ignored ( ).
).
(4) Both ends of column are hinged, and deflection line meets sine half-wave.
(5) Column is subject to four-face fire.
(6) Distribution of temperature of column section is got through ANSYS software, just like [20].
Explanation for assumption (3) is: During heating and cooling process, expansion and contraction of concrete is unequal. The size of residual deformation depends on the type of aggregate and the temperature of fire. Since the distribution of temperature concrete component is uneven, so the residual stress is in the component is uneven. Obviously, the size and distribution of residual stress depend on distribution of temperature. When the temperature gradient distribution is large, the residual stress is large, which affects high temperature elements where fire occurs quickly, the time is short and the surface of component. When the residual bearing capacity is calculated, these elements take a small portion in the component, and thermal deformation of reinforcement and concrete is close with each other, so this influence is ignored.
Calculation formula of residual resistance of eccentric compression column is subject to four-face fire is as followed:
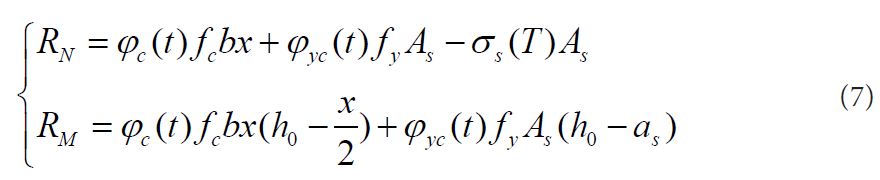
Where RN And RM Are the axial force and bending moment of eccentric compression column after fire, respectively. fc is the room temperature compress strength of concrete.
b is width of column section. h0 is the effective height of column section. AS and A'S are the section area of reinforcement when reinforcement bears the tension and compression,respectively. σs(T) is the reinforcement stress of column after fire. φc(t) and φyc(t) are strength reduced coefficient of concrete and reinforcement with different fire duration time, respectively, The calculation formula is as followed:
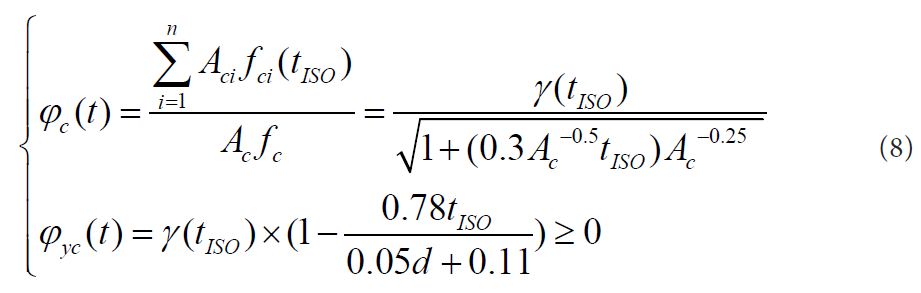
Where tISC. is fire duration time of standard heating curve, Ac is section area of column,. d' is thickness of protective layer, f'c is compress strength of concrete prism when the temperature is T.  is the sum of Acifci of each element i when the whole section is divided into n finite element meshes. γ(tISO) is calculated by the following equation:
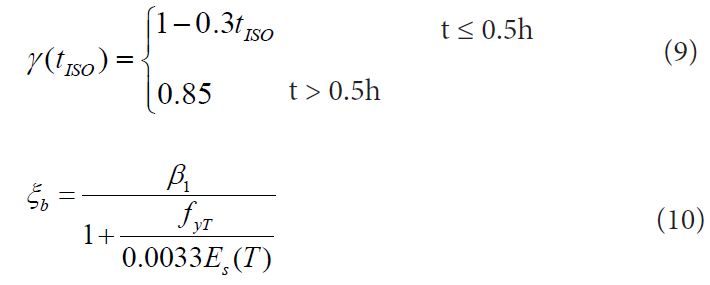
Where, Es(T) is elastic modulus of reinforcement after fire duration which is determined by [11].

Where Es is the elastic modulus of reinforcement in room temperature.
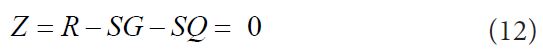
Residual resistance fore of eccentric compression column after temperature is R, constant Load effect is SG and variable load effect is SQ. Limit state equation of column is:
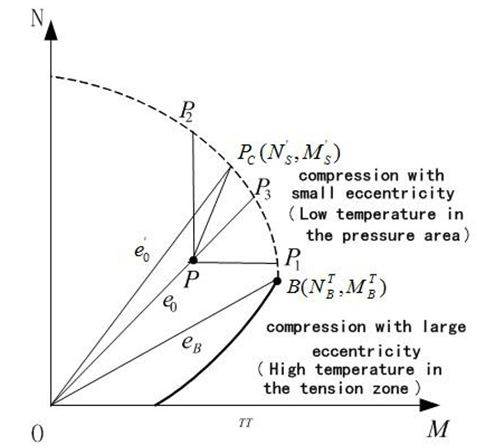
When the eccentric compression column withstands high temperature along the section height direction, whose axial force-bending moment envelope graph is left-right asymmetric, the peak point shifts to the right and small eccentric section expands on the high temperature side of eccentric compression, the large eccentric section reduces. RC column has severa failure paths under bending moment and axial force. Eccentricity e0 >0, axial force-bending moment graph is showed as Figure 1.
As shown in Figure 1, point B is a critical point between large and small eccentric compression damage. e ≥ eB, tension reinforcement in the high temperature of component firstly yields, and then concrete in compression zone is crushed, which large eccentric compression damage occurs. e < eB, concrete in low temperature of component is crushed firstly.
The same side of the compression steel has reached the compress yield stress strength, and small eccentric compression occurs. As shown in Figure 1, the curve is the limit state of RC columns one after high temperature. When load is within the curve, and column section is safe, on the contrary, when load is located outside of curve, the section is not safe.
When eccentricity e0 is a constant, axis force and bending moment is correlative. For example, the path P-P3 in Figure 1, eccentricity is variable, and e0 =Ms/Ns , axial force and bendingmoment change randomly. The paths P - Pc, P - P1 and P - P2 mean that axial force and bending moment is independent with each other.
According to the standard, permanent loads effect of building structure obeys normal distribution [20]. Variable load effect obeys extreme value I distribution. In this paper, resistance of RC column after fire is the sum of product of multiple random variables which obeys Logarithmic normal distribution by the central limit theorem. Segmented regression analysis of experiment data of average compress strength of reinforcement and concrete after fire in literature shows that variability of ϕc(t) and ϕyc(t) in equation (2) is very small, and meanwhile, variability of elastic modulus Es (T ) is small [21,22]. So all these variables can be treated as constant. Distribution of x can be obtained by the error transfer .Digital characteristic about random variables should be given, such as the mean and variation coefficient and probability distribution and so on, in this paper, each resistance and load variable used in the reliability analysis should be representative of values that would be expected in here, some variables used in reliability analysis used in this paper be given. A brief summary of dates that will be used in subsequent examples are presented in Table 1 [23].
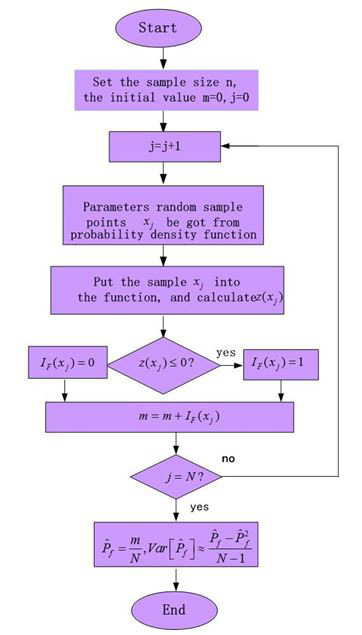
In this paper Monte Carlo method is used to analyze the reliability of RC eccentric compression column after fire, Flow chart showed as Figure 2.
Specific steps are as followed:
(1) Sample values of load, section dimension and material strength are calculated by probability distribution of load, section dimension and material strength.
(2) For the given initial eccentricity e0, relatively height of compression zone boundary ξb is determined
(3)  ,
, can be examined
If the formula is set up, large eccentric damage occurs in the component, if not, then small eccentric damage occurs in the component, x should be recalculated.
(4) According to x, axial capacity RN and moment capacity RM of column after fire can be calculated.
(5) By using of generation of random numbers, a group of random axial forces
Ns. And random bending moment Ms can be produced.
(6) Eccentricity e0 is calculated under random axial forces and random bending moment.
Then compression bearing capacity NR and flexural capacity MR are calculated.
(7) Z can be calculated by Equ.12, If Z < 0, then the component fail. Otherwise the component does not fail.
(8) Repeat the above process N (N = 1, 000, 000), the ratio of total number of component failure and N is failure probability of component.
By using the above method, reliability index of column with different fire-duration time and different eccentricity e0
A RC column has symmetrical reinforcement configuration, and section dimensions are:
b = 300mm, h = 400mm, concrete aggregate is siliceous, with the strength level: C30,
fc = 14.3MPa, thickness of concrete cover is 25mm ( as = 35mm ) . Reinforced in column has
symmetrical configuration f y = f y' = 300MPa . Area of reinforcement is As = A's = 2264mm2 .
Eccentricity e0 / h0 is 0~2.0. The initial temperature is T = 20 °C, and the column is encircled
by fire. Cooling method is a natural cooling. Reliability analysis of column is carried on with the fire-duration time: half an hour, one hour and one and a half hours. Here axial force effect and bending moment effect made by permanent load standard value and variable load
standard value are equal with each other:
SGK = 120kN(kN . m), SQK = 60kN(kN . m) .
Calculation of  and
and 
The values of and are shown in Table 2.
According to force characteristics of eccentric compression columns after fire, in this paper, bending moment and axial force are treated as two failure conditions to analyze the reliability of columns which are independent random variables and fully relevant random variables. Two types of reliability of column by using previous mentioned method are shown in Figure 3.
As shown in Figure 3, columns reliability indexes of two types of decrease with the increase of fire-duration time. When e0= 0, considering one failure path and two failure paths, reliability indexes of column after fire is same with each other. When eccentricity is small, reliability index calculated by two failure paths is bigger than the one calculated by one failure path, when eccentricity is large, situation is reversed. So when eccentricity is small, reliability calculated by two failure paths is not safe, and when eccentricity is large, reliability calculated by one failure path is not safe.
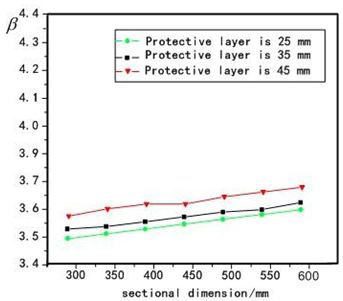
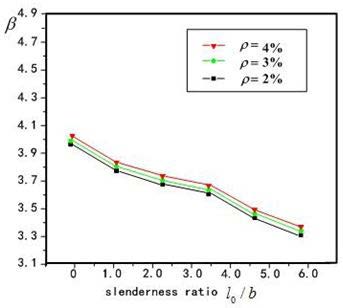
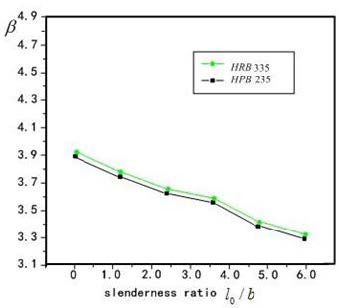
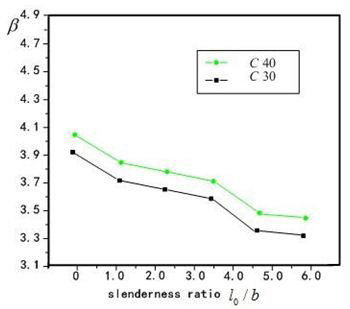
Factors influencing reliability index of columns are section dimension, strength of reinforcement and concrete, ratio of reinforcement ρs, slenderness ratio l0 / b, thickness of protective fire layer. The calculated method of examples is utilized to analyze the reliability index β, and the analyzed results showed as Figure 4-7, and conclusions got as following:
1. under the same strength of concrete and ration of reinforcement, sectional dimension
Is not influenced on columns reliability obviously, while thickness of protective fire layer is influenced on reliability index obviously.
2. Showed from Figure 4, with the increase on longitudinal bar ratio, the reliability index is also increase, which main on the lower variability of reinforcement strength,the increase on ratio of reinforcement make the variability of resistance become lower, so the reliability index increase, but the influence is not obviously.
3. Showed from Figure 4 and Figure 5 the influence on reliability index by concrete strength is obviously than reinforcement strength, on the whole the influences are not obviously 4. Showed from Figure 4 and Figure 5 and Figure 6, the influence on reliability index by slenderness
ratio l0 / b is more obviously, when l0 / b = 40,the reliability index is get β = 3. 3.
Strength reduced coefficients of reinforcement and concrete after fire are introduced, resistance model and limit state equations of RC eccentric compression column encircled by fire are established; Axis –moment correlative curve and several different failure paths of eccentric compression column subjected to fire are analyzed; Monte Carlo method is utilized to analyze the reliability of eccentric compression reinforcement concrete columns after high temperature under comprehensive considering failure paths. Analysis results indicate that Columns reliability indexes decrease with the increase of fire-duration time. When e0, Reliability indexes of column with different failure paths is same with each other. When eccentricity is small, reliability index calculated by two failure paths is bigger than the one calculated by one failure path, when eccentricity is large, reliability index calculated by two failure paths is smaller than the one calculated by one failure path. So reliability assessment of column subjected to fire should be taken two situations into account; several factors influenced on reliability index are analyzed, analyzed results indicated that slenderness and fire time influenced on reliability are obviously, especially when fire time is get t = 1.5h, the other factors such as section dimension, strength of concrete and reinforcement, ratio of reinforcement protective fire layer are influenced on reliability index are not so obviously.
There are a number of issues that need to be addressed in research to develop and implement rational reliability-based condition assessment criteria. The following issues have arisen in the writer’s own professional experience. Readers undoubtedly will be able to add to the list.
In contrast to new construction, the economic impact of required changes to damaged buildings to meet updated safety requirements may be very large; this is a significant current issue in the area of seismic rehabilitation. Many jurisdictions require that if renovations exceed some percent (for example,50%)of the value of the property, the building must be upgraded to conform to current standards (and,by inference, the level of reliability inherent in new construction). In other cases, a reduced level of performance may be approved by the authority having jurisdiction. What is the appropriate policy if the code loads have gone up and the building cannot meet the new code, even if it meets the old? What risk is acceptable in this case, and what target reliability measures should be met by the evaluation criteria? What are the legal implications of using assessment criteria for damaged buildings that are different from those used for new?
Validation of reliability models by comparing predicted and observed structural failure rates is not practical or informative for the majority of civil engineering structures because the failure rates are low. There are only limited failure data available, and seldom does a sufficient sample of a given type of structure accumulate before changes in technology or the economic climate cause changes in construction. Details of most structural failure investigations are held confidential. Because of these difficulties, the first generation of reliability-based codes was developed by calibration to existing acceptable practice for new construction. This calibration option requires rethinking in applying it to damaged construction, since what is existing acceptable practice is not clear. Many older structures were constructed with archaic materials. How does one determine strength criteria probability for members such as cast-iron columns or wrought-iron beams? Moreover, when old members are reinforced with new materials, what are appropriate strength criteria for the resulting composite structural member? How does one determine dimensions and other structural properties of repaired sections, e.g. slabs repaired by adding concrete, concrete columns strengthened with external steel reinforcing jackets, etc? Methods for determining such engineering properties are not well defined.
What are suitable limit states for evaluating damaged structures? Current design of new construction focuses on individual members. Consideration of the behavior of the structural system as a whole may pay handsome economic dividends in structures with even a modest capacity for load sharing. What sort of consideration (if any) should be given to nonstructural components? Structures post-fire, for example, partitions were not uncoupled from the frame as they are in new construction, giving rise to much stiffer structures. The beneficial effect of such stiffening might be taken into account in some way. How? For some limit states related to fire, strength is lesser in importance to ductility and performance is determined by construction detailing. How should one verify an energy dissipation limit state?
Finally, how does one go about codifying procedures for condition assessment of damaged buildings, given the unique nature of each situation? For a codification effort to be successful, certain generally applicable principles and procedures must be identified. As a minimum, the following would be necessary: a statement of general principles and requirements for acceptable structural component and system behavior, based on structural reliability; requirements for data collection by inspection and nondestructive evaluation; recommended statistically-based methods for analysis and synthesis of data; and a reliability-based but deterministically appearing performance check, load test, or other action required to verify safety. The code should support the engineer in addressing the factors identified previously: changes in load-carrying requirements due to changes in use, potential structural deterioration due to aggressive environmental factors, accidents or abuse; and service life extensions.
◆ Supported by Heilongjiang Natural Science Foundation (G023016003).
◆ Supported by Harbin Science and Technology Innovation Research Fund (G023316004).

.jpg)
.jpg)