
Tailored Oral Hygiene Approach Effectiveness on Glycaemic Control of Diabetic Patients
The link between periodontitis and type 2 Diabetes Mellitus (DM) has been long recognized. It is acknowledged that patients with diabetes are more prone to develop periodontal disease and conversely periodontal inflammation can affect glycosylated hemoglobin (HbA1c) levels. A customized oral hygiene protocol combined to effective periodontal therapy is crucial in maintenance of periodontal health in diabetic patients.
Aim: The purpose of this trial was an observational evaluation of the effectiveness of Tailored Brushing Method in addition to conventional periodontal treatment in improving the HbA1c value in type-2 diabetic patients.
Material and Methods: A six-months observational study with a cohort of 26 patients, whose mean age was 48.33 years was performed. Clinical periodontal examination including Plaque Index and Gingival Index was carried out and HbA1c value was monitored for all subjects at baseline, 3 and 6 months. Each patient was subjected to periodontal treatment and received tailored oral hygiene instructions, based on Tailored Brushing Method (TBM).
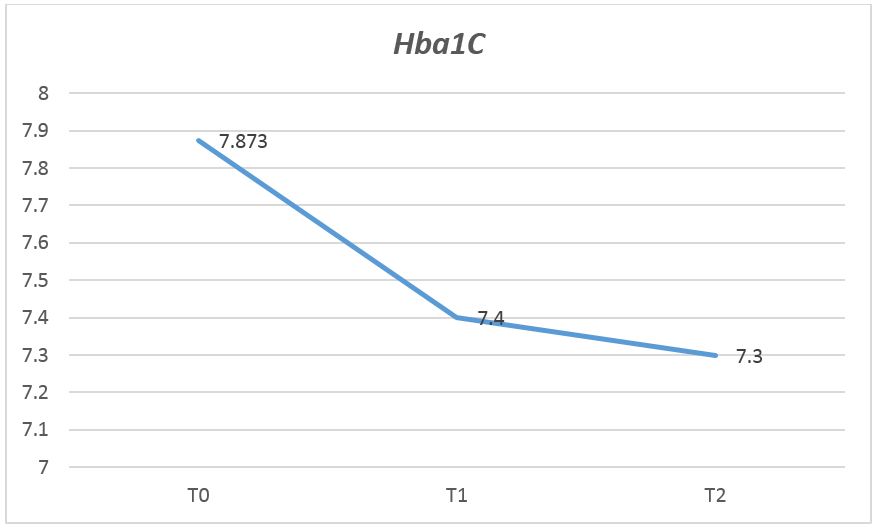
Results: A significant association between HbA1c and periodontal inflammation indices was revealed. The percentage difference between the means value of HbA1c at baseline and at six months decreased by 90.7%.
Conclusion: A customized clinical approach and oral hygiene regimen education play an integral role in sustaining favorable clinical outcomes in periodontal status and glycaemic control in diabetic patients.
Keywords: Tailored Brushing Method; Periodontal Disease; Type 2 Diabetes Mellitus; Glycaemic Control
The relationship between periodontitis and type 2 Diabetes Mellitus (DM) has long been recognized, but underlying mechanism is largely unknown. Diabetic patients are more prone to develop periodontal disease. Indeed, periodontitis has been repeatedly positively associated with Diabetes and it is well documented that periodontal inflammation may significantly affect diabetes increasing HbA1c levels [1-2]. Diabetes causes worsening of periodontal status and epidemiologic studies indicate consistently that gingival inflammation is a highly prevalent condition in diabetic individuals [3-4]. Furthermore, many authors report that periodontal treatment may be an effective therapy in contribution to improvement of HbA1c value [5]. Inflammation is the key mediator of this close bidirectional association. A number of studies have demonstrated elevated blood increased levels of inflammatory cytokines, especially TNF-α, CRP and mediators of oxidative stress in diabetic and periodontal patients. One of the mechanism by which diabetes seems to influence the periodontal condition is the production of advanced glycation end-products (AGEs). These toxic molecules generate an exacerbation of inflammatory response, contributing to periodontal tissue damage [6-7]. On the other hand, several clinical and epidemiologic studies suggest that pro-inflammatory cytokines release caused by periodontal inflammatory status may affect diabetes, promoting insulin resistance and glycaemic control [8-11]. Additionally, non-surgical periodontal therapy in conjunction to accurate oral hygiene regimen is demonstrated to improve glycaemic control. A comprehensive meta-analysis, conducted on randomized control trials (RCTs) published from 2014-2017 to investigate the effect of periodontal therapy on reduction of HbA1C revealed decreases ranged from 0.27% to 0.48% in 3-4 months following treatment. However, there is a paucity of data on long-term evaluation [12]. An individualized oral hygiene approach, based on concordance, is needed to support periodontal therapy in diabetic individuals with periodontal disease [12-14].
On considering a therapeutic interaction that is based on mutual participation of clinician and patient, the Tailored Brushing Method supports the relevance of this cooperative relationship [15,16]. Specifically, this method follows an oral hygiene approach consisting of two main stages: firstly, a meticulous intra-oral tissues evaluation and periodontal examination, followed by the case discussion between clinician and patient; in this phase, the evaluation is needed to identify potential alterations affecting oral tissues and to determine the gingival biotype [17-19]. Secondly, after the learning evaluation, a customized toothbrushing technique with specific tools is applied. In particular, a toothbrush with an arrangement bristle in tufts disposed on multilevel, with angled orientation [20,21], and interproximal brushes are advised based on examination, the oral hygiene regimen is discussed with patient in order to define a mutually acceptable solutions (Taylor, 1979). The purpose of this trial was an observational evaluation of the effectiveness of Tailored Brushing Method in addition to conventional periodontal treatment in improving the HbA1c value in type-2 diabetic patients.
The study included a cohort of 29 patients with type-2 diabetes mellitus (T2DM) and HbA1C ≥ 7. Exclusion criteria were as follows:
- edentulous patients and without periodontal inflammation;
- people who have undergone periodontal treatment within the last three months;
- Regular smokers;
- Pregnant women.
All included patients signed and dated an informed consent form. The study was conducted in accordance with the Declaration of Helsinki of 1995. Clinical periodontal examination including Plaque Index (Silness and Loe, 1964) and Gingival Index [18] at six sites per tooth for each patient (mesio-buccal, mid-buccal, disto-buccal, mesio-palatal, mid-palatal, disto-palatal) was recorded in order to assess information about inflammatory status at baseline, 3 and 6 months. HbA1c value was monitored for each patient at the three times. Each patient was subjected to non-surgical periodontal treatment, and personalized oral hygiene approach (TBM) was applied to establish customized oral hygiene regimen. This approach included the following operative sequences:
- Clinical diagnosis
- Active patient listening, in order to detect home oral hygiene routine, diet and lifestyle (voluptuous habits such as smoking and/
or a alcohol)
- Clinical intraoral and extra-oral examination, in order to assess the tissue biotype, presence of a diastema, recessions, enamel
lesions
- Topographical detection of biofilm with tritonal detector of bacterial plaque. This approach promotes the patient awareness.
Further, the detection of biofilm leads to verifying which areas where the patient accumulates the most plaque, showing where
its brushing technique is less effective
- Total deplaquing or selective polishing using specific granulometry per powder for each patient. The deplaquing included a supra-
and/or subgingival airpolishing with two different powder: glycine and sodium bicarbonate that were personalized according
with gingival biotype and presence of recessions and enamel lesions. The choise of differentiate granulometry is important to
avoid abrasion of teeth hard and soft tissues.
- Based on presence/absence of lesions and tissues alterations, mechanical and manual instrumentations were provided with
standard or personalised devices (COMBI TOUCH, Mectron): the universal insert was used to remove the considerable visible
tartar deposits (S6, MECTRON); the oscillatory movement removes the tartar respecting the enamel. It was used for coarse
ablation.
A triangular section insert and rounded surface with a tip more curve suitable for reaching the posterior and interproximal areas
was used (S2, MECTRON). A universal insert with triangular section and rounded surface was used for the gentle removal of
subgingival deposits (S1 S, MECTRON). Thin tip suitable for insertion into the pocket in an atraumatic way. Site-specific currettes
were used for manual instrumentation.
- Enamel remineralization: fluoride agents were chosen based on the score of the index Basic Erosive Wear Examination (BEWE)
index.
This phases are crucial in determining the tailored brushing method that varies in accordance with the presence of alteration, anatomical condition, teeth position and, finally, the capability of patient. After each stage, the patients were instructed to use of different toothbrushes, according with the clinical conditions and motivation degree. No standard brushing technique was used. The technique was established by the clinician together with the patient, sharing at the end of each session the needs and individual abilities. Each patient was guided in the movement with the help of a mirror, moving the toothbrush according to the dental anatomy. The pressure was measured according to the degree of potential enamel and/or gingival alterations. The type of toothbrush was choose according to:
• gum’s inflammation degree
• gum’s pain presence/absence
• teeth sensitivity
• anatomical conditions (dental overcrowding, diastema, gingival recessions)
• patient capability
Periodontal therapy was carried out according to the Dental BIOfilm Detection Topographic Technique (D-BIOTECH). This method involved [19-20] the use of minimally invasive mechanical instruments for supra- and sub-gingival airpolishing and debridement (COMBI Touch, Mectron) after topographic bacterial plaque identification (Plac-o-Tect, Directa).
A search for two-way connections between the improvement of periodontal indices and the improvement of blood levels of HbA1c, through Pearson’s correlation at baseline, 3 and 6 months was assessed.
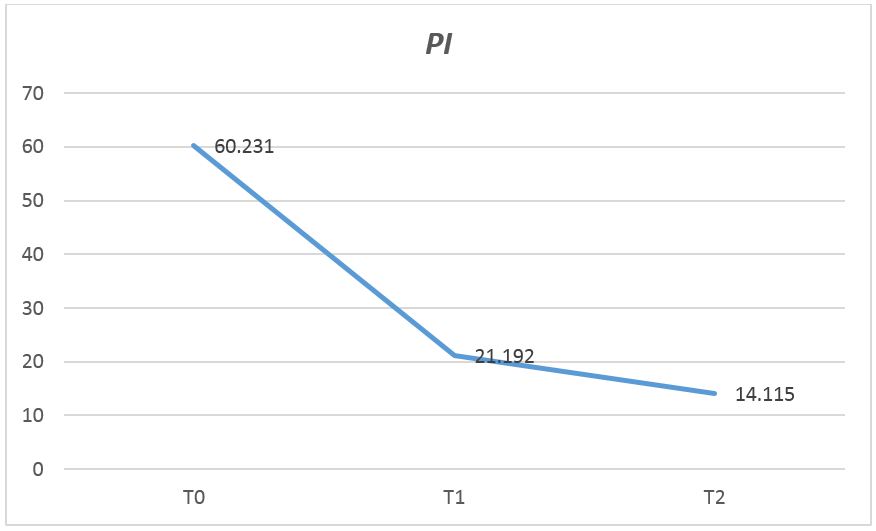
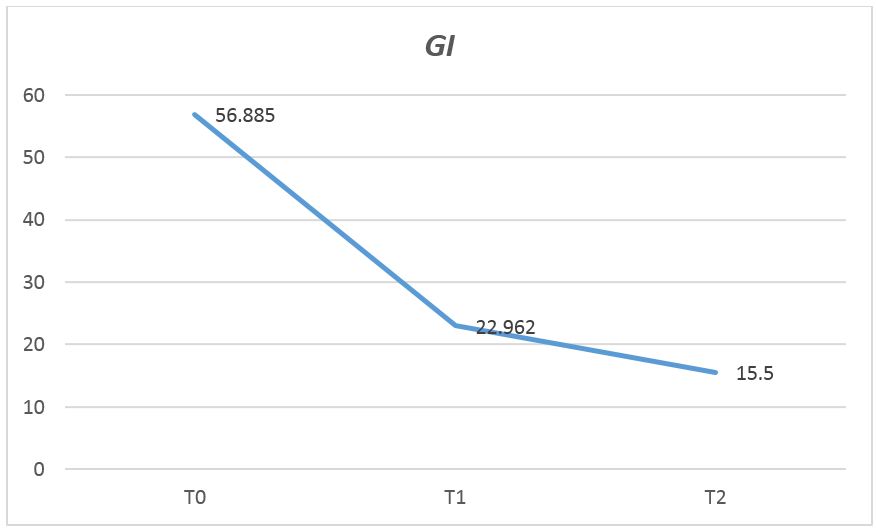
The simple correlation index does not detect a linear connection between HbA1c and PI and between HbA1c and GI in the different detection times. However, through the fixed effects regression model we found a significant relationship. The fixed effects regression model with panel data revealed the relationship between HbA1c and PI (Graph 1 and 2). It was decided not to include the GI variable in the regression because it was significantly correlated with PI. The data have been structured in a “panel”, with a Time variable that identifies the time units (0 - 3 months - 6 months), and an ID variable that identifies the patient. With this data structure we implemented a regression model that allows us to estimate the coefficient of the linear relationship between the two variables considering the effects fixed over time, and only taking into account the variations between patients (Tabel 1-4). The fact that over time patients have been continuously subjected to therapy makes this hypothesis credible. Under this assumption, the relationship between HbA1c and PI was positive (beta = 0.00388, p = 0.013) (Tabel 5,6). Graphs 3-5 show the trend of the PI, GI and HbA1c means over the three times. The Model does not have a high level of adaptation to the data (R-square = 0.115), margins for improvement are possible considering the possibility of inserting additional explanatory variables useful to explain the variation of HbA1c.
Results of this study support the effectiveness of periodontal treatment on glycaemic control in patients with type 2 Diabetes [22,23]. Tailored method focus demonstrated significant reductions in their levels of glycated hemoglobin following treatment, and those reductions were maintained at follow-up. Thus, in addition to non-surgical periodontal treatment, individualized oral hygiene regimen is effective to improve glycaemic control [24,25].
Linear with previously clinical trial demonstrating improvement of periodontal therapy on glycaemic control in diabetic patients, our results support this effort. Based on current evidence, diabetic subjects need to receive an incisive and assiduous bacterial plaque control. An individualized oral hygiene regimen is necessary to preserve healthy periodontal status. Our study showed that diabetic patients benefit from improvement periodontal inflammatory status, incorporating Tailored Brushing Method (TBM) [1]. Through this approach is possible to achieve the goal of optimal patient concordance and oral health education. Achieving good patient education outcomes is possible when patient care individualization is a priority [2,3].

.JPG)
.JPG)
.JPG)
.JPG)
.JPG)
.JPG)
.JPG)
.JPG)
.JPG)
.JPG)
.JPG)
.JPG)