The Effects of a Transformational Nursing Leadership Program on Perceived Leader Behaviors
Objective: To evaluate the effects of a transformational leadership program on nurse leaders’ perceived practices in one California hospital.
Background: US health care organizations are developing methods to strengthen Transformational Leadership (TL) practices within nursing leadership to enhance staff nurse performance improve motivation and reduce staff turn-over.
Methods: The research study used a quasi-experimental single-group pretest-post-test design based on Kouzes and Posner’s Transformational Leadership Model (TLM). The convenience sample was drawn from members of the Magnet Leadership Council.
Results: The self-reported responses on three out of five Leadership Practice Inventory (LPI) subscales “Model the Way”, “Inspire a Shared Vision” and “Challenge the Process” significantly improved from pretest to post-test (p<.05). Nursing leader years of practice were significantly related to the posttest LPI “Challenge the Process” subscale scores (r=.40, p<.05).
Conclusion: The TL Development Program had a significant effect on self-reported nursing leadership practices. Findings support results of previously published studies of similar programs. Details of the TL educational intervention design are provided with future recommendations.
Keywords: Transformational Leadership; Nursing Leadership Program; Education; Evaluation; Leadership Practices Inventory
Ten years ago, the American Nurses Credentialing Center (ANCC) emphasized the importance of Transformational Leadership (TL) practice by including TL as a component in the revised Magnet Model [1]. This requires “visionary leadership” at all levels of health care organizations [2]. A number of TL interventions have been tested in the United States and internationally. The Kouzes and Posner Transformational Leadership Model (TLM) has been a common framework for these studies [3]. In preparation for an initial ANCC Magnet Recognition®, the nursing department of a southern California hospital offered a professional development program for nurse leaders. The program was based on the Kouzes and Posner’s TLM [3]. This report describes the details of the program and the effects on the nurse leaders’ perceived leadership behaviors.
Various theorists and investigators have published information and research regarding transformational leadership conceptual frameworks. In 1978, Burns was one the first theorists to explore transformational leaders’ ability to motivate followers [4]. The theory was predicated on the premise that transformational leaders recognize, utilize and satisfy their follower’s motives and needs, which is the foundation for staff engagement. In the 1980s, through their evidence-based research, Kouzes and Posner built their Transformational Leadership Model (TLM) on studies of previous TL models by Burns, and Bass and Steidlmeier [3-5]. The TLM posits that effective transformational leaders can influence, inspire and motivate followers to create a shared vision and sense of purpose and commitment within the organization. The TLM includes five critical TL practices: “Model the Way” – setting or leading by example; “Inspire a Shared Vision”- leading with a focus on the future; “Challenge the Process” - changing the status quo; “Enable Others to Act” - fostering collaboration and “Encourage the Heart” - recognizing contributions and appreciate individual excellence.
Over the last 40 years, the published TL-based research studies utilized a variety of measures to assess leadership behaviors, including self-reports of TL practices, staff reports of leader behaviors, or TL interventions with TL practice self-reports and/or staff observations. Few published TL interventional research studies included measures of leader perceptions with additional staff observations of nursing leadership practice.
During 2006-2008, three descriptive studies of U.S. nurse leader perceived TL practices and staff observations of TL leader behavior were identified in the literature [6-8]. Two of the studies found significant correlations between leader perceived TL practices and staff nurse reports about their organization: McGuire and Kennerly] - Organizational Commitment (r=0.393, p<0.01); Casida and Pinto-Zipp - Organizational Culture (r=0.59, p=0.00) [6,7]. Failla and Stichler found a significant positive relationship between leader self-reported TL behaviors and staff job satisfaction (r=0.348, P<0.5) [8]. Findings from all three studies support Transformational Leadership practices positively affect nurse job satisfaction. As a recurrent theme in self-assessment surveys, two of the three leaders rated themselves higher on TL skills than reported observations by staff, but the differences were not significant [6,8].
Five US studies published since 2009 provided nurse leader behavior expressed through Kouzes and Posner’s LPI self-assessment survey responses [9]. These studies addressed Magnet and non-Magnet hospital nurse leaders’ TL practices [10-14]. The CNOs from all hospitals in four studies and CNOs and Directors in a fifth study rated their transformational leadership skills highest in two LPI categories “Enable Others to Act” and “Model the Way”. The results support the importance of leading by example and leaders sharing their vision to motivate their staff. One recent survey of Magnet CNOs found that older CNOs and those with more experience had higher LPI-S scores on their self-reports of their TL practices [10]. Findings from this study indicate TL qualities develop over time.
From 2012 to 2015, three international investigators reported significant correlations between nurse leaders perceived TL practices and their staff nurse job satisfaction [15-17]. Wang,et al.. used a Chinese version of Kouzes and Posner’s LPI-S and LPI-O and the Nurse Job Satisfaction Scale (NJSS) to evaluate Nurse Managers’ leadership practices [15]. In addition to the significant correlation between the Leaders’ total LPI-S scores and their staff RNs’ total NJSS job satisfaction scores (r=0.556, P<0.001), all subscale scores of the two measures were significantly correlated. The investigators report the results support previous studies of transformational leader behavior and staff job satisfaction. A study in multiple Taiwanese hospitals had similar findings regarding the relationship of staff nurse job satisfaction and their perceptions of immediate nurse supervisor TL behaviors [16]. The participants completed four measures: the Multifactor Leadership Questionnaire (MLQ), the Job Content Questionnaire (JCQ), the job satisfaction scale of the Occupational Stress Indicator (OSI) survey, the Organisational Commitment Questionnaire (OCQ), and the General Health Questionnaire (GHQ-12) to assess staff well-being. The staff nurse observations of leader TL practice (MLQ scores) were significantly correlated to their reported “Supervisor Support” (r=0.735, P=0.01), “Job Satisfaction” (r=0.475, P=0.01), and “Organisational Commitment” (r=0.321, P=0.01). An unusual finding was the significant negative correlation between TL practice and staff well-being (r=-0.151, P=0.01). Eneh, et al.. conducted TL surveys of over 1500 staff nurses at four Finnish hospitals to determine their perceptions of their direct managers and nursing directors [17]. Their Transformational Leadership Scale assessed perceptions of leadership ethics, management of the nursing process, provision of feedback and rewards for staff, and encouragement of staff professional development. Staff nurse perceptions of their managers’ TL behaviors was higher than self- reported by their leaders. The staff had the most positive perceptions of nurse leaders in three TL areas: ethics p<0.05, nursing process management p<0.05, and professional development opportunities. The staff nurses expressed the need for more feedback on their performance and rewards.
Three longitudinal international studies examined the impact of TL programs on nurse managers’ self-reported practices and their staff observations of manager behaviors. Lee, et al.. conducted a 15-month Leadership Development Initiative (LDI) program in a Canadian university hospital [18]. The investigation self-reported outcome measures included Kouzes and Posner’s LPI-S for leadership practice and the Maslach Burnout Inventory (MBI). Following the program, participants’ LPI-S “Inspire a Shared Vision” subscale scores were significantly higher than before the program (P<0.01). Regarding the MBI burnout scores after the program, the positive relationship of the leaders’ “Model the Way” LPI subscale scores had a significant positive relationship to the MBI professional efficacy subscale (r=0.345, P <0.01), and “Enabling Others to Act” and “Inspire a Shared Vision” had significant negative correlations to the MBI cynicism subscale (r= -0.316, P < 0.01, & r= -0.327 P < 0.01, respectively).
Duygulu and Kublay conducted a 14-month TL program for charge nurse leaders at a hospital in Turkey [19]. Following a TL Program for charge nurses, both the charge nurses’ perceived leadership practice (LPI-S) scores and staff nurse observation scores of their leaders’ TL behavior (LPI-O) were significantly higher. Additionally, the LPI-S and LPI-O scores were significantly related for three of the five subscales: “Model the Way” (P=0.028), “Encouraging the Heart” (P=0.001) and “Enabling Others to Act” (P=0.001). These results are similar to previous results of staff observed nurse leaders’ TL behavior following TL development program training.
The findings of Martin et al.. two-year TL Program for clinical nurse leaders in a hospital in Switzerland were similar to the study by Duygulu and Kublay [19,20]. Before and after the Program, the nurse leaders completed Kouzes and Posner’s LP-S and staff nurse s reported their observations of leader behavior on the LPI-O. Following the program, leader self-reports and staff observations of leader behaviors were significantly higher on two subscales: “Inspire a Shared Vision” (self P=0.011; observer P=0.015) and “Challenge the Process” (self P=0.004; observer P=0.047). Post-program results in two out of three studies, leader self-perceptions reported scores had significantly improved (P<0.05) in at least one TL subscale [19,20].
Two different longitudinal studies conducted in the U.S examined the impact of TL programs on nurse managers’ self-reported practices and their staff observations of manager behaviors. Both studies resulted in improved LPI-O and LPI-S scores but did not find significant relationship. Krugman, et al.. conducted a 16-year study of a TL intervention [21]. The investigators compared LPI-S outcomes for a group of relief charge nurses and a group of permanent charge nurses (CN) using the LPI TL assessment tools. Following the intervention, the total mean LPI-S and subscale scores of the two groups were not significantly different. In 2016, West, et al.. published results from a 12-month leadership program. Ten months after the program, the 15 members of the Nurses Emerging as Leaders (NEL) experimental group completed two leadership inventories, ie Kouzes and Posner’s LPI-S and Nurse Manager Skills Inventory (NMSI) [22]. The staff of the nurse-leader group completed the LPI-O. The “Inspire a Shared Vision” subscale scores ranked in the top two TL Leader behaviors rated by the leaders and the staff. The leader self-reports and staff observations differed on their perceptions of the leaders’ “Challenge the Process” (LPI-S > LIP-O and “Modeling the Way” LPI-O > LPI-S). Authors did not include any levels of significance.
Kouzes and Posner’s Transformational Leadership Model (TLM) guided this study [3]. The Transformational Leadership theory posits that a positive relationship between a leader’s ability to engage, influence and inspire followers will lead to a collective endeavor of purpose and commitment to a common enterprise [3].
The research study used a quasi-experimental single-group pretest-post-test design based on Kouzes and Posner’s Transformational Leadership Model (TLM). The convenience sample was drawn from members of the Magnet Leadership Council.
Nurse leaders who participate in a 20-week Transformational Leadership Educational Leadership Challenge program, with self-study and monthly discussion, will significantly improve their self-reported leadership practices as measured by the Kouzes and Posner’s Leadership Practices Inventory (LPI-S) [9].
To evaluate the effectiveness of a nursing leadership TLM program, the study had a quasi-experimental single group pre-test and post-test design.
Transformational Leadership Measures: To assess participants’ perceived transformational leadership (TL) practices before and after the Leadership Challenge Program, the participants completed Kouzes and Posner’s 30-item self-reported Leadership Practices Inventory (LPI-S) [9]. The 30 items are divided into five components that represent the Five Practices of Exemplary Leadership of Kouzes and Posner’s Transformational Leadership Model: “Model the Way”, “Inspire a Vision”, “Challenge the Process”, “Enable Others to Act”, “Encourage the Heart”. Each component has six questions. The responses to each question are organized on a Likert type ordinal scale (10 = “almost always” to 1 = “almost never”). Responses to the six items within each of the five components are summed to create five separate subscale scores, each with a potential range of 6 to 60 points. The five separate subscale scores are summed to create a total LPI-S score with a possible range of 30 to 300. Previous research indicates the LPI-S internal consistency reliability Cronbach alpha for each of the five subscales is > 0.70 [23].
Professional Characteristics and Level of Program Participation: The baseline survey included four professional characteristic questions: years served as a manager or leader, number of employees supervised the number of previous leadership/management training courses and history of the previous assessment of leadership skills. The post-test included two additional professional characteristic questions: year of graduation from a basic nursing program, and years employed as an RN, along with nine Program questions regarding Leadership Program knowledge and recommendations for improvement with nominal, ordinal and ratio response categories.
Setting and Sample Recruitment: The study took place in a 300-bed California community hospital system in 2013. The target population was a cross-section of inpatient nurse leaders, i.e. directors, managers and charge nurses. Prior to the Program, the hospital and university Institutional Review Boards (IRB) approved all study methods. The sampling pool included 46 leaders who enrolled in the Leadership Program. Participation in the evaluation research was voluntary; 35 leaders signed the informed consent to participate in the study.
The Program participants were recruited in two ways. First, the investigators presented the overview of the Program and the associated evaluation Research study to the hospital nursing leadership council attendees and clarified any questions. Secondly, a digital invitation was sent to Council members as well as other nurse leaders identified for potential participation in the program. The invitation included all the details regarding the leadership program and the research component.
The Clinical Leadership Program: The TL Program was offered at the end of four monthly Leadership Council meetings over a 20-week time period. The four program sessions covered five TL modules that each addressed one of the Kouzes and Posner’s TL Model components, (i.e.) “Model the Way”, “Inspire a Shared Vision”, “Challenge the Process”, “Enable Others to Act”, and “Encourage the Heart”[9]. The modules included chapter readings from the Kouzes and Posner’s book, The Leadership Challenge, supplemental readings from the current literature, and directions for each participant to consider an example from his/her own practice (Table 1) [3].
For data analysis, the research team used the Statistical Package for the Social Sciences (SPSS) 21 for Windows [23]. Once the Nurse Leaders’ TL Program ended and all data had been entered, the team used descriptive statistics techniques to determine the characteristics of the sample and their pre-test and post-test LPI-S responses to the 30 individual items, the five subscale and total LPI-S scores [23]. For data entry reliability analysis, the principal investigator selected a 10% random sample (n=4) of the participants’ original surveys. An experienced RN reentered the survey data. This subset of data was compared to the data entered by the primary investigator. No data entry errors were found, providing a 100% agreement of data entry reliability.
Of the 35 study volunteers who submitted the initial pre-test survey, 26 completed the post-test, for a 74% study retention rate. The leadership study volunteers ranged in age from 40 to 50, with a mean of 28 years as an RN (range = 5 to 44 years). The leaders’ management experience ranged from 0 to 35 years (M=11.36), and they reported supervision of 1 to 115 employees (M=29). When asked about their previous leadership skill assessments and courses, 57% had completed at least one leadership assessment and attended a mean number of six leadership courses. The characteristics and pretest LPI values of the initial 35 volunteers and the final sample of 26 were not significantly different. See Table 2 for the professional characteristics of the 26 leaders who completed the program.
This sample of leaders initially had high perceptions of their transformational leadership skills. The pre-test total LPI-S mean score was 232 of 300 (SD=30.4; 77.3% level), with an even distribution of the subscale scores. All of the mean scores on the five LPI components (“Enable Others to Act”, “Encourage the Heart”, “Model the Way”, “Challenge the Process”, and “Inspire the Vision”) fell above the 75% level (range = 77.3% to 82%).
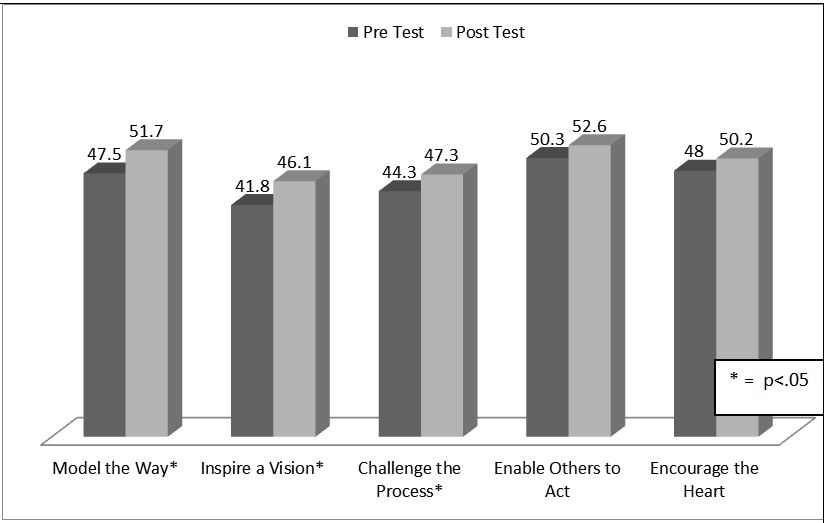
Nurse leaders who participate in a 20-week Transformational Leadership educational Leadership Challenge program, with self-study and monthly discussion, will significantly improve their self-reported leadership practices as measured by the Kouzes and Posner’s Leadership Practices Inventory (LPI-S) [9]. The 26 nurse leaders who completed the Transformational Leadership (TL) Program significantly improved their self-perceived leadership practice from a pretest mean score of 232 to a post-test mean score of 247 (paired t-test =2.63, df=22, p=0.015). This represented a 5% increase in their scores. The research hypothesis was accepted. When the baseline and post-education LPI-S subscale mean scores were compared, three of the five subscale mean scores significantly improved: “Model the Way” (t =2.8; p=0.01); “Inspire a Shared Vision” (t= 2.5; p=0.02) and “Challenge the Process” (t= 2.18; p=0.04). Participants’ post-intervention LPI subscale mean scores ranged from the 70th percentile to the 88th percentile on a 60-point potential score. Mean subscale scores are included in Figure 1and Table 3.
Among the professional characteristics of the sample, only the number of years as an RN was significantly related to the LPI-S post-test “Challenge the Process” subscale score (r =0.40, p<0.05). The leader participants reported completion of 66.5% Posner & Kouzes Readings and 59.2% of current assigned Program assigned readings regarding practice request. The number of assigned readings was significantly related to the post-test LPI-S total score (r = 0.41, p<0.05) and the LPI “Challenge the Process” subscale score (r =0.50, p<0.05).
Before they attended the Leadership Program, the current sample of nurse leaders, from charge nurses to directors, reported high perceptions of their Transformational Leadership practices (77th percentile). Even so, their post-test LPI-S mean scores were significantly higher following the Program. The majority of these findings are similar to five previous TL studies. [6,8,10-14,19,20]. All six sets of nurse leaders’ self-perceived TL styles significantly improved on two of the same subscales: “Inspire a Vision” and “Challenge the Process”. Following the program, the current sample of nurse leaders also reflected improvement in the LPI-S subscale “Enable Others to Act”. The nursing leaders in Failla and Stichler, Clavelle, et al. and Herman, et al.. also improved their LPI-S mean scores on the “Modeling the Way” subscale [8,12,13]. All these findings provide additional evidence that management and organizations should invest in annual dedicated professional development programs for leaders which include post evaluations to determine changes in outcome measures. See Table 4 for comparisons of the current and previous program study results.
This Leadership Program evaluation research study had several limitations. The single group design with no comparison group limits the generalizability of the results. The small sample size is a potential limitation. Of the 46nurse leaders attending the program, 35 volunteered to participate in the research and only 26 completed the post-test. External validity also might be threatened by the lack of knowledge about the individuals who elected not to participate. The positive outcomes might have been due to the self-selected sample.
The LPI measure of TL has a potential limitation. Although the instrument had been validated in a number of nursing studies, no benchmarks have been established to differentiate strong TL leaders from leaders who demonstrate poor TL leader behaviors. Internal validity during the educational intervention could be challenged by two Leadership Program problems. First, nursing administrators and lower level leaders attended the meetings together. As a result, lower level leaders might have been reluctant to fully disclose issues during discussion due to the presence of their superiors. This potential was revealed in post-study anonymous recommendation to schedule programs designed solely for lower level leaders. Secondly, in the midst of this Leadership Program, nursing administration scheduled formal leadership review classes for leaders to prepare them for nurse leadership certification. Self-reports of some study dropouts indicated this affected their completion of this TL program and research study.
Prior to the program, leaders expressed interest in the timing of the Program that followed the regular monthly Leadership Council meetings. However, post-program comments indicated scheduling of a professional development program at the end of a long day was difficult. Leaders were restless and before one or two sessions ended, some were called away for problems in their practice area.
This Program and the evaluation research study were developed at the recommendation of the Leadership Council members, with representatives of directors, managers and charge nurses across the hospital campus. They expressed the importance of Transformational Leadership Practices to strengthen the organizational culture. The positive outcomes regarding changes in the leaders’ perceptions of their TL practices become additional evidence that management and organizations should invest in annual dedicated professional development practice programs. Evaluation of the Programs’ impact on organizational change is an important component for any future leadership program. TL Programs should be a requirement for leadership advancement and some programs should be scheduled for asynchronous participation. This would allow more individuals the opportunity to enroll and participate on their own time. Attaching CE credits to each program may be more appealing for required participation. This is especially important as more nurse leaders become certified. One additional recommendation was made by the leaders who participated in this Program. Program participants who submitted their anonymous post-program surveys reported a need for more feedback and interpretation of their personal LPI-S scores and include staff observations next time. This would provide more content for their professional growth. Participants reported positive feedback on Program curriculum (i.e.) weekly lesson plan, readings from the text, associated current leadership articles and questions for practice discussion. This is important for anyone replicating this study to include these components in their program. Embracing a mentoring environment at all levels of leadership would give rise to a culture in which nursing leaders not only enjoy learning opportunities but can share experiences and receive needed feedback.
The authors would like to thank Dr. Margaret Beaman Ph.D., RN Nursing Research Consultant for her assistance in data collection, coordination with the IRB process and study guidance. We would also like to thank Professor Roy Ann Sherrod, DSN, RN, CNL, and CNE for her advisement and support of this study.