The Hepatoprotective Properties of Methanolic Extract of Garcinia Kola Administration on Azathioprine-Induced Liver Toxicity of Adult Sprague-Dawley Rats
Despite the prevalent clinical use of Azathioprine in the treatment of disease, serious toxic side effects comprising the liver toxicity undermines its therapeutic efficacy. This, study explored the possible hepatoprotective properties of methanolic extract of Garcinia kola administration on Azathioprine-induced liver toxicity. The medicinal importance of Garcinia kola is based mainly on the phytochemical components of the plant.
Thirty adult Sprague-Dawley rats were used and were grouped (A-F) with five animals each. Group A served as control, Group B received Azathioprine at 10 mg/kg, Group C received Garcinia kola at 100 mg/kg, Group D received Azathioprine at 10 mg/kg and Garcinia kola at 100 mg/kg, Group E received Garcinia kola at 100 mg/kg and Azathioprine at 10 mg/kg and Group F received Garcinia kola at 100 mg/kg and Azathioprine at 10 mg/kg simultaneously.
Result showed decrease in body weight for the treatment groups. There was significant increase in the activities of ALT, AST and ALP that may be attributed to the liver injury produced by Azathioprine intake in Group B. Also, the activities of CAT were significantly reduced with no significant changes in the activities of SOD in Group B. This is an indication of increased lipid peroxidants. CAT in pre-treated, post-treated and co-treated groups showed increased activities that may result from scavenging of radicals generated by azathioprine. Sections showed central vein wall fibrosis and peri-portal inflammation in Group B, possibly as a result of formation of highly reactive radicals generated by the drug. However, in pre-treated, post-treated and co-treated groups, the cytoarchitecture of the cell was retained.
From the study, the administration of Garcinia kola extract may be beneficial in the treatment of Azathioprine – induced hepatic toxicity as the antioxidant properties of Garcinia kola may be responsible for the protective effects.
Keywords:Garcinia kola; Azathioprine; Liver; Sprague-Dawley; Histology
Drugs are used to treat, prevent, cure diseases and are considered as an essential part of healthcare in most societies. The extent of the development of drugs has brought benefit upon humanity as there are numerous examples of significant reduction in mortality and morbidity. However, chemotherapy continuously push the borders for cancer survival rates [1]. Although, it is clear that drugs are not safe as they interfere with physiological processes throughout the human body in ways that are incompletely understood.
The liver is the major organ involved in drug metabolism and excretion as the hepatocytes carry out these functions and possess the majority of the enzymes involved in metabolism of drugs and food substances. They have the most extensive network of smooth endoplasmic reticulum of all cell types in the body. The expression of the xenobiotic metabolizing enzymes is a strictly regulated and controlled mechanism.
Azathioprine is an example of thiopurine, anti-metabolite widely used in the treatment of diseased conditions like cancer, rheumatoid arthritis, psoriasis, inflammatory bowel disease and in the prevention of rejection following organ transplantation [2,3]. It is an inhibitor of purine metabolism, causing DNA damage; and thiopurine-induced myelosuppression is common in individuals with inflammatory bowel disease [4].
Following oral ingestion of Azathioprine, it is metabolized into the active 6-mercaptopurine, which impedes DNA synthesis thereby inhibiting the proliferation of cells, especially fast-growing lymphocytes. T-cells and B-cells are particularly affected by the inhibition of purine synthesis [5]. By suppressing the immune system, and lowering the number of infection-fighting white blood cells, Azathioprine makes the individual more susceptible to infection. Azathioprine administration has been associated with organ toxicity, affecting organs such as the kidneys, liver and gonads [6,7]. It also induces tissue oxidative stress [8]. It has even been reported that 3.5% of 173 inflammatory bowel disease patients treated with Azathioprine developed hepatitis as a consequence of treatment [9]. Hepatotoxicity is thus an unpredictable side effect of the drug, whose pathogenic mechanism remains unknown. Azathioprine metabolism in rat hepatocytes leads to GSH depletion, mitochondrial injury, decreased ATP levels, and cell death [10]. The potential for developing phytomedicine into various health care products appears rewarding, both from the perspective of economy and safety. Friedman et al., and Serafinao et al., noted that many plant extracts are quite effective than the synthetic ones with no or insignificant side effects and very little scientific research on their biological activity has been worked out [11,12].
Plants are known to provide a source of inspiration for novel drug compounds and this is sequel to the fact that medicines derived from plants have made large contributions to human health and well-being as a great percentage of human population in developing countries depend directly on traditional medicine for their primary health care as it is said to have less side effects, easier to consume, easily available and affordable [13,14]. The dependence on traditional medicines is attributed to cultural background, beliefs of the people and inability to access orthodox medication [15]. One of such is Garcinia kola, a plant in the family Guttiferae. The plant, which is found in moist forests, grows up to a height of 12 meters [16]. It is referred to as “Bitter kola” or “Male kola” because of its bitter taste and the perceived aphrodisiac activity respectively [16]. The bitter kola plant is found in countries across west and central Africa and it is distributed by man around the towns and villages of such countries like; Nigeria, Ghana, Cameroon, Sierra Leone, Togo, Congo Democratic Republic, Angola, Liberia and Gambia.
The medicinal importance of Garcinia kola is based mainly on the phytochemical components of the plant. From its roots to its leaves, the plant is known to contain several phytochemicals noted for their medicinal importance [13]. Phytochemicals compounds that have been isolated from Garcinia kola include Oleoresin, Tannin, Saponins, Alkaloids, Cardiac glycoside, Biflavonoids such as Kolaflavonone, and 2 hydroxyflavonoids. In addition, two new Chromanols; Garcioic and Garcinal together with Tocotrienol have been reportedly isolated from Garcinia kola [17]. The biflavonoids are the more abundant compounds in Garcinia kola, while the kolaflavones are the major components of kolavirons [17]. Other constituents of Garcinia kola include 1, 3, 8 and 11, respectively benzophenone, Garcinia biflavinones (GB-1, GB-2) and kola flavonone [17]. The biological activities of flavonoids include action against allergies, inflammation, free radicals, and hepatoxins [17]. Garcinia kola seed is also used in the treatment of liver disease and diarrhea [18,19]. Garcinia kola exhibits purgative, antiparasitic, anti-inflammatory, antibacterial and antiviral properties [20]. Garcinia kola enjoys a folk reputation in the management of sickle cell disease (SCD), as poison antidote and in the preservation of lipid food products prone to rancidity [20]. Traditionally, Garcinia kola is regarded as a highly prized item and it is served to visitors in social gatherings as a mark of honour and also in the treatment of headache, cough, colic pains and gonorrhoea [18]. Scientifically, the potentials of Garcinia kola as a therapeutic agent have been reported and these include hepato-protective, antithrombotic and antibacterial [21-26].
Considering the enormous relevance of Garcinia kola in folkloric medicine, this study was designed to investigate the hepatoprotective effect of Methanolic Garcinia kola extract on azathioprine induced liver toxicity in Sprague-dawley rats as experimental models.
A commercial formulation of azathioprine (AZA) 50 mg tablets was obtained from Neat Line Pharmacy, Ogudu, Lagos State, Nigeria
The seeds of Garcinia kola were procured from a local market in Mushin, Lagos State, Nigeria. It was identified in the Department of Botany, University of Lagos, Nigeria. The seeds were decocted and subsequently cut into small pieces so as to increase the surface area. The latter process increased the drying rate of the bitter kola that was carried out under the hot sun. The grinding of the dried pieces into fine powder followed this procedure. Using absolute methanol as the solvent, extraction was carried out by using the Soxhlet extractor as described by Tairu et al., and the percentage yield was at 34.6% [27].
Animals
A total of thirty healthy Sprague-Dawley rats about eight to ten weeks old weighing between 160±20 g were used for this study. They were housed in standard well ventilated wire mesh plastic cages in the Animal room of the Department of Anatomy, College of Medicine of the University of Lagos under standard room temperature ranging between 26 °C-28 °C and relative humidity of 50-55%. The animals were exposed to twelve hours light and twelve hours dark cycle and were left to acclimatize for a period of two weeks before the commencement of the experiment. The animals were identified by different ear tags. All experimental procedures and techniques were approved by the departmental committee on the use and care of animals and tissue collection. The rats were allowed unrestricted access to water and commercial rat chow ad libitum. The weights of the animals were taken every week.
Experimental Design
The animals were divided into six groups of five animals each as follows:-
Group A; received distilled water only, served as control
Group B; received Azathioprine at 10 mg/kg
Group C; received Garcinia kola at 100 mg/kg
Group D; received Azathioprine at 10 mg/kg and Garcinia kola at 100 mg/kg
Group E; received Garcinia kola at 100 mg/kg and Azathioprine at 10 mg/kg
Group F; received Garcinia kola at 100 mg/kg and Azathioprine at 10 mg/kg simultaneously
Administration was via the oral route, with the use of a feeding tube (size 6) for 4 weeks after acclimatization. The body weight of animals were taken and recorded weekly.
At the end of administration, the rats were sacrificed using ketamine as anesthesia; an anterior abdominal incision was performed and the liver was exercised. The organ was divided into two halves; the right lobe for histology and the left lobe for biochemical analysis.
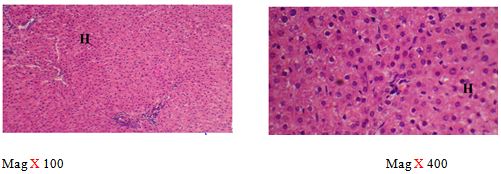
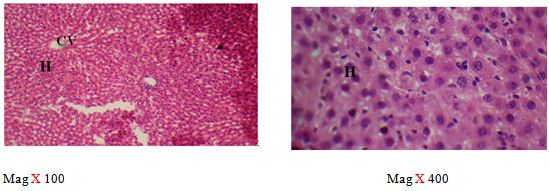
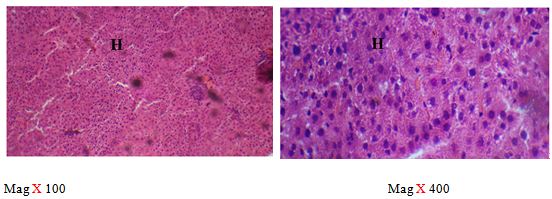
The right lobe was transferred into a universal bottle containing 10% formal saline for 72 hours. Tissues were processed for microscopic examination using a standard protocol and 5 μm thick paraffin sections were made. Slides were stained with routine haematoxylin and eosin stains and photomicrographs were made at a magnification of 100 and 400 using Olympus and leica microscopes [28].
A portion of the liver from each group were washed in ice cold 1.15% KCl solution, blotted and weighed. They were then homogenized with 0.1M phosphate buffer (pH 7.2). The resulting homogenate was centrifuged at 2500 rmp speed for 15 mins. Thereafter, it was removed from the centrifuge and the supernatant was decanted and stored at -80 °C until analysis.
Superoxide Dismutase (SOD) was determined by its ability to inhibit the auto-oxidation of epinephrine determined by the increase in absorbance at 480 nm as described by [29].
Catalase (CAT) activity was determined according to [30]. It was assayed calorimetrically at 620 nm and expressed as μmoles of H2O2 consumed/min/mg protein at 25 °C.
Malondialdehyde (MDA) an index of lipid peroxidation was determined using the method of Buege and Aust [31]. The supernatant was removed and the absorbance read at 532 nm against a blank. MDA was calculated using the molar extinction coefficient for MDATBA- complex of 1.56 × 10⁵ M-1CM-1.
The protein concentration was determined using the Biuret method by measuring the intensity of the color of the complex formed by copper sulfate at alkaline pH and protein this is measured at 540 nm based on Orsonneau et al., [32].
Aspartate aminotransferase, alanine phosphatase and alanine transferase were analyzed using diagnostic kit based on the method of Perry et al. [33].
Data were analyzed using SPSS 22.0 (SPSS Inc., Chicago, USA) at P<0.05 and Excel 2010 (Microsoft Corporation, USA). Data were expressed as mean ± SEM. Means were compared using the students’ T-test and one-way Analysis of Variance (ANOVA) test.
No mortality was recorded during the experiment.
The mean body weight is presented in Table 1. There was decrease in final body weight of the treatment groups (B-F) when compared to Control (Group A), with Group B having the lowest value.
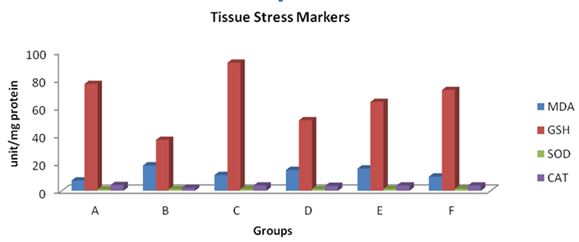
There was an increase in the MDA values when the treatment groups (B-F) were compared to control. However, a decrease in this value was observed when treatment groups C-F were compared to group B. An increase in GSH, SOD and CAT values were recorded when groups C-F were compared to B (Table 2) (Figure 1).
The results obtained did not follow a definite pattern. There was an increase in ALP and ALT values of the treatment groups except for Group C. There was increase in the level of AST value of treatment groups B and F with others posing a decrease in their values when in comparison with Control (Table 3).
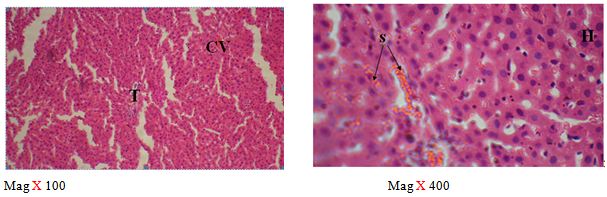
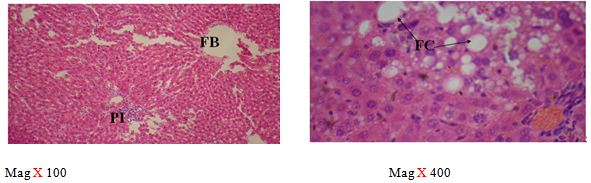
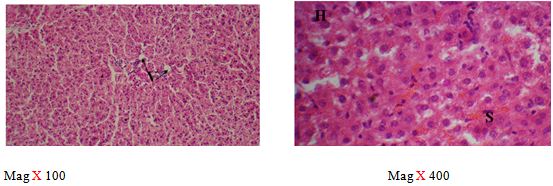
The sections of the controls revealed a well preserved microarchitecture, the central and portal veins were also distinct (plates 1A & 2B) (Figure 2). This is similar to the photomicrographs obtained from the treatment groups C-F (plates 3A-6A & 3B-6B). Treatment group B section showed central vein wall fibrosis, peri-portal inflammation and fatty changes (plates 2A & 2B).
Hepatoprotective potentials of medicinal plants against drug models of hepatotoxicity remain an area that needs extensive scientific research. Hepatic injury is a common pathological feature which exists in many liver diseases. Liver fibrosis, cirrhosis and even liver cancer could result from the long existence of hepatic injury. Therefore, prevention and treatment of hepatic injury is a key to treating liver diseases clinically [34]. In this study we aimed to investigate the hepatoprotective effects of Garcinia kola against Azathioprine-induced oxidative stress and liver injury in rats. Liver injury induced by AZA is the best characterized system of drug-induced hepatotoxicity and is considered a new used model for the study of plant potential hepatoprotective activities [35].
There was decrease in body weight of the treatment groups. The decreased body weight in rats fed Garcinia kola extract was associated with reduced feed consumption in accordance with previous reports on some other plant materials although mass loss without decreased feed intake has been documented [36-38]. Azathioprine is an immunosuppressive agent and the problem of cumulative toxicity is a long-range concern that is not manifested until damage is extensive. These considerations have arisen because of its widespread use and could account for the decrease in body weight of animals that were administered with it singly or in combination with the extract.
GSH represent the first line of antioxidant defense and primary regulator of redox status in hepatocytes and other cells [39]. It is involved in scavenging hydroxyl radical and detoxification of hydroperoxide and lipid peroxides through the action of glutathione peroxidase [40]. In addition, it is capable of regenerating the most important antioxidants, from oxidized form to their active forms [41]. From this study, the level of glutathione was reduced following azathioprine administration. Pre-treatment, post-treatment and co-treatment with Garcinia kola attenuated the significant reduction in the level of non-enzymic antioxidants when compared with the control and the group that were administered with the extract. These findings agree with previous reports [42,43]. Activities of CAT were significantly reduced upon administration of Azathioprine as increase was observed in the pre-treatment, post-treatment and co-treatment with Garcinia kola. There was no significant decrease in changes of the activities of SOD. The enzymatic antioxidant defense systems are the natural protector against lipid peroxidation. SOD and CAT are important scavengers of superoxide ion and hydrogen peroxide. The two enzymes with glutathione peroxidase prevent the generation of hydroxyl radical and protect cellular constituents from oxidative damage [44]. SOD is involved in the rapid dismutation of superoxide anion (O2-.) to hydrogen peroxide (H2O2). The H2O2 generated from this dismutation process is also a powerful membrane penetrating oxidant which has to be rapidly removed from the cell. The elimination of H2O2 in the cell can either be handled by CAT or GPx in a reaction that produces water and molecular oxygen [45]. The reduction in the activities of CAT is an indication of increased lipid peroxidants while the increased activities of CAT in pre-treated, post-treated and co-treated rats with Garcinia kola may result from scavenging of radicals generated by azathioprine. The measurement of lipid peroxidation is a convenient way of measuring oxidative damage [46]. The increased level Malondialdehyde observed in the liver of rats treated with Azathioprine reflected lipid peroxidation as a consequence of oxidative stress and administration with Garcinia kola extract offers protection through amelioration of lipid peroxidation by scavenging free radicals. The antioxidative and chemopreventive properties of Garcinia bioflavonoids agree with the documentation of Adaramoye and Farombi and Owoeye [42,47].
The increase level of alanine tranferase, aspartate transferase and alaninie phosphatase in the treatment group that received Azathioprine alone may be attributed to the liver injury produced by AZA intake to rats as they are sensitive markers employed in the diagnosis of liver damage [48,49]. Increase in the ALP are generally associated with impairment of intrahepatic and extrahepatic bile flow (cholestatis), hepatobiliary injury, erythrocyte destruction [49-51]. ALT and AST are marker enzymes for liver function and integrity [52]. Increases in ALT and AST activities are indicative of hepatocellular injury or regenerative activity. Pre-treatment, Post-treatment and Co-treatment with Garcinia kola significantly reduced the activities of ALT, and AST suggesting that they offer protection against renal and hepatocellular damage – induced by azathioprine. Although there was no significant changes in the activities of ALP between the pre-treated and post-treated rats when compared to Azathioprine induced rats but there was significant reduction in activities of ALP in the Co-treated rats with Garcinia kola. This protection is supportive to previous reports on Kolaviron which is an active antioxidant in Garcinia kola, significantly reduced activities and levels of plasma markers in D-galactosamine hepatotoxicity, CCl4 – induced hepatotoxicity, dimethyl nitrosamine hepatotoxicity and N-(G)-nitro-1-arginine methyl ester – induced hepatotoxicity [53,54].
The histopathological observations in the Azathioprine – treated liver revealed central vein wall fibrosis and peri-portal inflammation possibly as a result of formation of highly reactive radicals generated by the drug. Garcinia kola restored back the induced changes in the architecture of liver cells to normal as seen in the pre-treatment, post-treatment, and co-administration of Azathioprine and the extract, which is also in conformity with the sections of the control and the administration of the extract Garcinia kola. The phytochemical and micronutrient constituents might play a contributory role to the possible mechanisms of this extract, as it has been reported to contain flavonoids, saponins, tannins as remarked in this study. Tannins have been reported to suppress oxidation and both flavonoids and saponins are said to have anti-oxidant property as well. Also, the biological activities of flavonoids has been reported to include action against radicals, hepatoxins etc [17,55]. The cardiac glycosides have been reported by Adesuyi et al., as supplement that can prevent disease. Also, it was reported that G.kola has been used in the treatment of liver diseases [13,17,56,].
From our present study, we can conclude that the administration of Garcinia kola extract may be beneficial in the treatment of Azathioprine – induced hepatic toxicity as the antioxidant properties of Garcinia kola may be responsible for the protective effects.