Thermographic Imaging in Diabetic Patients with Critical Limb Ischemia Undergoing Endovascular Revascularisation
Introduction: The success of endovascular intervention for lower limb arterial occlusive disease is usually based on radiological evidence and physiological testing. However current tools to assess peripheral arterial disease (PAD) have significant limitations particularly in patients with diabetes and critical limb ischaemia (CLI).
Method: Forty patients undergoing endovascular treatment of stenotic or occlusive lower limb arterial disease were recruited and underwent physiological testing (ankle brachial pressure index, toe pressure index, pulsatility index, spectral waveforms) as well as infrared thermography of both lower limbs at pre-intervention (pre) and at two separate time points after intervention (post 1 within 48 hours and post 2 at 6-8 weeks). The pre and post results of both the thermographic images as well as the physiological data were compared.
Results: Thermography could be performed in all subjects, while standard physiological tools could not and were only found useful in a small proportion of patients. In the treated limbs there was a significant increase in temperature readings in the metatarsal aspect of the foot (p-value of 0.0001 between pre and post 1, p-value of 0.056 between pre and post two), heels (p-value 0.009 between pre and post one, p-value of 0.045 at pre and post two) and shins (p-value 0.008 at pre and post one, p-value of 0.006 between pre and post two) after revascularisation, while no change was seen in the untreated limb, indicating thermography usefulness in assessing the success of endovascular intervention. Standard physiological tools were only found useful in 10 out of the 40 treated limbs.
Conclusion: The results of this study indicate that thermography has significant potential in assessing the success of endovascular revascularisation in patients with CLI compared to standard physiological testing.
Keywords: Diabetes; Critical Limb Ischemia (CLI); Thermography; Peripheral Arterial Disease (PAD)
In peripheral arterial disease (PAD) where arterial obstruction is present due to atherosclerotic changes, blood flow to the lower extremities is reduced. The quality of life of patients suffering from PAD will decrease due to complications ranging from reduced mobility, calf pain due to claudication, or critical ischaemia presenting as rest pain, ulcers or gangrene [1].
Calf artery disease is frequent, particularly in diabetics, and proximal revascularisation in the presence of significant calf artery disease, may not be sufficient to allow healing of ulcers or amputated toes. Diabetic foot disease is the leading cause of lower limb amputations and could be reduced by screening of the lower limbs and proper care [2]. Whereas identification of poor perfusion may prevent people at risk, such as diabetics and patients with vascular disease, from complications that may result in loss of function, immobility or loss of limbs [3].
As in many patients with critical ischaemia, atherosclerotic disease is diffuse and widespread [4]. Hence success of endovascular intervention is usually based on radiological evidence of recanalisation of treated segments and improvement in run off or physiological testing such as arterial brachial pressure index (ABPI), spectral waveforms or toe pressure index (TPI) [5].
Most patients with arterial disease will often be offered endovascular treatment as it is less invasive than open surgery [6-8]. However, the current tools in our possession to assess the success of the treatment are the radiological images, which are taken during endovascular treatment and physiological testing which all have significant limitations [9-11]. Temperature changes in the lower limb can be indicative of diabetic complications such as ulceration whereas in vascular disease temperature decrease may indicate the presence of arterial occlusive disease [12]. Temperature measurement is used routinely in medicine to detect disease and could provide useful information about blood perfusion. Over the last few decades advances in technology in the field of thermography have led to increasing research relating to the application of thermography in medicine [13]. Multiple studies have investigated the potential use of thermography in assessing peripheral perfusion and tissue viability [14].
Thermography may be used as part of a diagnostic by identifying infra-red radiation emitted from a body region of interest, typically the skin [15,16]. The availability of a reliable and valid tool for assessment of success of endovascular intervention is likely to increase the patient’s chances of limb salvage and survival by enabling appropriate clinical decisions. Post procedure, it is vital to know the limb vascular status to assess whether further interventions are required to ensure optimal revascularisation to allow healing of ulcers or minor amputation sites. Furthermore, as restenosis or reocclusion after endovascular treatment and after bypass graft surgery is common such a tool would enable closer monitoring to the vascular status and this would contribute towards optimal clinical decision making. Patients requiring these interventions require monitoring to ensure that their vascular status does not deteriorate and a tool that could accurately determine the state of perfusion to the areas of interest, most often the toes or the foot, would ensure that patients who merit intervention are treated in a timely fashion while those who do not require intervention are not subjected to unnecessary risks of intervention.
The study aimed to investigate the feasibility of using infrared thermography to assess the result of reperfusion of the foot after endovascular revascularisation in CLI patients and to correlate findings of thermography with results of physiological testing such as ABPIs, TPIs, pulsatility index (PI) and spectral waveforms before and after endovascular intervention.
This observational study assessed the feasibility of using thermography in establishing the degree of success of endovascular reperfusion in diabetic patients with peripheral arterial disease (PAD). Thermography was compared to the standard physiological tools for assessment of peripheral perfusion where tools used included; ABPI, TPI, Doppler waveform, PI. Assessment of perfusion was performed at baseline (within 24 hours before intervention) and at two time points after endovascular intervention; (point 1 within 48 hours after intervention; point 2 at 6-8 weeks after intervention). Thermography was applied at each session and results were compared. The cohort included a convenient sample of 40 participants undergoing endovascular treatment for lower limb ischaemia. Procedures performed included angioplasty of the common iliac, external iliac, superficial femoral, popliteal, posterior tibial and peroneal artery as well as angioplasty of bypass grafts. The assessment of success of treatment was based on radiological imaging before and after intervention and the report issued by the interventional radiologist, also the quality of runoff was assessed at angiography. Physiological results of intervention were based on physiological testing and improvement in ABPI, TPI or Doppler waveforms and PI after intervention compared to baseline. Subjects, who experienced restoration of blood flow to the posterior tibial and/or dorsal pedis with improved ABPI/TPI, were classified as completely successful. Subjects with technically successful angioplasty but with no significant improvement in ABPI/TPI at the first postop assessment were classified as successful. Subjects with unsuccessful angioplasty and no improvement in ABPI/TBPI at 48 hours were considered unsuccessful. Success/partial success or failure of procedure was based on angiographic results and not physiological tools. Once the lesions were successfully crossed and post angioplasty angiographic images showed a patent artery the procedure was considered a successful angioplasty.
The thermal imaging acquisition procedure was carried out in controlled ambient conditions. Specifically, the room temperature was maintained at a constant temperature of 22 ºC using an air-conditioning system. The room temperature was monitored using a Testo 175H1 data logger. The room humidity level was also observed to be less than 50%.
The thermal camera was always kept at a fixed distance of one meter from the target patient during the image acquisition process.
All tests were performed with the patient in a supine position, allowing for a 10-minute rest period after the patient entered the data collection room. All the physiological tests were performed using a Huntleigh® Dopplex Assist Vascular Package (Cardiff, UK). This diagnostic portable Doppler equipment recorded the pedal waveforms, toe/brachial/ankle pressure, as well as PI. The ABPI and TPI were calculated according to the American Heart Association and the American Diabetes Association (ACCF/AHA) guidelines. Thermography images were obtained using a FLIR® E-series, specifically the E6 hand held camera, with the emissivity value was set to that of human skin at 0.98.
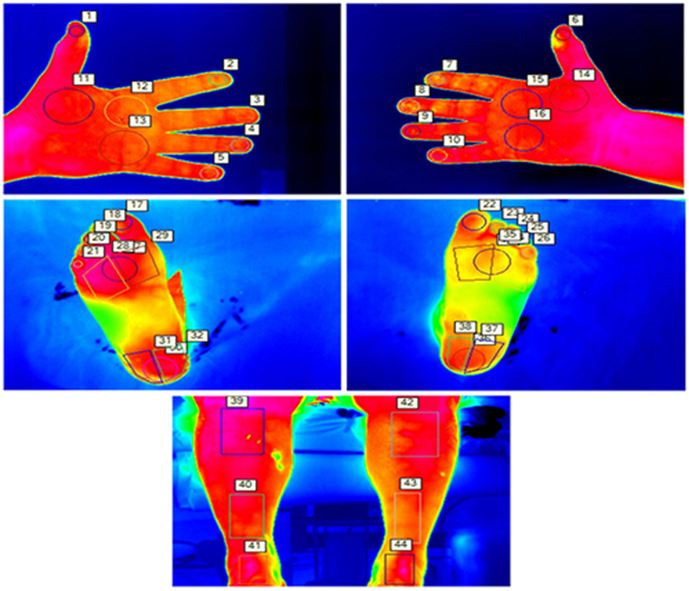
Images were acquired and saved on the camera then downloaded and processed using dedicated software, FLIR Tools Plus, produced by the same manufacturing company. Temperatures were extracted from specific sites on the metatarsal aspect of the foot, shins and palmar aspect of hand using the palms of the hands for comparison. The temperatures recorded from the affected lower limb were compared to the contralateral lower limb and hands. The selected points of interest, hence shins, metatarsal area, heels and toes, were pre-determined based on an automatic segmentation technique [17]. Which showed these areas of interest to be reliable and also repeatable for thermographic temperature readings [18]. A contrast back drop was used behind the limb to avoid processing errors and to obtain the best image.
The thermography images were analyzed using the FLIR Tools plus Software allowing recorded data to be reported by thermal imaging inspection and temperature plots being analyzed with detail. A total of forty-four regions of interest were selected from both limbs, comprising six locations on the shins (three each), twenty-two locations on the metatarsal aspect of the feet (all ten toes, three areas over the metatarsal head region on each foot, and three areas on each heel), and sixteen areas on the palmar surface on the hands (eight areas each hand) (Figure 1).
For statistical analysis of data IBM SPSS Statistics 24 was used, expressing continuous variables as means ± standard deviations (when parametric) and median and IQR (when non-parametric). Comparisons were conducted using a t-test for parametric data and a Wilcoxon signed-rank test was used for non-parametric data. A Chi-square test was used to analyze categorical data and the Pearson’s t-test was used to compare the temperature changes. The t-test was applied to test statistics that followed a normal distribution under a null hypothesis and to compare the differences between the patient’s individual physiological tests at different time points. All means were expressed with the respective standard deviations, with a p-value of less than 0.05, considered statistically significant.
A box and whisker plot were used to display the distribution of data based on a five number summary: minimum, first quartile, median, third quartile, and maximum; where the central rectangle displays a segment showing the median and “whiskers” above and below the box shows the locations of the minimum and maximum.
The participants in the study underwent various endovascular interventions depending on the site and extent of the disease. The most common site treated was the superficial femoral (n=21), followed by posterior tibial (n=6), peroneal (n=4), popliteal (n=12), common iliac artery (n=1), external iliac artery (n=1) and bypass grafts (n=2). Out of forty procedures, only one was unsuccessful. Temperature readings of limbs at baseline (pre), 48 hours after the intervention (post one) and six to eight weeks after (post two) revascularisation procedure; results of the various physiological tests performed at baseline (pre), 48 hours after (post one) and six to eight weeks after (post two), the revascularisation procedure performed, radiological success of revascularisation procedures, and correlations between physiological tests and lower limb temperatures before and after revascularisation are discussed below. The demographic data collected from participants is presented in Table 1.
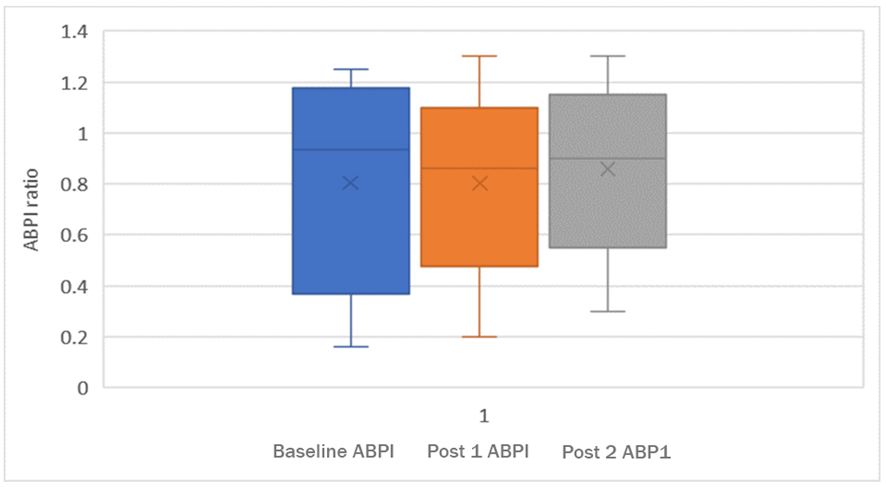
At baseline ABPIs could not be recorded in twenty-two subjects (55%) due to an absent signal over the respective ankle vessel or due to incompressible calf arteries. At post one, in half the subjects, ABPI could not be recorded due to undetectable signals or incompressible arteries, whereas at post two, in eighteen subjects (45%) ABPI could not be recorded or ABPIs were artefactually elevated.
There was no significant difference in ABPI between baseline and post one (p=0.67), between baseline and post two (p=0.84) and nor between post one and post two (p=0.87). When these figures were compared without the artefactual ABPIs included, the same results were seen, baseline and post one (p=0.26), between baseline and post two (p=0.37) and nor between post one and post two (p=0.90) indicated below in Figure 2.
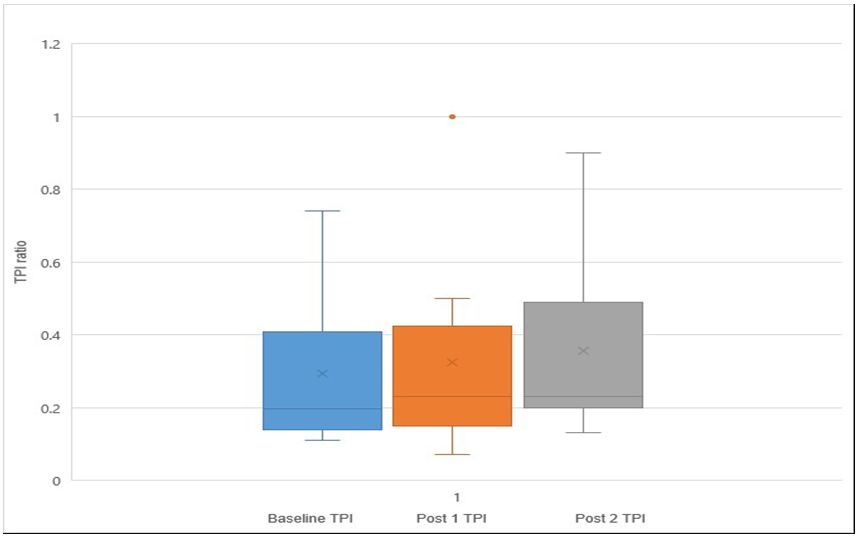
At baseline TPIs could be measured in only eighteen subjects (45%), whilst in the remaining twenty-two subjects, there was either no detectable signal in the first or second toe, or it was not possible to assess the signal due to gangrenous, ulcerated or missing toes, or else the digital arteries were incompressible. The mean TPI at baseline was found to be 0.34. At post one, in sixteen subjects (40%) TPI could not be measured for the reasons outlined above. The mean at post one was found to be 0.35. At post two, in sixteen subjects (40%) TPI could not be measured. The mean TPI at post two was found to be 0.41 and there was no significant difference in TPI between baseline and post one (p=0.102), however there was a significant difference between baseline TPI and post two (p=0.05) (Figure 3).
Spectral waveforms: Spectral waveforms were detected in nearly all subjects excluding two readings in the pre-phase and three in the post one and post two. Waveforms were non-discriminatory, they were either found to be monophasic discontinuous or monophasic continuous, when assessing both the dorsal pedis (DP) and posterior tibial (PT) artery. Biphasic and triphasic waveforms were not seen in these subjects at any time point. There was a significant difference between the waveforms in phases pre and post one in the DP artery (p=0.001), however no significant difference was noted between the pre and the final phase post two (p=0.553). When comparing the PT artery, no significant differences were identified between pre and post one (p=0.15), or between the pre and post two (p=0.72).
The waveforms in this cohort were largely unable to identify any changes in perfusion. From a cohort of forty subjects only seven subjects (17.5%) showed changes in their DP waveform from monophasic continuous to monophasic discontinuous despite having a successful revascularisation procedure in the vast majority. In the PT artery, only three subjects (7.5%) showed changes in their waveform despite successful angioplasty.
Pulsatility index (PI) could be measured in nearly all subjects excluding two readings in the pre-phase and three in the post one and post two, where the mean at baseline was found to be 3.54 and at post one the mean was found to be 2.99.
The mean at post two was found to be 3.49 and there was no significant difference in PI between baseline and post one (p=0.162), or between baseline and post two (p=0.454).
There was no significant difference in the temperature of the fingers between baseline, post one and post two phase on the right (p=0.044) or on the left (p=0.42).
There was a significant increase in the mean temperature between pre and post one at the shins (p=0.008) and also pre and post two (p=0.045). When comparing the affected limb to the non-affected limb there is a significant difference in absolute temperatures between the treated and untreated shins at post one (p=0.001).
Shin temperature, in the affected limb, increased by a mean of 0.8 degrees Celsius between baseline and post one, and a mean increase of 0.7 degrees Celsius between baseline and post two. In the non-affected shin there was no significant change in temperature from baseline to post one or post two.
When comparing the three points in the heels in the affected limb there was a significant increase in mean temperatures between pre and post one (p=0.009) and pre and post two (p=0.006). In the non-affected limb, the heels showed no significant difference in temperature between pre and post one (p=0.602) and pre and post two (p=0.803).
When comparing the three points in the metatarsal area of the foot there was a significant increase in temperature between pre and post one (p<0.0001), while the increase in temperature noted in the metatarsal area between baseline (pre) and post two just falls short of statistical significance (p-value 0.056). In the non-affected limb there was no significant difference between pre and post one (p=0.516), or between pre and post two (p= 0.499).
When comparing the affected toes to the non-affected toes there is a significant difference in absolute temperatures (p=0.020) at post one which was not present at baseline pre-level (p=0.908). This difference had disappeared at the six to eight-week point (post two) (p=0.140).
The ankle brachial pressure index (ABPI) compares the pressure at the ankle with the pressure in the arm thus using the arm pressure as the denominator in the ratio. A similar ratio was calculated for thermography by dividing the minimum temperature recorded in the toes or the metatarsal aspect of the foot, or the heel by the maximum temperatures recorded in the hands. When comparing the minimum of the toe/metatarsal/heel to the maximum hand temperature there is a significant increase in the ratios of toe/hand, metatarsal/hand and heel/hand temperatures between baseline and post one (p=0.018), however no significant difference between baseline and post two (p=0.957) (Table 2).
Lower limb arterial disease can be detected using various physiological tools, the standard includes ABPI, TPI, PI and spectral waveforms. These tests are frequently used and have gained popularity as they are cheap and portable tests [19]. Despite their common use there are significant limitations with use of these tools, particularly in patients with heavily calcified disease as in diabetes, extreme age and end stage renal failure. Failure to identify and treat PAD can lead to the limb-threatening condition of CLI, where the limb and patient might be lost [6]. Various studies have indicated that the standard physiological tools currently used, are not reliable and may yield false results, resulting in failure to diagnose a condition or its severity [20].
The results of this study indicate that using the current standard physiological tools, namely ABPI, PI, TPI and spectral waveforms is often not feasible or unreliable. In fact, ABPI at baseline was only detectable in over half (55%) of the subjects or else yielded artefactually elevated results. This could be due to arterial calcification in patients with diabetes or long-term renal replacement therapy. Moreover, at post one even less (50%) subjects had a reliable recorded ABPI and at post two an even lower proportion (45%) of subjects had a recordable and reliable ABPI due to undetectable ankle signals or incompressible arteries common in advanced PAD.
With TPI at baseline, less than half (45%) of the subjects reading could be detected and at post one detection decreased (40%) and remained at this level at post two. Hence standard physiological tests mostly failed to detect any improvement in perfusion to the foot despite radiological confirmation of success through revascularisation.
Doppler waveforms were detected in nearly all subjects however proved to be mostly non-discriminatory as most patients had the same types of waveforms before and after intervention. Moreover, the PI was detected in all subjects except those with an absent waveform, but this test also failed to demonstrate any improvement after radiologically confirmed successful revascularisation.
The findings of this study suggest that the physiological tools available are poor at detecting improvement in perfusion after endovascular revascularisation. Thermography was applied to hands, shins, and feet, both on the affected and non-affected side to assess whether the use of thermal imaging could be useful in this context. The application of thermography to the hands was intended to allow comparison with a denominator as is the case with the ABPI where the pressure at the ankle is compared to the pressure in the arm, the latter serving as the denominator and control. The affected limb was compared both to the untreated contralateral limb as well as to the hands. The heat patterns in the feet and the hands were also compared. One of the main advantages of thermography is that the technology allows for all limbs to be assessed in contrast to standard physiological testing. A further advantage is that the testing does not involve any direct contact with the patient’s skin and is completely acceptable to patients. The lack of contact with the patient has significant advantages particularly in relation to infection control. The technique can also be repeated several times without causing patients any distress or exposing them to any risk. The results indicate that thermography could detect improvement in perfusion as manifested by increased relative skin temperatures after endovascular intervention. Assessing temperature over the metatarsal area of the foot and in the heels as well as in the shins was shown to be most effective at detecting changes after intervention. Temperature in the toes was shown to be less useful in detecting changes in perfusion, most likely due to the exposed position and the effect of ambient temperatures on the toes. The fact that significant temperature differences were detected in the treated limb but not in the contralateral limbs indicate that the changes detected were most likely directly related to the intervention performed.
In the unsuccessful angioplasty intervention, no significant change in shin, heel, metatarsal or toes were reported as temperature at all sites in the limb remained stable.
The limitations of this study include the small size of the cohort of patients where the results indicate that the use of infrared thermography has potential for clinical application in this area. However, larger studies involving larger numbers of participants will need to be conducted to replicate these findings.
The findings of this study confirm the significant limitations of using currently available physiological tests to assess perfusion to the lower limbs, particularly after endovascular revascularisation. Infrared thermography was shown to be effective at identifying changes in the skin temperature in the limb undergoing endovascular revascularisation. Further larger studies are required to confirm these findings, but initial results suggest that further research into the application of infrared thermography in this field is warranted.