Urinary Sodium/Potassium Ratio and the Effect of Diet Salt to Blood Pressure
Sodium and potassium play important role in regulating acid-base balance in human. Dietary interventions, particularly those based on sodium or potassium intakes, have proven their ability to reduce BP in human. This research was aimed to study the urinary sodium/potassium ration of Indonesian students and the effect of diet salt to blood pressure. Volunteers were 99 students (41 male and 58 female) of the Faculty of Pharmacy, Universitas Padjadjaran, Indonesia, aged 18-26 years, BMI 18–25, originally Sumatranese (10), Sundanese (42), Javanese (19), Betawi (4), Balinese (2), Floresian (1), Indonesian-Chinese (10), Indian (3), Malay (7), Arabian-Javanese (1). Morning-urine samples were collected and were biochemically-tested using urinalysis test strip. Determination of urinary sodium and potassium was conducted by using flame emission spectroscopy. Average urinary potassium of the students was 117.83 ppm (male) and 89.1 ppm (female). Indian male students showed higher urinary potassium which was 210.9 ppm. Urinary sodium was 278.12 ppm (male) and 245.81 ppm (female), whereas that of smoking and alcohol-drinking male students was 284.20 ppm and 185.35 ppm, respectively. Furthermore, eight students with BP > 130/85 mmHg (aged 18-24 years) were treated with diet salt (a mixture of NaCl and KCl in ratio 1:1) for a week and their BP were observed; whereas a parallel study of potassium content in 6 categories of food, recommended by WHO, was conducted to 57 samples purchased from 3 traditional markets in Bandung. High levels of potassium were obtained in each group, respectively: potato 366.21 mg/100g (I), anchovies 500.87 mg/100 g (II), green beans 1381.31 mg/100g (III), cassava leaves 636.33 mg/100g (IV), bananas 706.70 mg/100g (V), milk 657.01 mg/100g (VI). Urinary sodium/potassium ratio of Indonesian male students aged 18-26 years was 2.36; whereas that of female was 2.76. However, an intervention of diet salt could lower the BP of the students.
Keywords: Diastole; Diet Salt; Hypertension; Potassium-Rich Food; Systole
Raised blood pressure (BP) is responsible for 62% of strokes and 49% of coronary heart disease (CHD). High BP and high blood cholesterol are closely related to excessive consumption of fatty, sugary and salty foods [1].
Many evidences have proven that high sodium intake could increase BP and shows impact in cardiovascular disease (CVD). A high salt diet may have direct harmful effects independent of its effect on BP, for example, increasing the risk of stroke and renal disease. A reduction in salt to the recommended level of 5–6 g/day will contribute to beneficial effects on health [2]. However, the work of Ljungman and colleagues indicated that salt intake influenced BP in normotensive population but did not support to the hypothesis that habitual salt intake might affect the BP in mild-to-moderate essential hypertension [3]. An interest in potassium intake has increased, mainly due to its capability to attenuate sodium’s negative effects, by reducing stroke rates and CVD risk [4]. A study on 200 Portuguese adolescents showed that the mean urinary Na+/K+ ratio was 1.7 in boys and 1.6 in girls which are higher than the recommendation of WHO (Na+/K+ ratio < 0.59). This result was concluded due to their dietary habits on processed foods and few vegetables (high sodium and low potassium intakes) [5]. In adults, increased potassium intake could reduce systolic and diastolic BP. The largest reduction in BP had been detected when the potassium intake was 90–120 mmol/day. Moreover, higher potassium intake had no significant adverse effect on blood lipids, catecholamine levels or renal function in adults [6]. Moreover, an analysis of potassium measured by identifying the 1460 keV photons produced in the decay of the isotope 40K, reported that this mineral was highly contained in dark chocolate with 90% of cacao and in white beans [7].
Earlier works that investigated the ratio of urinary sodium/potassium to BP indicated that there was a significant and positive correlation whereas a more recent work of Kieneker and colleagues showed that there was no association between sodium/potassium excretion ratio and risk factors of hypertension [3,8,9]. No correlation of BP with serum sodium was also reported [8].
Low potassium urinary excretion correlated with an increased risk of developing hypertension and an increase of potassium intake to 90 mmol/day might reduce the incidence of hypertension [9]. Risk factors for hypertension include genetic and environmental factors, such as family history, age, unhealthy diet, overweight, reduced physical activity, and excess alcohol intake [10].
In this work, we studied (1) urinary sodium/potassium ratio of Indonesian students and, furthermore, (2) the effect of diet salt intervention to students with BP > 130/85 mmHg; (3) potassium-rich source in Indonesian food.
Data for this study was taken from students of the Faculty of Pharmacy, Universitas Padjadjaran, Indonesia, aged 18 - 26 years during year 2012 to 2015. This study was approved by the Ethical Committee of Universities Padjadjaran. Written informed consents were obtained from all participants.
The students (n=120) were invited to participate in this study and collected their morning urine. The participants were screened for their eligibility by filling health-questionaire form. Of those, 99 voluntary students (82.5%) were included, whereas the rest (mostly female) were excluded due to menstrual period and/or medication-taken reasons, respectively.
Weight and height measurements were performed to participants, who previously were suggested to wear light clothing and to take off their shoes.
Overnight urine (morning-collected urine) was used in this study because it reflects a period without any liquid intake. This urine accumulates in the bladder during the night which produces very concentrated urine.
The participants were given direct instructions on the morning urine collecting procedure. They were instructed to discard the first few drops and to collect the rest of their morning urine. The samples were stored in sealed tubes for further examination.
Urine samples were analysed for leucocyte, nitrite, urobilinogen, protein, pH, density, keton, bilirubin, and glucose content. A strip of medical diagnostic dipstick Uric 10 CF Urine Test Strips (YENACO®) was dipped into a test tube containing morning urine of each participant for several seconds and the result was recorded.
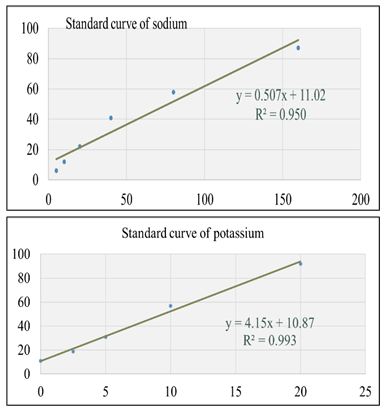
Determination of urinary sodium and potassium was initiated by preparing the standard curves using sodium chloride (0.406 g) and potassium chloride (0.305 g) analytical grade standards (Merck), dissolved in 1000 ml of demineralized water. The solutions in various concentrations (160 ppm, 80 ppm, 40 ppm, 20 ppm, 10 ppm) were aspirated into the flame of Corning 400® flame photometer, and the emissions were recorded and plotted against the concentrations. The curves were calculated for linear regression equations (y = 0.507x + 11.02; R2 = 0.950 for sodium and y = 4.15x + 10.87; R2 = 0.981 for potassium) , and were used to calculate the concentration of sodium and potassium in the samples. Urine samples were diluted 10x and were aspirated into the flame of Corning 400® flame photometer, and the emissions were recorded. Urinary sodium and potassium concentrations were calculated using the standard curve (Figure 1).
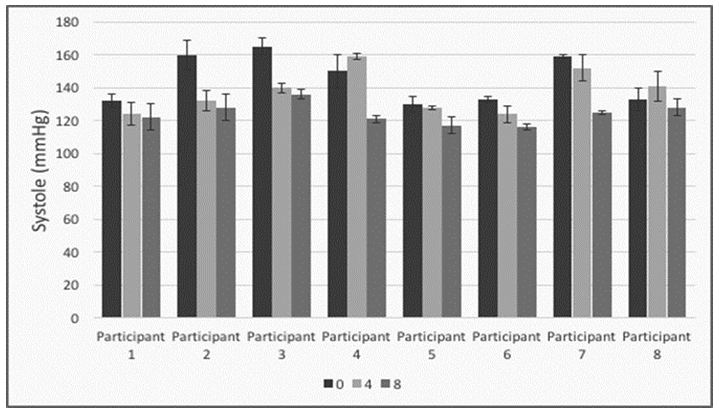
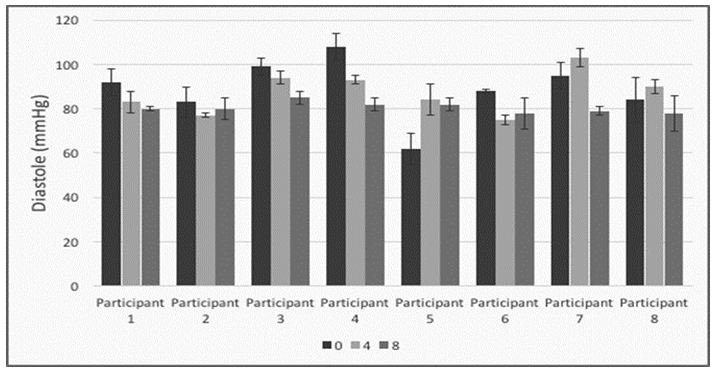
Of the 99 participants, eight students with BP > 130/85 mmHg (aged 18-24 years), were selected and treated with 5 g of diet salt (a mixture of NaCl and KCl in ratio 1:1) inserted in their daily food for a week, each meal contained 1.67 g of the diet salt. Their BP was measured using a sphygmomanometer. The participants were asked to sit for 10 minutes, their BP was measured 3 times within 2 minutes interval, and the average was calculated and recorded. The BP measurements were taken at 10 am day-0, day-4, and day-8.
57 samples representing 6 categories of food recommended by WHO (I: carbohydrate; II: protein; III: vegetable protein; IV: vegetable; V: fruit; VI: milk) were purchased from 3 traditional markets (Pasar Sederhana, Pasar Dago, and Pasar Gede Bage) in Bandung, West Java, Indonesia. The foods were crushed, weighed, wrapped, and sealed, prior to be further processed.
0.5 g of each food sample was put into a flask and was mixed with 2 ml of destruction solvent (2 part of HNO3 + 1 part of HClO4). The mixture was heated at 190 °C for 30 minutes until a clear solution was obtained. The solution was neutralized and diluted
Determination of sodium and potassium in food was performed by similar procedure as urine samples by using different standard curves.
Table 1 shows the baseline data of the participants, who were mostly Sundanese (42.42%) and healthy as indicated by the value of biochemical parameters.
Most participants aged 19 years (female 70.83%; male 24.39%). Coffee drinker and exercise participants was more likely female than male, whereas smoker and alcohol drinker (one to two goblets per week, not routinely) were less likely female than male.
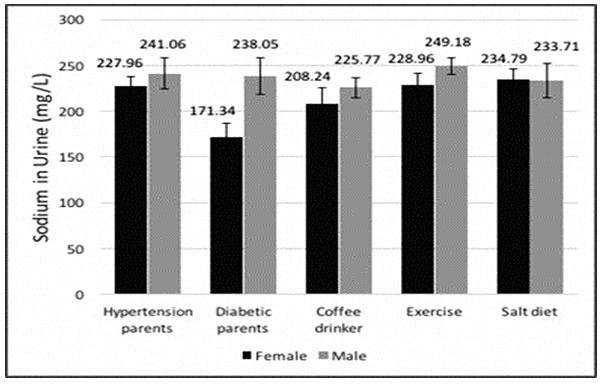
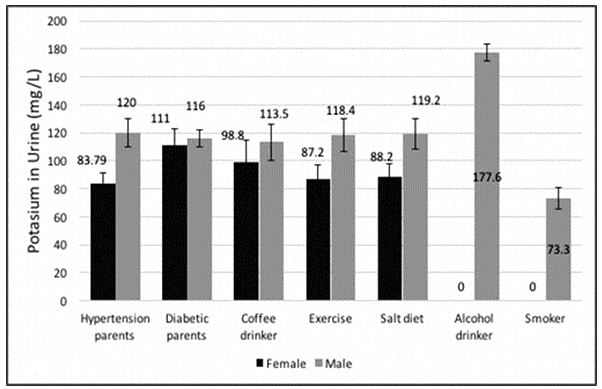
Urinary sodium was 278.12 ppm (male) and 245.81 ppm (female), whereas that of smoker and alcohol-drinker male students was 284.20 ppm and 185.35 ppm, respectively (Figure 2). Urinary potassium of the students was 117.83 ppm (male) and 89.1 ppm (female). Indian male students showed higher urinary potassium which was 210.9 ppm.
Urinary sodium/potassium ratio of Indonesian male students aged 18-26 years was 2.36; whereas that of female was slightly higher, 2.76. This result was compared to the PREVEND cohort study of Kieneker and colleagues in the Netherlands during year 2001 to 2008. They discovered that the median sodium/potassium excretion ratio at baseline was 2.0 for men and slightly lower in women, 1.9 [9]. Systolic blood pressure was related to calcium intake (r=-0.40), urinary sodium/creatinine ratio (r=0.39), urinary sodium/potassium ratio (r=0.30), and age (r=0.23), whereas diastolic blood pressure was related to urinary sodium/creatinine (r=0.29) [11].
The correlation analysis of hypertension risk factors and urinary sodium/potassium was provided in Table 2.
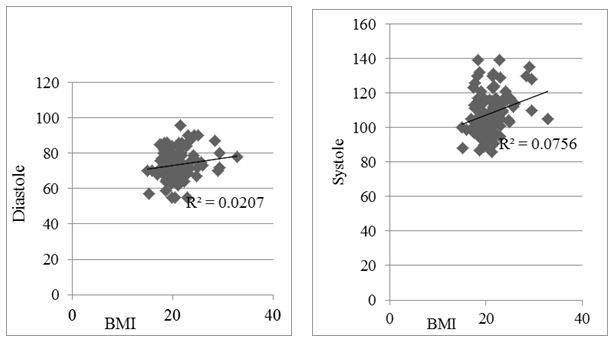
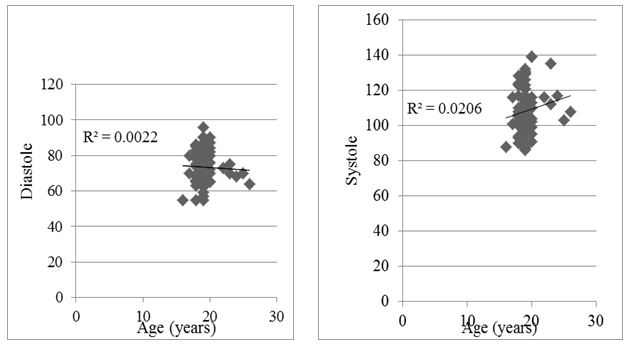
No correlation was observed between hypertension risk factors and urinary sodium or potassium as proven by p-value > 0.05 (Table 2). Surprisingly, there were strong correlations between BMI and exercise with systole, whereas weak correlations were observed between those with diastole, although the correlations were not all positive (Table 2). All scattered diagrams (Figure 3 and Figure 4) show no correlation between systole/diastole with hypertension risk factors. Most of the data were outliers. Compared to the work of Kieneker and colleagues, they concluded that there was no association between sodium/potassium excretion ratio and risk factors of hypertension [9].
Figure 5 and Figure 6 indicated that intervention of diet salt for a week could lower the systole and diastole of the students with hypertension risk factors at day-8, however, an increase of systole and diastole was observed at day-4 of two and three subjects, respectively.
Data on approximately 3,300 subjects from the Dallas Heart Study, about half of whom were African American, showed that the amount of potassium in urine samples was strongly related to BP, however the relationship between low potassium and high BP remained significant even when age, race, and other cardiovascular risk factors, including high cholesterol, diabetes, and smoking, were taken into accounts [12].
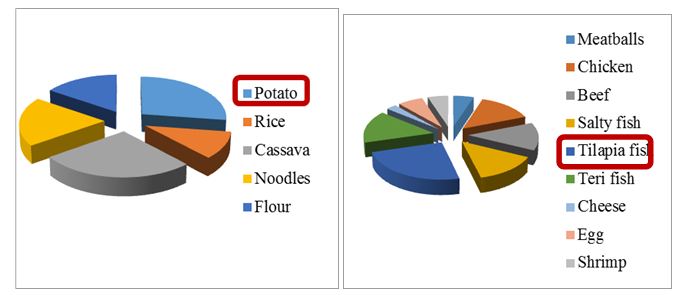
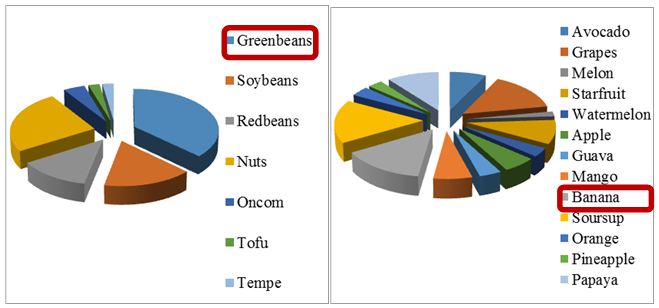
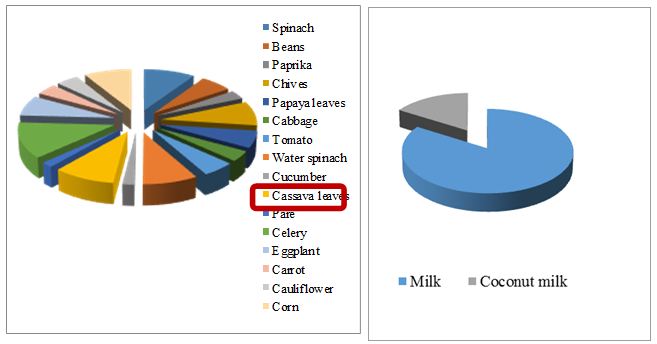
A further assay of potassium content in 6 categories of food, recommended by WHO, was conducted to 57 samples purchased from 3 traditional markets in Bandung. The results were provided in Figure 7.
High levels of potassium were obtained in each group, respectively: potato 366.21 mg/100 g (I), Tilapia fish 500.87 mg/100 g (II), green beans 1381.31 mg/100g (III), cassava leaves 636.33 mg/100 g (IV), bananas 706.70 mg/100 g (V), milk 657.01 mg/100 g (VI). The highest potassium level was found in Indonesian green beans (Phaseolus vulgaris).
We compared our result with that of other works. Potassium was reported contained in five cultivars of cassava leaves that ranged between 1310 to 1630 mg/100 g [13]. An analysis of potassium in several vegetables, fresh products, frozen and preserved, resulted that raw green beans contained 210.9 + 24.9 mg/100 g of potassium whereas in milk products were 1800 to 10000 g/100 g [14,15]. Potassium content in cabbage, carrots, Cos lettuce, and Valencia orange were 253.2 ± 2.3 mg/100 g, 320.7 ± 4.2 mg/100 g, 278.3 ± 2.7 mg/100 g, and 192.0 ± 1.4 mg/100 g, respectively [16]. Potassium was also found in apricot (125.1 mg/100 g) [17].
Urinary sodium/potassium ratio of Indonesian male students aged 18-26 years was 2.36; whereas that of female was 2.76. There were strong correlations either between BMI and exercise with systole, and weak correlations between those with the students’ diastole. However, an intervention of diet salt for a week could lower the BP of the students at day-8. As for food, the highest potassium level was found in green beans (Phaseolus vulgaris).
The authors certify that they have no conflicts of interest with any financial organization regarding the material discussed in this manuscript