A Strategy to Improve the Quality of Records in the Electronic Nursing Patient File: A Prospective Study Before and After Intervention
Background: The DI-RHM (Données Infirmières Résumé Hospitalier Minimum) is a recording tool for 91 nursing interventions (91 items). With the implementation of this electronic nursing patient file, items are automatically recorded depending on the quality of records and the validation of the scheduled care. When comparing the mean items recorded per care episode before and after computerization, we noted a significant decrease.
Objective: This article aims to improve the quality of the electronic nursing patient file records by promoting the nurses’ engagement with the tool in a total of nine medical-surgical wards.
Design and Settings: This prospective “before-after” intervention project was divided into six periods (P) from September 2016 (baseline=P0) to December 2017 (P5). This study was conducted in nine medical-surgical wards (263 beds) located on two sites of a tertiary hospital in Brussels.
Methods: Data for four indicators was evaluated: one result indicator and three process indicators. Volunteer assigned nurses from the wards were trained to check the records in the nursing patient files and to give feedback on performance indicators to their colleagues.
Results: Mean number of items recorded per episode of care increased significantly per period from 10.90 (P0) to 13.26 during P5 (p < 0.001). The proportion of checked care episodes was significantly greater than 50% from P1. The percentage of feedback comments increased to reach 100% during P5. Proportion of complete care validation was low before P2, then began to increase to reach the goal (> 90%) in P3 and P4 but decreased slightly during P5 (88%). The mean scored items increased significantly with checked care episodes and with fully-staffed nursing teams.
Conclusion: The analyses of the indicators showed a statistically significant improvement in the quality of the electronic patient file records when management was by trained assigned nurses in each team. This project has improved the nurses’ engagement and willingness to learn and improve their use of the tool. Finally, it was observed that more and more nurses developed expertise in electronic patient file management.
Keywords: DI-RHM; Nursing; Quality Electronic Patient File
The DI-RHM (Données Infirmières Résumé Hospitalier Minimum) is recorded four times per year over a fifteen-day period: from the 1st to the 15th of the months of March, June, September and December. It is a recording tool for 91 nursing interventions or activities (91 items, Table 1).
Those items are sent twice a year to the Ministry of Public Health, using anonymizing software. The purpose is to provide a picture of nursing interventions performed by healthcare providers and to collect quantifiable information for additional funding of nursing care [1-3]. We use this data to analyze potential changes in the quality of the nurses’ records after implementation of the electronic nursing patient file and to highlight indicators and actions for improvement [1-4]. Implementation of the electronic health record system is increasing across hospitals in Belgium due to government financial incentives [5]. This uptake may result in positive or negative effects [6-13]. Our actual electronic patient file is an in house patient file built by expert nurses and the Intelligent Technology (IT) department in line with the nursing language systems and the nursing process including the North American Nursing Diagnoses Association (NANDA) nursing diagnosis, the Nursing Interventions Classification (NIC) and the Nursing Outcomes Classification (NOC) [12].
The deployment was planned by an expert team, including the expert nurses, the Intelligent Technology team and the referent nurses from each team (super users) [9]. Training was first theoretical (2012 and 2013), then practical (September to October 2013). The training continued three days a week until December 2013 and was then followed by support to users. Monthly training was organized for newly hired nurses, including temporary nurses and a quarterly meeting with the referent nurses was also carried out [6,8]. The newly hired nurses were coached for three weeks by a colleague before electronic patient file training. With implementation of our electronic nursing patient file (October 2013), the DI-RHM items are automatically extracted from the records and the validations of the scheduled care. The DI-RHM results depend on the quality of records and the validation of the scheduled care. When comparing the mean items recorded per care episode before and after computerization, we noted a decrease from 9.80 (March, June and September 2013) to 6.39 in December 2013 [12-14].
From 2015, it was decided to analyze the reasons for this decrease by auditing the quality of the patient file records. The purpose was to highlight and analyze the missing items to build the process indicators as explained below [7,15]. We noted missing data and incomplete validation of scheduled care. The main reasons expressed by the nurses for these cases were a lack of time and a conscious choice to spend more time with their patients. Another reason was difficulty encountered by users in using the computer tool [4,8,12,13,16].
It was decided to continue the audits and feedback sessions, which are still performed each month before and during the DI-RHM registration period. However, this continued support for the teams was not enough to improve the quality of the records. It was suggested that assigned trained nurses could check the patient files and provide feedback to colleagues. Many studies suggest that a sufficient nurse staffing ratio allows the nurses to spend more time with their patients and improve the quality of care [16-18].
In 2016, a sample of 54 Belgian hospitals shows an average of 7 patients per nurse per day with 53% having a bachelor’s degree or higher qualification in nursing. The same year in our hospital, the average ratio was 9 patients per nurse per day and 66% of nurses holding a bachelor’s degree or higher qualification [14]. Full staffing of teams can help to improve the quality of the electronic nursing patient file records.
To our knowledge, there are few published prospective studies evaluating the quality of the electronic nursing patient file records [7,10,13].
Purpose: We aimed to improve the quality of the electronic nursing patient file records by promoting the nurses’ engagement with the tool in a total of nine medical–surgical wards.
This prospective “before-after” intervention study was conducted in nine adult medical and surgical wards located on 2 different sites of a tertiary hospital in Brussels, Belgium. Three wards (76 beds) are located in the Paul Brien site in Schaerbeek, Brussels and six (187 beds) in the Victor Horta site in Laeken, Brussels.
The study was performed over 6 periods (P) from the first to the fifteenth day of September 2016 (P0=Baseline), December 2016 (P1), March 2017 (P2), June 2017 (P3), September 2017 (P4) and December 2017 (P5). From to P1 to P5, the volunteer nurses checked the quality of the records. The assigned nurses were required to have electronic patient file skills and a willingness to participate in the project. It could be the head nurse, the referent nurse or a ward nurse with the desired skills and motivation. Their mission was to check the records and give oral or written, positive or corrective feedback to their colleagues. The work of organizing the fully-staffed teams was left to the head nurses, for optimal management of replacements.
During the periods, the expert nurses (electronic nursing patient file quality team) continued, as they had been doing since 2015, to support the teams, to check patient files and to check that care records were adequately validated. In November 2016, two one-hour meetings were organized. During the first meeting, the study was presented, the nurses were reminded of good practices for recording the electronic nursing patient file and the DI-RHM results were compared with the National mean (3M, 2016).
The second meeting focused on practical work related to the indicators and the data to be completed each day (number of checked episodes and amount of feedback). During each period, results for one result indicator and three process indicators were evaluated. After the periods, a 30 minute meeting took place in which each team received the results for the indicators together with indications for improvement from the expert nurse (Table 2).
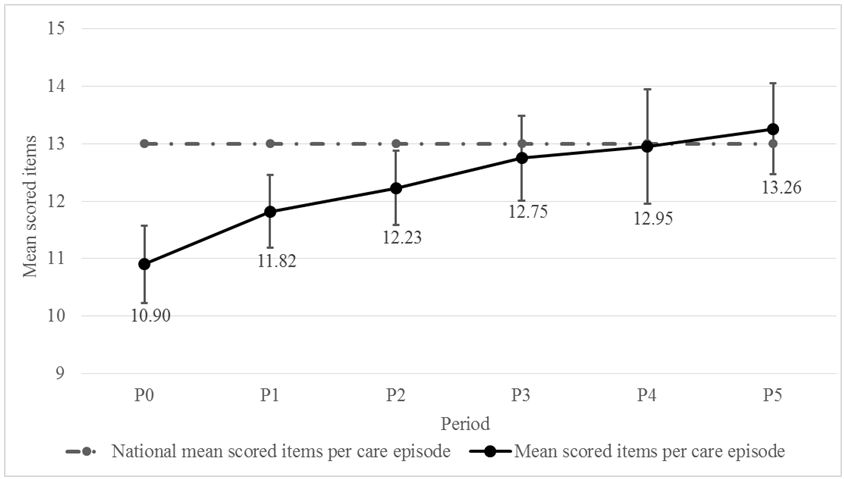
The results for the result indicator were measured after each period. This took the form of the mean number of scored items per episode of care. This is the mean number of scored items corresponding to any nursing intervention performed by the nurse for the patient during an episode of care (0 to 91 nursing interventions per episode) [1].
It is compared to the National Mean of scored items per episode of care. This National Mean was extracted from our 3M Benchmark Portal. It represented a mean of 54/116 non Psychiatric Belgian Hospitals using the DI-RHM. Before the first period, we chose the goal in the Benchmark for the last complete year (2015). The previous National result received by the Ministry of Public Health was from 2014 [14]. We count all episodes of care for each patient hospitalized in the same ward. An episode of care can last from 00:00 to 23:59 or less, the days of admission, discharge or transfer [1].
Three Process Indicators were measured during each Period
The proportion of checked care episodes is the number of care episodes checked by the trained assigned nurses during the period compared with the total number of episodes recorded during the same period. The proportion of feedback is the number of instances of positive or corrective feedback given by the assigned nurses to their colleagues after checking the records. This feedback could be both oral and written (sent by e-mail). After each period, a document with the total number of care episodes checked by assigned nurses and feedback given to colleagues were send to the expert nurse for analysis. The proportion of complete validation of nursing interventions is the number of nursing interventions which were adequately validated compared with the total number of validated nursing actions during an episode of care. Expert nurses chose four random episodes of care per ward and per period to calculate this proportion and gave written feedback for each ward. In the programming of nursing care, some types of nursing intervention require a result together with validation by the nurse. Some nurses find a way to record the intervention quickly but without entering a result. In this case, the intervention is considered as not performed and the item is lost (example: when urinary elimination follow-up is validated without a quantitative or a qualitative result record).
Before the study, a goal was chosen for each indicator based on the Mean National result for the scored items per care episode (13.30/91) and, for the process indicators, on the hypothesis that it would represent the reality of care and be reachable in terms of the quality and sound management of patient care and their files: 50% for the checked episode of care, 100% for the feedback and 90% for complete validation of interventions. Descriptive statistics are given as a mean with their standard deviation (SD) for the result indicator and the percentage for process indicators.
The percentage of scored items per care episode was studied by logistic regressions with a mixed model. For regressions stratified for period and ward, each couple of ward and period was taken as a random effect. Regressions were computed following a generalized linear model by quasi least squares. Statistical significance was established from the robust sandwich variance according to Mancl and DeRouen (Biometrics, 2001: 57, 126-134). The coefficients of logistic regressions that were non-intuitive changes in logits were illustrated by the corresponding change in the number of cases to identify one more item when the initial percentage is equal to the average of the period 0 (10.9/91). A 2-sided p-value < 0.05 was considered statistically significant. All data analysis was performed using Stata software version 12.0 (StataCorp LP, College Station, Texas, USA).
During the study, there were 21,193 episodes of care with 48,168 scored items with a global mean (interquartile) per care episode of 12.33 (6). The mean scored items per care episode increased significantly per period from 10.90 (P0) to 13.26 during the last period (p <0.001). The proportion of scored items per care episode increased continuously over the successive periods. The difference was significant between periods P0 and P1 (p< 0.001), P1 and P2 (p<0.001), P2 and P3 (p= 0.002), P3 and P4 (p=0.041), with a progressive increase to a plateau (Table 3, Figure 1).
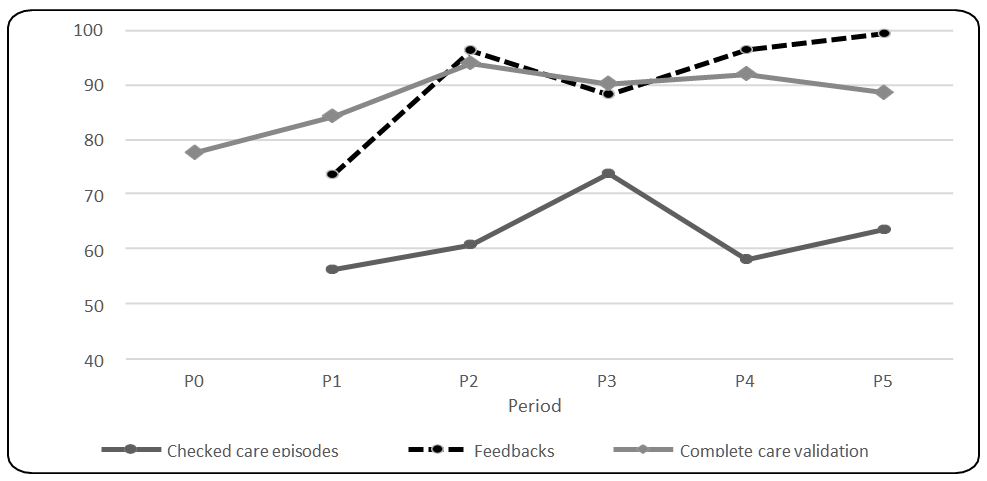
The goal for the proportion of checked episodes of care was achieved significantly in P1 and continued to increase until P3. It decreased in P4 and finally increased again in P5, but always beyond the expected goal of 50% (p < 0.001).
The proportion of feedback given by the assigned nurses to their colleagues increased each period (except in P3) to reach the goal of 100% during P5.
The rate of complete validation of care varied according to the period but reached the goal (90%) between P2 and P4 and then decreased slightly in P5 (Figure 2).
The Relationship between Result Indicator and Process Indicators: Stratified forward and period, the proportion of scored items is higher when the assigned nurses checked the care episodes (p=0.009). The difference for a basal value of 10.9/91 should be the addition of one item for 2.61 cases (IC 95% 1/1.48 to 1/10.5). Even in cases where checking did not occur, the increase remains significant across the periods P0 to P5 (p=0.005). The increases are not different (p=0.71) for episodes of care with and without checking during periods from P1 to P5, demonstrating that the progression over time is an independent factor and not exclusively linked to higher levels of checking.
Stratified forward and period, the proportion of scored items was not significantly different for feedback (p=0.25) or for complete validation of care (p=0.10) Stratified forward and period, the proportion of scored items was higher with fully-staffed teams per episode of care (p=0.007). The difference for a basal value of 10.9/91 should be the addition of one item for 4.96 cases (IC 95% 1/2.86 to 1/18.2). Selecting only the episodes of care taking place without fully-staffed teams, the increase remains significant across the periods P0 to P5 (p < 0.001). The increases are not different (p=0.97) for episodes of care with and without fully-staffed teams during periods P1 to P5, demonstrating that the progression over time is an independent factor and not exclusively linked to the impact of fully-staffed teams.
Our results showed that the mean number of scored items per care episode increased significantly during each period to reach the National Mean (p<0.001). Since computerization of the nursing patient file, we noted a decrease in the mean number of items recorded per care episode from 9.80 to 6.39. The number of items extracted from the electronic patient file depends on the quality of care records and their validation. The teams were complaining of difficulties in managing and using the computer tool.
Our results showed a significant temporal correlation between the quality of the electronic nursing patient file record and the involvement of the nurses in its administration by checking episodes of care with an increase of one item for 2.61 checked episodes of care. Similarly, our results showed a significant temporal correlation between the quality of the electronic nursing patient file record and a fully-staffed management of the teams with an increase of one item for 4.96 proportion of better fully-staffed team management.
The support given by expert nurses in training the assigned nurses to check episodes of care is a contributing factor for the increased mean number of scored items period after period.
Another factor contributing to the improvement in the quality of the records was whether teams were fully staffed. We also demonstrated that independently of the process indicator measures, the mean number of scored items improves over time. Firstly, it could be due to greater expertise in the electronic patient files and secondly an indirect stimulating effect when the user is aware of the usefulness of qualitative record keeping. These results are consistent with a number of previously carried out studies. Those studies showed that short training periods and staff shortages could represent barriers to successful adoption of the electronic patient file. This could lead to missing data [8,9,13,19-23]. Other studies report that technology can help to improve quality of the documentation, efficiency, safety and coordination of care, if the users are trained and supported [13,17,18,24,25].
We do not see a statistically significant effect of the feedback on the number of scored items in our study. The contributing factor could be the low number of checked episodes of care without feedback (960/10813 or 9%).
Checking by the assigned nurses highlighted the shortcomings that had been communicated by means of the high level of feedback, enabling the users to improve their use of the computer tool and possibly also contributing to a better understanding of the tool and a willingness to use it.
We do not see any effect of the number of completed validations on the number of scored items. An explanation could be the very few episodes of care checked by the expert nurses for complete validation of care (5,426/21,192 or 26%). Regarding the results of the analysis of incomplete validation of care, it could easily be inferred that this was not due to a lack of motivation or goodwill but rather a lack of time or familiarity with the tool.
We found that some nurses found a faster way to validate the care in order to save time or, mainly among temporary nurses, because they were not sufficiently familiar with the tool. Checking this indicator allowed us to identity the nurses who needed retraining in the correct validation of a nursing intervention.
Although the results of this study are consistent with other studies carried out previously, our results should be considered with caution for several reasons. Firstly, data on interventions performed by the assigned nurses for the process indicators were collected and analyzed by the DI-RHM coordinator at the end of the period but we cannot rule out that a number of checked episodes or feedback comments may have been omitted and this may have led to the associations found. Some assigned nurses reported they did not complete the document every day but sometime days later. However, even if the report checking episodes and feedback comments were underestimated, the expected goals of these indicators were achieved.
Overestimation of the number of checked care episodes or cases of feedback is unlikely since they were limited to the number of existing episodes of care per day. Secondly, in Belgium we are facing a shortage of nurses. The target number of fully-staffed teams per episode of care was only achieved during the last period. We tried to overcome the shortage and cases of nurse absences by means of temporary nurses, however there is also a shortage of temporary nurses [13,23,26].
Faced with that situation, the teams just did their best to check episodes and provide feedback as usual for the project. This situation could be a contributing factor for the quality of management of the electronic nursing patient file.
In Belgium, we have different nursing electronic patient files. Temporary nurses have to learn the different computer tools used in each hospital where they work and may not have the opportunity to use a single tool for an extended period of time. We understand that this situation could represent a real weakness for team work and temporary nurses’ skills. The proportion of temporary nurses working in a ward was not considered in our study. It would be interesting to investigate whether the proportion of temporary nurses might have an influence on the results. Indeed, the teams reported that temporary nurses, which are relatively infrequent at our hospital, are sometimes less motivated or less well-trained in completing the electronic patient file and may well forget how to validate the care appropriately. This could explain the decrease in the proportion of complete validations of care during P5. Finally, this is a monocentric study with an in-house electronic nursing patient file which could only be extrapolated with caution to other centers using different electronic tools and training programs. Nonetheless, we did not find any other similar published studies with which to compare.
The analyses of the indicators showed that a statistically significant improvement in the quality of the electronic nursing patient file records occurred when its management was by trained assigned nurses and when episodes of care were checked by fully-staffed teams. Finally, during this study we were able to observe that more and more nurses became experts in electronic patient file management.
As temporary nurses are deployed to cover unplanned situations, other projects are needed to highlight more effective strategies for optimum participation of temporary staff with a view to improving the quality of daily file management.
This research did not receive any specific grant from funding agencies in the public, commercial, or not-for-profit sectors.
None of the authors reports conflicts of interest relevant to this article
This study does not require approval by the ethics committee at Hôpital Brugmann (consulted on 24th August 2018). All data was processed anonymously.
We would like to thank our colleagues in the electronic nursing patient file quality team for their support and confidence during implementation and follow-up of this project. We want to thank especially the medical and the surgical nursing teams and their team leader for their collaboration and commitment to this project.
We thank Mrs. Collins A.M. and Mr. Mac Gabhann C. for checking the English version of the manuscript.