A Study of Activity Concentrations in Water Samples from Kurigram, Bangladesh
The radioactivity levels in 45 water samples collected from tube-wells, shallow pumps, ponds and the river from different places of Kurigram district in the northern region of Bangladesh have been determined. The activity concentrations of natural radionuclides have been measured by using Gamma Spectrometry System. The observed activity concentration of 238U for all samples ranges from BDL to 41±6 Bq/l with the mean 8.9±3.6 Bq/l for tube-wells, 5.8±2.6 Bq/l for shallow pumps, 6.2±2.8 Bq/l for pond and 10±3 Bq/l for the river, activity concentration of 232Th ranges from BDL to 19±4 Bq/l with the mean 3.6±2.4 Bq/l for tube-wells, 1.3±0.5 Bq/L for shallow pumps, 1.8±0.67 Bq/l for ponds and BDL for the river. The activity concentration of 40K ranges from BDL to 104±23 Bq/l with the mean 52±22 Bq/l for tube-wells, 44±22 Bq/l for shallow pumps, 41±22 Bq/l for ponds and 62±23 Bq/l for the river. Artificial radionuclide 137Cs was not found in the water samples studied. It suggests that the radioactivity in drinking water for the people residing Kurigram is not yet a problem. This study has been undertaken to measure the radioactivity levels in water samples, as a part of environmental radioactivity- monitoring program for the assessment of radiation exposure to the population of Bangladesh.
Keywords: Water samples; Gamma Spectrometry System; Radioactivity; Kurigram district
Environment is quite important for human health. There are various agents, which can affect human health either directly or indirectly. Cohort type cancer studies such as have indicated that environmental factors are more influential than genetic susceptibility in cancer formation [1]. Environmental Radioactivity is increasing day by day in the earth crust due to various reasons e.g. nuclear explosion, decaying of Ozone layer etc. The assessment of radioactivity in different sample materials of the environment components like soil, water and food stuffs etc are essential to control the environmental pollution to safe the living being [2]. Humans are exposed naturally to ionizing radiation from a number of sources which include cosmic rays and natural radionuclides in air, food and drinking water [3]. Radionuclides are the sources of radioactivity and emit nuclear radiations which have become a part of our daily lives. The most common forms of ionizing radiation are alpha particles, beta particles and gamma rays [4]. There is no where on Earth that one can get away from Natural Radioactivity [5].
Water is indispensable to human life, thus an important parameter of environmental science. The presence of radionuclides in drinking water posses a number of health hazards, especially when these radionuclides are deposited in the human body, through drinking water [6]. It is well known that water can be a source of radiation, as it contains certain amounts of naturally occurring radionuclides. Their levels in drinking water may be increased through a number of human activities such as nuclear fuel cycle and medical or other uses of radionuclides. In addition to the control of radionuclide concentrations for radiation protection, it is very important to assess the effective dose in order to predict possible biological damage to the organism [7].
Rain water and snow are also early indicators of radioactive contamination. Drinking water and household water are potentially important pathways, directly or through their use in food preparation and processing, although dilution, time delays and water treatment can reduce the contamination levels markedly. Water consumed by livestock and used for irrigation purposes can also be a source of radionuclides in foods. Sea water can be a contamination source for seafood (e.g. mussels, shellfish, fish, and algae).
Water from streams, lakes and ponds should also be considered as a source of contamination [8].
The concentration of the radioactive isotopes in water depends on its geo-chemical history. According to the world health organization (WHO), about 1.1 billion of people do not have potable water and the biological contamination is a serious problem for that population. It is important that the biological chemical and radiological contamination of the potable water be equal or less than the levels recommended by international health organization like that recommended by the WHO or by national regulation [9]. In order to guarantee an exposure lower than 0.1 mSv/y WHO recommends the guideline values for drinking water 0.1 Bq/L for alpha activity and 1 Bq/L for gross beta activity [10]. Thus, measurements of natural radioactivity in ground, surface and domestic water have been performed in many parts of the world, mostly for assessment of the doses and risk resulting from consuming water. Efforts to determine levels of such radioactivity will help in the development of guidelines for the protection of the human beings [11].
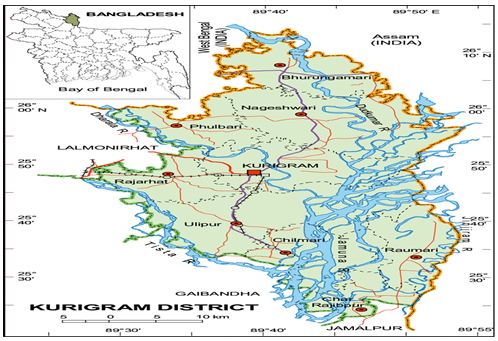
Kurigram District is located in the northern region of Bangladesh along the border of India. It is under Rangpur Division. The number of upazila (sub district) in Kurigram district is 09, named- Kurigram Sadar, Ulipur, Chilmary, Nageshwary, Vurungamari, Char-Rajibpur, Roumari, Rajarhat and Fulbari. Its coordinates are 25°45'0" N and 89°40'0" E in DMS (Degrees Minutes Seconds) or 25.75 and 89.6667 (in decimal degrees). This district is surrounded by Cooch Behar district of India in the north, Gaibandha district of Bangladesh in the south, Assam state of India in the east and, Lalmonirhat and Rangpur districts of Bangladesh in the west. Weather of the Kurigram district is bit different from the middle or southern part of Bangladesh. During summer, temperature is higher and during winter is lower than middle or southern part of Bangladesh. The average maximum temperature is about 32-33 degree Celsius when average minimum temperature is about 10-11 degrees. Heavy rainfall is usually observed during the rainy season like other parts of Bangladesh and the average annual rainfall is about 3000 mm. Several rivers are flowing through the heart of this district. The major rivers are Brahmaputra, Dharla, and Tista with minors are Dudhkumar, Phulkumar, Gangadhar, Jinjiram etc [12]. The bottled water samples are collected from different upazila of a northern district (Kurigram) in Bangladesh.
Kurigram is an agricultural district of Bangladesh. The main agro products are Paddy, Jute, Betel, Betel Nut, Peanut, Sugarcane, Wheat, Maize, Chilly, Bamboo, Vegetables etc. The products are supplied all over the country. Hence people may be exposed by radiation through the water and through their use in food preparation and processing. Water used for irrigation purposes can also be a source of radionuclides in foods. Efforts to determine levels of such radioactivity of ground and surface water in Kurigram will help in the development of guidelines for the protection of the human beings.
In order to measure the natural and artificial radioactivity in ground and surface water, forty-five water samples were collected randomly from different locations of different upazila of kurigram district. The choice of sampling locations was based on elevated radiation background in the northern region in Bangladesh. The samples were kept into previously cleaned 1 L capacity plastic bottle using manual procedure. The samples were appropriately coded from 1 to 45. Forty five 1 L capacity Pyrex beakers were washed with distilled water and left to dry to avoid sample contamination. About 1 L of each sample was poured into a Pyrex beaker. One milliliter concentrated HNO3 was added to each water sample to avoid the collection of organic materials and changes in the oxidation state of the ions present in the samples. Subsequently, the water samples were slowly evaporated by water bath treatment at 105 °C and reduced upto 250 mL approximately and each of the samples was transferred to cylindrical plastic-container. The containers were approximately of equal size and shape (i.e. diameter 6.5 cm and height 7.5 cm). The containers were then labeled properly and sealed tightly, rapped with thick vinyl tapes around their screw necks for gamma detection in HPGe detector.
To qualitatively identify the contents of radionuclides in water sample and to quantitatively determine their activities, all prepared samples were measured by means of gamma-ray spectrometry system using ORTEC high purity Ge-detector for 10000 sec. The volume of the detector was 83.49 cm3 and the distance between detector and sample was 0.3cm. The equal counting time for background and sample measurement was chosen to minimize the uncertainty in the net counts. The spectrum of each sample was analysed and the identification of unknown radionuclides was carried out by considering their peak centroid energies. The centroid energies of the peaks from the spectrum were compared with the reference gamma-ray energies obtained from the literature. The radionuclides contained in the samples were identified and the areas under the peaks were used to determine the activity concentrations of each nuclide. The activity concentrations of 238U and 232Th were determined from the average concentration of nuclides [Pb214 (295.2keV), Pb214 (351.9keV), Bi214 (609.3keV) and Bi214 (1120.2keV)] and [Pb212 (238.6keV), Tl208 (583.1keV), and Ac228 (911.2keV), Ac228 (968.9keV)] respectively. The activity concentrations of 40K were determined directly by measurement of the gamma-ray transitions at 1460.8keV. Spectra of 45 samples of samples were acquired. The gamma-ray energies and decay branching ratios used to check the identification were obtained from the literature [13]. In order to determine the background level of germanium detector, a background measurement was counted for 10000 sec. with no radiation source present around the hyper-pure germanium detector. A ‘standard’ background spectrum was taken with an empty sealed beaker placed on the detector to maintain the same geometrical conditions. To reduce gamma ray background, a few of cylindrical lead shields with a fixed bottom and moveable cover shielded the detector.
The specific activity, in terms of the activity concentration, is defined as the activity per unit volume of the sample. The specific activity of individual radionuclides in water samples is given by the following equation:
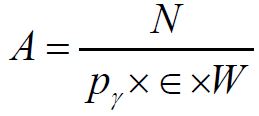
Where,
N = Net counts per second (cps) = (Sample cps) – (Background cps)
pγ = Transition probability of gamma ray or Branching ratio
ε= Efficiency in percent
W= Weight of the sample in liter
Each count rate includes standard deviation and the standard deviation of the net count rate can be expressed as [16],
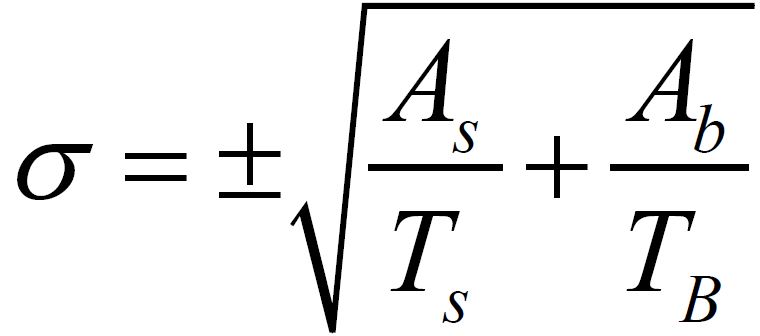
Where,
σ = standard deviation
As = Sample count rate in cps
Ab = Background count rate in cps
Ts = Sample count time
Tb = background count time
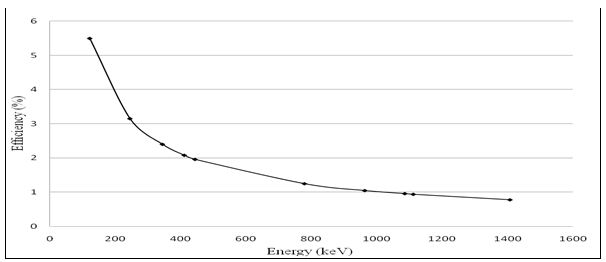
In the present study, 10 transitions or gamma ray lines of the radionuclide _152Eu were used to perform the efficiency calibration. The efficiency calibration curve is shown in (Figure 2).
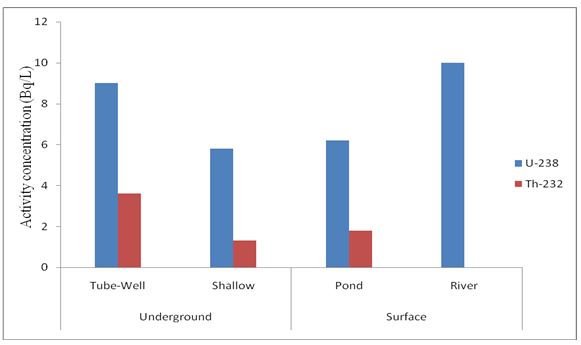
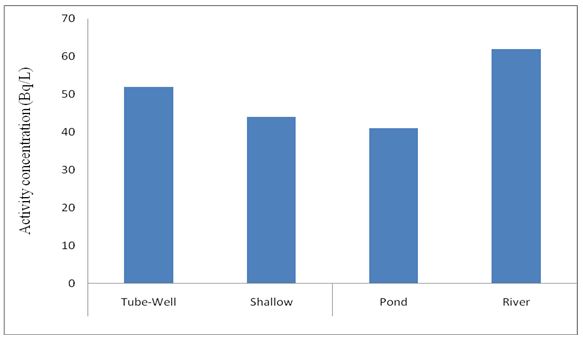
The activity concentrations of 238U, 232Th and 40K for different water samples for different upazilas of Kurigram have been measured and are presented in ( Table 1,2,3,4 and 5). The average activity concentrations of Kurigram district are given in (Table 6). The observed activity concentration of 238U for all samples ranges from BDL (Below Detection Limit) to 41±6 Bq/L with the mean 8.9±3.6 Bq/L for tube-wells, 5.8±2.6 Bq/L for shallow pumps, 6.2±2.8 Bq/L for ponds and 10±3 Bq/L for the river. The activity concentrations of 232Th ranges from BDL to 19±4 Bq/L with the mean 3.6±2.4 Bq/L for tube-well, 1.3±0.5 Bq/L for shallow pump, 1.8±0.67 Bq/L for pond and BDL for the river water. The activity concentration of 40K ranges from BDL to 104±23 Bq/L with mean 52±22 Bq/L for tube-wells, 44±22 Bq/L for shallow pumps, 41±22 Bq/L for ponds and 62±23 Bq/L for the river. For tube-well water activity of 238U is higher than that of 232Th in all upazilas except Kurigram sadar. For pond water 238U is higher than that of 232Th in all upazilas. It is observed from Figure 3, the highest mean activity concentration of 238U was found in the river water and the lowest activity was found in shallow water and the highest mean activity concentration of 232Th was found in tube-well water and the lowest activity was found in the river water. It is also observed from the present study that the mean activity concentration of 238U is higher than that of 232Th in all types of water samples which is shown in (Figure 3). The highest mean activity concentration of 40K was found in river water and the lowest activity, in pond water are shown in (Figure 4).
From the Table 7, it observed that the activity concentrations of 238U in the tube-well water are comparable with the tube-well water in Dhaka and Dinajpur but higher than the tube-well water in Kushtia and the tap water in Dhaka. In the tube-well water in Kurigran, 232Th has activity concentrations comparable with the tube-well water in Dinajpur and tap water in Dhaka. Its activity concentration is higher than the tube-well water in Kushtia and lower than the tube-well water in Dhaka.
The activity concentrations of 40K in all types of water in Kurigram are comparable with the tube-well water in Dhaka but higher than the other region of Bangladesh as shown in (Figure 4).
The activity concentrations of the naturally occurring radionuclides 238U, 232Th and 40K and that of artificial radionuclide 137Cs in 45 water samples of different locations in Kurigram, the northern district of Bangladesh, have been studied for the first time.The activity concentrations of 238U in the tube-well water are comparable with the tube-well water in Dhaka and Dinajpur but higher than the tube-well water in Kushtia and the tap water in Dhaka. In the tube-well water in Kurigran, 232Th has activity concentrations comparable with the tube-well water in Dinajpur and tap water in Dhaka but it has activity concentration higher than the tube-well water in Kushtia and lower than the tube-well water in Dhaka. The activity concentrations of 40K in all types of water in Kurigram are comparable with the tube-well water in Dhaka but higher than the other region of Bangladesh. Artificial radionuclide 137Cs was not found in the water samples studied. The natural radioactivity in Kurigram poses no health hazards to the population living there. This paper will provide database for anticipated radiation protection measures when need arises. Finally, this work will help in establishing a regulatory limit on radiation in public drinking water as well as in all types of water in the northern region in Bangladesh.