A Study on the Executive Dysfunction in Alcohol Dependent Persons in Barak Valley and its Adjoining Areas
Aim: To compare the executive dysfunction of alcoholic dependent cases with age matched controls.
Method: Fifty alcohol dependent cases along with fifty healthy relatives of the patients selected randomly were included in this single interview cross-sectional hospital based study. The executive function of all the cases and control were tested by applying the Frontal Assessment Battery.
Results: On making a comparison of the scores of the FAB between the cases and the controls, it was found that the mean score of the cases was 10.02 with a standard deviation of 2.64 indicating more executive dysfunction whereas that of the controls was 16.96 with a standard deviation of 1.56 showing better executive functioning.
Keywords:Alcohol Dependence; Executive Dysfunction
The impact of alcohol on the present day society is overwhelming. The number of people who consume alcohol has shown an alarming rise in the past decade. There are 208 million people with alcoholism worldwide according to The World Health Organization as of 2010 (4.1% of the population over 15 years of age) [1]. Studies show that impairments in chronic alcoholics including decline in one’s ability to process new information, acquire new skills and plan strategies [2]. There have been many attempts at gauging the neurocognitive deterioration that occur in chronic alcoholics. Episodic memory deficits associated with long term drinking has also been associated with the loss of executive dysfunction. Thus it was found that assessing the executive dysfunction in chronic alcoholics can help us in realizing the extent of cognitive decline.
Executive functions are not a singular concept. It involves a set of processes, which refer to the individual’s ability to solve complex problems. Executive functions are described as having four components: The abilities of goal formation, planning how to achieve that goal, carrying out the plans, and effective performance. A person with intact executive functions can continue with his or her independent life irrespective of having any kind of cognitive loss [3]. They are also seen to predict the prognosis of chronic alcoholics. If there is any executive dysfunction, task oriented behavior of the individual is hampered. This causes disruptions in behavior which need control of natural responses and goal activation which is important for adjusting to environmental changes and act accordingly [4]. Subsequently, problems of impulsivity, hyperactivity, disorganized behavior and aggressiveness arise in clinical patients with executive dysfunction. There may be some emotional dysregulation also in such patients, which can ultimately manifest into mood disorders [5]. Various studies have reported that most of the patients with alcohol dependence are prone to suffer from progressive cognitive deterioration particularly the executive functions [6-8]. Cognitive impairments in alcohol-dependent patients without any other neurological complications are increasingly becoming the focus of attention of addiction medicine specialists, as, according to various studies, between 50 and 80% of these patients present with impaired cognitive function [9,10]. Detailed neuropsychological assessment or screening of these cognitive impairments appears to be fundamental to optimally adapt patient management strategies [11-13].
Adhikari, et al evaluated executive function with Frontal Assessment Battery in alcohol dependent inpatients (N=62) after the stage of detoxification is over and reported that one third of study subjects had cognitive dysfunction [14].
These cognitive impairments have a significant impact on the efficacy of management. It therefore appears important to identify alcohol-related cognitive impairments so that alcohol treatment can be adapted to meet their needs.
With this overview, our study aims at evaluating cognitive dysfunctions particularly the executive functions and memory in patients with alcohol dependence, which is rampant in this part of the country and such studies have not been done in this region of Northeast India.
(i) To find out the important socio-demographic variables of the cases (ii) To evaluate the different domains of executive cognition in the cases (iii) To compare the scores of the alcohol-dependent subject group with the nonalcoholic control group
This is a descriptive study of cognitive dysfunction in patients with alcohol dependence syndrome carried out in the Department of Psychiatry, Silchar Medical College and Hospital, Assam, India, which is a tertiary care teaching hospital over a period of six months after taking proper approval of the institutional ethics committee. This hospital provides medical facilities to the whole Barak Valley of southern Assam, which includes the districts of Cachar, Karimganj and Hailakandi along with the neighbouring states like Manipur, Mizoram and Tripura, India.
All patients who were admitted for detoxification of alcohol were enrolled in the study immediately after completion of detoxification with benzodiapenies and gabapentine. Average period of detoxification was about two weeks. Alcohol dependence cases were diagnosed according to the International Classification of Disease and Related Health problems (ICD-10) criteria (clinical descriptions for diagnostic guidelines) [12].
Admitted patients above 18 years of age and who gave written informed consent to participate in the study were included. Fifty subjects were included in the study. Sample was taken on the basis of purposive sampling. All the fifty subjects had a first-degree relative above eighteen years of age and fulfilled all the inclusion and exclusion criteria. Informed consent was obtained. There were no harms to the participants in the study. The average abstinent period before cognitive evaluation was two weeks. Cognitive assessments were conducted using the Frontal Assessment Battery and the Montreal Cognitive Assessment Test (MoCA) after 72 hours of last dose of benzodiazepine/gabapentine used for detoxification of alcohol. Inclusion criteria for subject group were diagnosis of alcohol dependence obtained according to diagnostic criteria ICD-10, abstinent since at least last 3 weeks, and had not taken any psychotropic drugs since last 72 hours. Subjects having history of any other drug abuse including tobacco, significant head injury, clinically apparent neurological problem or seizure other than alcohol withdrawal seizure, history of previous psychiatric illness, mental retardation were excluded from study. Patients in intoxicated state or in acute withdrawal state or in delirium were excluded. Details of alcohol use in the cases showed that average duration of alcohol dependence was 3.97±3.20 years and their mean amount of alcohol consumption was 26 drinks per week. Majority of the participants used to drink alone and consumed Indian made foreign liquor
The age matched first-degree relatives of the alcohol dependence cases were considered as controls. General Health Questionnaire score more than 2 was considered as cutoff point for the control group. The exclusion criteria were, having any past diagnosis of psychiatric disorder, abusing alcohol or any other substances, clinically apparent neurological problem and significant head injury. At first informed consent from all patients were taken after explaining them the purpose and procedure of the study. Interview pattern was flexible to elicit maximum data. For all cases, privacy of interview and confidentiality was strictly maintained.
1. A standard proforma describing socio-demographic variables was used which was designed and standardized and tested in the Department of Psychiatry, Silchar Medical College Hospital. The socio-demographic proforma gave information about age, gender, religion, marital status, family type and domicile, education, occupation and socioeconomic status of alcoholic cases and their relatives.
2. For the assessment of the executive functions in individuals, Frontal Assessment battery (FAB) was used. FAB is a tool, which differentiates between frontal executive type of dementia and Alzheimer’s type of dementia. This test has also been used for individuals with frontotemporal dementia, Parkinson’s disease dementia, corticobasilar degeneration, progressive supranuclear palsy and multiple system atrophy and also for evaluating the extent of brain injury [11]. FAB is a reliable and quick bedside test, which has six subtests: Similarities, Lexical fluency, Motor Series, Conflicting Instructions, Go/No-Go, PrehensionBehaviour. FAB has good interrater reliability (k 5 0.87, p, 0.001), internal consistency (Cronbach’s coefficient alpha = 0.78), and discriminant validity(89.1% of cases correctly identified in a discriminant analysis of patients and controls). The Frontal Assessment Battery is easy to administer at bedside and is sensitive to frontal lobe dysfunction. The maximum score for each subtest is 3 points and the total score of test is calculated by adding the scores of the six subtests (maximum score=18). The executive function of all the cases and control were tested by applying the Frontal Assessment Battery [11]. Higher scores mean better executive functions of the individual. The original English version of the FAB was translated into Bengali by the two Authors carrying out the present study, blinded to each other. The two translations were subsequently compared: minor inconsistencies were found and solved; consistency was also reached on wording for all verbal instructions.
3. The Montreal Cognitive Assessment (MoCA) Test was used as a screening test for detection of cog nitive impairments in these patients, as this tool is more sensitive than the Mini Mental State Examination (MMSE) for mild-to-moderate cognitive impairments [15,16]. The test is a one-page, 30-point. It assesses short-term memory recall (5 points), visuospatial abilities through clock-drawing (3 points) and cube copy (1 point), and orientation (6 points). Executive function is assessed through modified Trail Making Part B (1 point), phonemic fluency (1 point), and verbal abstraction (2 points). A sustained-attention task (1 point), digit span (2 points), and serial calculation (3 points) test attention, concentration, and working memory. Lastly, language is assessed through naming low-familiarity animals (3 points), sentence repetition (2 points), and the fluency task. The rater adds 1 point to the score of patients with ≤ 12 years of education.
Appropriate data were collected, tabulated and Statistical analysis was done by GraphPad prism for windows version 6.01. Descriptive statistics were used to summarize the data. Unpaired t-test was applied to find out p-value and statistical significance wherever necessary. Significance was determined at p<0.05.
This hospital-based study was done on 100 individuals, 50 of which were cases and 50 of which were controls. The following Table shows the sociodemographic variables of the cases (Table 1).
The age of the cases is between 25-65 years of age with the mean age of 57.5 years. Majority of the cases was in the age range of 35-44 years (42%). These cases are mainly Hindu in religion (92%) and from rural background (70%). The majority of the cases belonged to joint family (62%) and 92% were married. Education wise majority of the cases were primary educated (68%) followed by secondary education (14%) while occupation wise most of the cases were servicemen (46%). Majority of the cases were from lower middle socioeconomic status (48%) followed by lower class (30%).
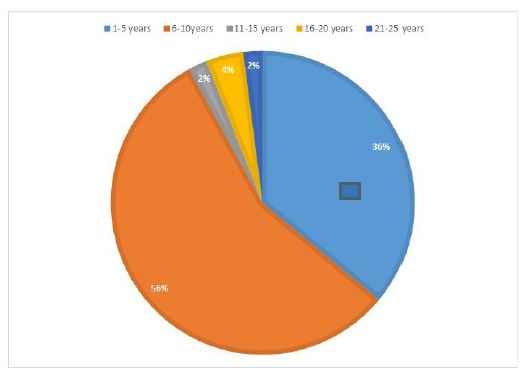
The duration of alcohol consumption among cases ranged from 1 to 25 years with the mean duration of 13.5 years. Maximum of the cases were in the range of 6-10 years (56%) followed by 1-5 years (36%) (Figure 1).
The age range of the controls was from 25-65 as in the cases and the majority fell in the 35-44 age groups (40%). Majority of the cases were Hindu by religion (94%), from rural background (72%) and belonged to joint families (70%). 92% were married and most of them had received primary education (64%). The controls were mainly businessmen (36%) and hailed from middle socioeconomic status (40%).
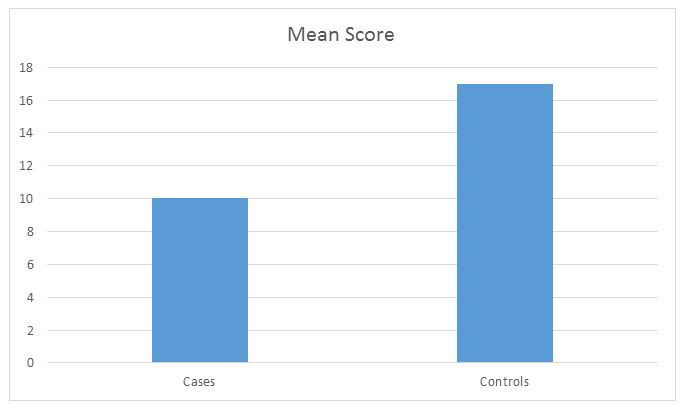
On carrying out the Frontal Assessment Battery on the cases and controls, we found out the score to assess the executive dysfunction in each case ( Figure 2). The results are as shown in Table 2.
Mean score in the Frontal Assessment Battery (FAB) was 10.02 ± 2.64. In FAB, abstract reasoning was the most impaired domain followed by lexical fluency and mental flexibility. Relatively, environmental autonomy was found to be preserved among the participants. Majority (62%) of the participants had average level of executive functions and 38% had executive impairments.
On making a comparison of the scores of the FAB between the cases and the controls, it was found that the mean score of the cases was 10.02 with a standard deviation of 2.64 indicating more executive dysfunction whereas that of the controls was 16.96 with a standard deviation of 1.56 showing better executive functioning. On applying the unpaired T test, the difference between the groups was found to be statistically significant with a p value of <0.0001 ( Figure 3).
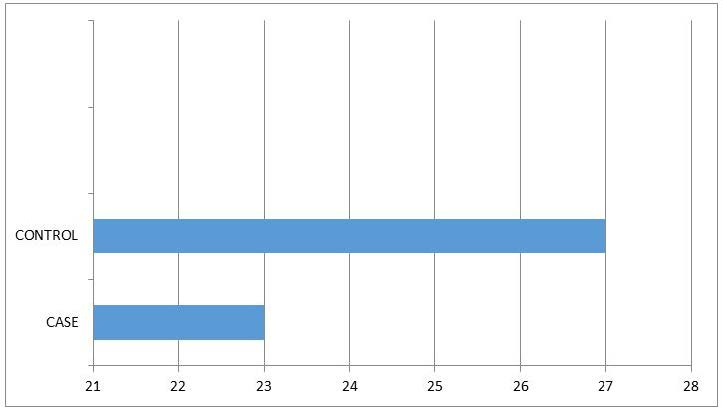
The mean score of the cases on Montreal Cognitive Test was 23 compared to the mean score of 27 in controls. The affected domains were – delayed recall, verbal fluency, visuospatial/executive and attention.
This study was to determine if chronic alcoholism had any effect on the executive functions of the individual. It was a hospital based study in which 50 alcohol dependent cases and 50 healthy controls were evaluated for cognitive impairment/executive dysfunction. The cases were chosen based on the International Classification of Disease and Related Health problems (ICD-10) criteria for alcohol dependence [12]. Alcoholism abuse results brain defects and associated cognitive, emotional, and behavioral impairments.
In the study we found that the majority of the cases were in the age range of 35-44years (42%) followed by the age range of 45-54 years (36%). This was similar to the findings of Singh, et al. in which maximum number of subjects (86%) belonged to the 36-45 years age group [13].Duration of alcohol consumption ranged 1 to 25 years with mean duration of 13.5 ±8.54 years. The period of alcohol dependence ranged between 4 months to 12 years with mean duration 3.97±3.20 years. Most of the participants (52.5%) in the study had moderate level of alcohol dependence, followed by severe (28%) and mild (19.5%) physical dependency. Similar findings were reported by Adhikari, et al. in a study conducted at a Tertiary hospital in Nepal involving 62 alcohol dependent subjects.
The mean score of the Frontal Assessment battery of the cases was 10.02 while that of controls was 16.96 indicating poor executive functioning in the cases compared to the controls. Adhikari, et al. from Nepal reported a score of 12.33 ± 2.46 in the alcohol dependent subjects. International studies conducted in New York also found that more the alcohol use poorer is the executive functioning [17].
Different domains of executive functions were impaired in 38% of patients with alcohol dependence. Concept identification is a multistep task, which needs memory, deductive reasoning, problem solving and cognitive flexibility, which was impaired in most of the study participants. Similarly, mental flexibility indicates towards problem in planning and ability to shift and maintain a cognitive set. These findings were consistent with the proposed hypothesis that alcohol dependents are poor in identifying the concept and differed significantly in the task of abstract reasoning, memory discrimination and timed tasks [18,19]. The three FAB’s subtests; conceptualization, programming and mental flexibility which were more impaired with chronic alcohol use are found to be the tasks that have been associated with the functioning of different areas of the prefrontal cortex [20].
Manisha Jha, et al., assessed the conceptual ability of thirty alcohol dependent subjects with WCST and compared the findings with thirty first degree relatives and thirty normal controls and opined that - alcohol dependent patients had poor conceptual ability than their first-degree relatives or normal control. Alcohol dependents in this study demonstrated significant impairment of abstract ability, error utilization and persuading goal directed behavior [21]. Earlier studies that investigated various executive functions among recently abstinent alcoholic individuals (i.e. sober for 3 weeks) reported deficits in inhibition of prepotent response cognitive flexibility and decision making, planning and abstraction [22-26].
In our study Montreal Cognitive assessment test was utilized for evaluating cognitive functions in alcohol dependent subjects. Copersino ML, et al., assessed the validity, accuracy, and clinical utility of a brief (10-min) screening instrument, the Montreal Cognitive Assessment (MoCA), in identifying cognitive impairment among patients with Substance Use Disorders. The Neuropsychological Assessment Battery-Screening Module was used as the reference criterion for determining rates of correct and incorrect decision classifications, and criterion-related validity for the MoCA. The MoCA showed acceptable sensitivity (83.3%) and specificity (72.9%) for the identification of cognitive impairment. These findings indicate that the MoCA provides a time-efficient and resource-conscious way to identify patients with SUDs and neuropsychological impairment, thus addressing a critical need in the addiction treatment research community. We have found four areas of impairment in cognitive functions in alcoholics namely – delayed recall, verbal fluency, visuospatial/executive function and attention. Adhikari, et al. used PGI memory scale in alcoholics and reported that almost half of the subjects had impairment in - delayed recall, recognition, attention and concentration.
Results of research employing a variety of different techniques have determined that the brain structures most vulnerable to the effects of alcoholism are the neocortex (especially the frontal lobes), the limbic system, and the cerebellum (reviewed by Moselhy, et al. 2001). Frontal lobe, amygdala, hippocampus and hypothalamus are the most affected regions in brain and are vital organs involved in Executive functions and Memory.
These findings will help clinician to recognize that a subgroup of chronic alcohol patients will manifest difficulty in treatment that are due to their lack of appreciation of the impact that advice and therapy will have on their lives. These patients fail to see the importance of ideas and events in treatment because they fail to recognize general rules and successful ways to cope effectively on neuropsychological test in question. Findings facilitates understanding that cognitively impaired alcoholic patients may not be able to comprehend the information imparted during therapy and, thus, may not make full use of the strategies presented, thereby limiting their benefit from intervention.
Our study found that majority of the alcohol dependant subjects were young and were Hindu by religion. The highest duration of alcohol intake was found to be in the range of 6-10 years. We can also conclude that regular and long-term alcohol intake significantly impairs the executive functions. Hence, routine neuropsychological assessment is of particular importance for early detection and remediation of underlying deficits, which completes the treatment of alcohol dependence.
1. It was a hospital-based study 2. We did not compare the executive dysfunction with various variables associated with alcoholism like severity of dependence, duration of alcohol intake, amount of alcohol intake and age.