Agricultural Monthly Rainfall Trends Disturbances in Yangambi Region, D R Congo
Has climate changed in Yangambi region due to global hit? Following cultural calendar, annual crop production has decreased by 34%. Also, intensified changes of rainfall, temperature, sunshine and evaporation in Sub-saharian Africa have been registered. Crops, vegetations and soils have been distroyed. To lighten paysan farmer, land user and scientist, chronological monthly rainfall registered from 1931 to 2017 for Yangambi have been computed by variability and times series regression analyses, seasonality and stationarity test for determining trends disturbances. The rainfall seasonal index (RSI) peak of september 158 % has taken over october 142%. The decreasing RSI for july 70% has downly replaced the increasing june RSI with 119%. June, august, september, october and november have formed the sustainable optimal vegetative phase within the active vegetative period from mars to november. In long dry season, the downing december RSI 40% has replaced january and february ones. Cyclical rainfall movements have presented the average of 99.53±26.16% at CV of 26.29% and identified 959/984 months superior to 100% having the deviation means of 2.126 months. The rainfall irregularities have varied at CV of 26.91%, averaged 0.978±0.263% from which the extrems are dominated by the dry seasons. The unsignificant serial rainfall lost of -1.753 mm and the significant average temperature increase of 0.44 °C manifested by hit peak decades of 1981-1990 and 1991-2000, have characterised since 2000 inter-seasonal rainfall disturbances which have not changed the Yangambi persisting bimodal regime of warm and humid equatorial climate. Begin sowing in the third decade of march for less water demanding crops and the second decade of august for all vegetative crop cycles. Make available climatic new trends information to users.
Keywords: Climatic Disturbances ; Seasonal Indexes; Agronomic Events ; Hydric Balance ; Rainfall; Yangambi
Global hit has increased since handred years by ±0.76 °C and changed climate impacting negatively on agriculture [1]. In Yangambi region, observed dates disturbance of soil cultivations and sowings, propice periods of fishing, hunting and livestocking and that of phyto and zoosanitary preventions, has resulted in decreasing agricultural production by 34% [2-4]. In fact, the bimodal monthly rainfall regime from 1931 to 2017 for Yangambi region characterized by two maxima at equinoxes and two minima at solstices having defined humid and warm climate, has met climatic variations [3,6,7]. During the long humid season, rainfall means peak of october with 229 mm has trended negatively while september with 199.44 mm and november with 202 mm have significantly increased. On the other hand, trending negatively the long dry season has depressed with december at 149 mm and january at 75mm [3,5].
In 84 years, the annual quantity of rainfall has unsignificantly diminished by -1.558 mm as well as normals have shown unsignificant decreasing means from 1931 to 1960 : 1805.92 mm, 1961 to 1991 : 1793.89 mm and 1982 to 2012 : 1768.39 mm inferior to annual means of 1819.82 mm. Moreover, annual means values dissimulate and masque high variabilities of monthly and ten daily regimes as compared to frequential water balance [3,6,7].
Also, the decennal regime of rainfall has shown a decreasing trend identified by ruptures during 1981-1990 and 1991-2000, periods of political and economical crises in DR Congo having led the population to cultivate about 15% of 235 thousand hectares of the natural biospheric forest reserve of Yangambi [3,5]. About 72000 inhabitants of Yangambi live of shifting cultivation, others exploite timbers for housing, canoes and exportation, others more deforestate for wood carbonisation [2,8].
Knowing that 20% CO2 emission responsable of green house, is liberated from slashing and burning agricultural deforestation yielding aerosols from biomass incinération and denuded soil humidity diminution reducing evaporated surfaces consequently rainfall surfaces, having enhanced latente hit flux from earth to atmosphere [9].
The global impact of climate change has been observed by global hit increase, due not only to deforestation, but also to fossile oil combustions from industries, urbanisations and new technologies. The hit has shortened winter, fonded glaciers, prolonged summer with persistent and severe temperatures and dusty tempests, dried streams and environment, destroyed soils, cultures, and vegetation with fréquent canicules, relented growth and so the capacity to extract atmospheric carbon. The climate change has intensified rainfall some times with catastrophic floods following specific ecological zones. It has detrimented human, animal and fish healths by infectuous and respiratory diseases threatning the adaptation of some species [1,9,10]. From climatological observations since 1931 in Yangambi region, ten daily or monthly chronological trend, seasonal, cyclic and irregular rainfalls have not yet been studied. The present study has the objective of identifying climate change impacting agricultural calendar in Yangambi.
Yangambi region is located at 0°49’N, 24° 29’E and 470 meters of altitude on sandy-clay to clayey-sand oxisoil of the structural catena of Yangambi vegetated by evergreen ombrophile dense forest of Brachystezia laurentii, and semi decideous forest of Scorodophloeus zenkeri, Pericopsis elata and Gilbertiodendron dewevrei in the central african depression of the DR Congo, sited as UNESCO MAB (man and biosphere) reserve. Yangambi acomptes for 76000 inhabitants at 100 km west from Kisangani city [11,12].
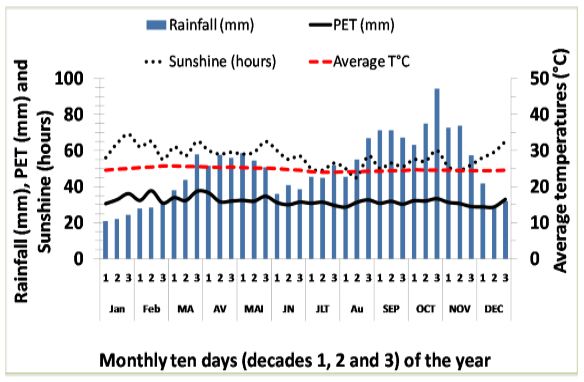
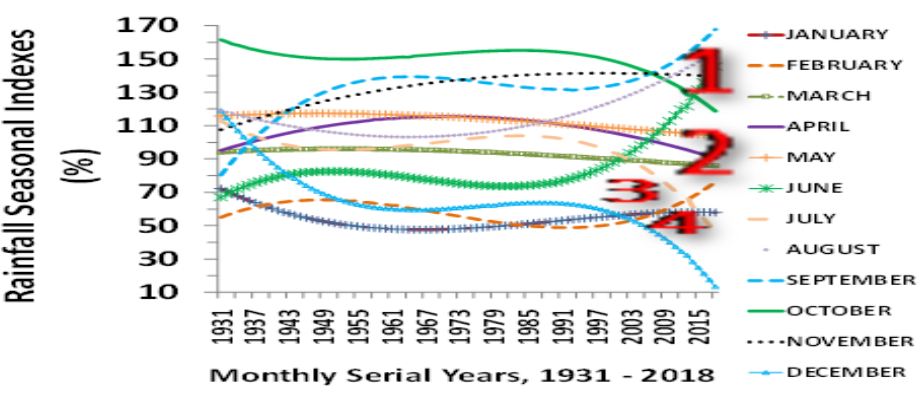
The monthly rainfall means curve of the year from 1931 to 2017 registreted in Yangambi is presented in Figure 1. The warm and humid climate in, is characterised by double periodicity of two maxima at equinoxes of may with 172.47±68.79 mm and october with 234.44±72.67 mm, respectively for the short and the long humid seasons, and two minima at solstices of june with 121.01±54.46 mm and january with 73.87±46.76 mm for the short and the long dry seasons [7,13]. Despite its negative rainfall trend, october the rainiest month, has been significantly superior to adjacents positive trend rainy months of september with 202.42± 84.54 mm and november with 201.42±57.80 mm [2,3].
It rains all the year in Yangambi with the decadal average of 50.84 mm (1820 mm per year) superior to ETP with 30.36 mm (1134.6 mm per year), of maximum temperature of 30.98 °C, minimum of 19.38 °C and average of 24.88 °C, relative air humidity of 87.5% and sunshine of 58.2 hours per decade (2020 hours per year) [2,3].
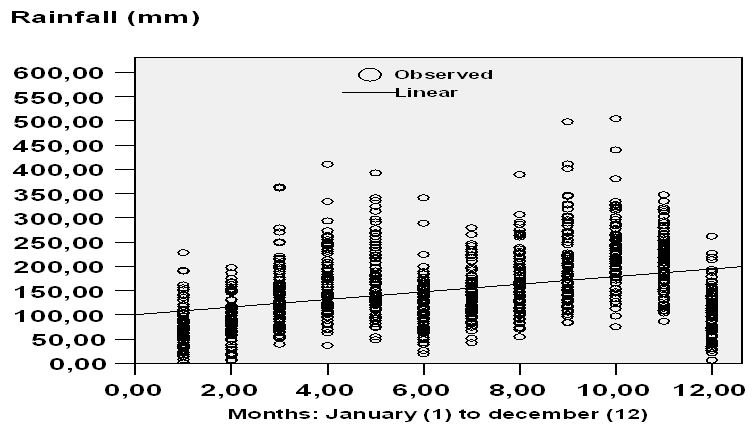
The serial monthly rainfall on Figure 2, is charactérised by the average of 151.54±76.76 mm per year or an annual average of 1819.814 mm, at the CV of 50.54%, between maxima of 505 mm registered in october 1983 followed by 498 mm in september 1974; and minima of 1.00 mm in January 2010 followed of 4.80 mm in january 1965 and 15.72 mm in fabruary 1954. The 12 months of the year are significantly different naturally in four seasons as prouved statistically by the regression Y= 100.655+ 0.363 X, and the test of Tukey HSD with p-value = 0.000 grouping them in homogeneous subsets as followed : (january, february), (february, december, june), (june, march, july), (march, july, april, august, may), (may, november, september) and october. Further the rainfall data will be adjusted in terme of probability and indexes to be compared for stability and durability.
Rainfall daily data (mm) have been registered from 1931 to 2017 at the Yangambi Km5 climatological station and computed in ten daly, monthly and yearly means. The yearly and monthly average temperatures and potential evapotranspiration from 1951 to 2017 have served in the discussion of results. Excel, SSPS 14.0, Statistics 10.0 and R 3.1 logiciels have served to compute and graph data treatments. Annual rainfall and temperatures rupture change points were detected by the test of Pettitt, trends by the test of Mann Kendhalln and stationarity by the test of Wald Wolfowitz [14].
Serial Monthly Rainfall Movement : Chronological monthly rainfall movements original data have been determined following Croxston and Cowden model characterized by the producted relation expressing the original data in column 2 of Table 1:
T X S X C X I = 0 (1)
where T= secular trend, S=seasonal variations, C=cyclical movement et I=irregular fluctuations which of all are variabilities analysed by regression, stationarity and seasonality tests with logiciels R 3.1 and statistics 10 [15].
The following table 1 has illustrated the columns process using so called the residual method which goes eliminating seasonal and trend factors in such that the irregular movement will be smothed and a set of adjusted data will show the cyclical movements (cyclical relatives) of the series.
The total mobile in column 3 is pratically the average of 13-months following the principle of monthly additivity of 1, 2, 2, 2, 2, 2, 2, 2, 2, 2, 2, 2 and 1. Numbers 1 are the values of rainfall from first and thirteenth months and 2 the double value of each month from second to twelveth months. For the present study, from january 1931 to january 1932, the total mobile obtained is for the month of july 1931. Substract from total mobile of july the values of january and february 1931 and add those of january and february 1932 to give the total mobile of august 1931 and the operation continues to the last month from one year to another.
The mobile average centered of 12 months is obtained by divising the total mobile by twenty four as seen in column 4. The original values of rainfall divided by the average mobiles centered corresponding result the centered mobile average of 12-months in percentage, in column 5. The percentages are arranged monthly on graphs to determine the soft curves of respective trends based on polynomial regression method with the highest coefficient of determination.
The obtained values of the curve of polynomial trends on the centered mobiles averages in percentages are the seasonal indexes of mobiles averages of the first approximation which will be ajusted such as each annual total of 1200 be the same for all the years of study to obtain the mobiles seasonal indexes means equilibrated from 1931 to 2017 (column 6).
The deseasonalisation of time series eliminates seasonal variations by dividing original values (relation 1) by mobile seasonal indexes (column 7) :
Then, eliminate the trend obtained from lineair equation Y=a+bx in monthly termes to obtain cyclical-irregular movements (column 9) such as :
Cyclical movement is obtained in proceeding the serie CXI to additivity principle of 1, 2, 1 whose the total is divided by 4 (column 11). Then the product CXI divided by the cyclic movement equalises the irregular fluctuations (column 12).
Agronomic Scale : Agricultural periods were determined following the frequential graphic method of probable rainfall intersected with PET having established intersections called climatic events projected on abscissa which have constituted agronomic scalel [16]. Rainfall frequencies were calculated following Markov chains method in terms of probabilities in percentage of two consecutive humid decades obtained from the normal of rainfall from 1950 to 2010 (means of two normals 1950 to 1980 and 1981 to 2010) [17]. Humidity being defined by the rainfallmetry as superior to 30 mm.
Agronomic scale has considered the following periods (R = rainfall, PET = potential evapotranspiration, RET = real evapotranspiration):
-Pre-humid period, intermediary (dry),
-Humid period, R > PET, PET = RET (5)
-Very humid period,
-Post-humid period (dry),
-Very dry period of soil water reserve utilisation and soil cultivations,
Humid Periods : Markov chains method in analyses probabilities of humid periods and dry periods [17]. Each of three decades of every month of january to december during 30 years of rainfall normal, has been characterised for the humid decade by positive sign (+) for rainfall superior or equals to 30 mm or the dry decade by negative sign (-) for rainfall inferior to 30 mm. The sum (S1) of signs + or – divided per 30 years for each decade equals the decadal probability of humid or dry period. The sum (S2) of ssuccessive two signs + ou – during 30 years of each decade divided per S1 equals decadal probability of most humid or driest periods. The probability of consecutive 2 or 3 humid or dry decades produces the sum S2 divided per S1 of 2 or 3 successive decades.
Climatic Water Balance: Climatic water balance has been calculated following Franquin equation [14] :
R + (I) ± r ± D ± DH – RET = 0 (9)
where R is rainfall, I=infiltration, r=runoff, D=drainage, DH= available soil water variation, and RET=real evapotranspiration. Water balance has consisted of available soil water content (AWC at soil horizon h in meter) calculated following Rawls formula with W330 water content at -330 hPa (mm/m) and W15000 water content at -15 000 hPa (mm/m), respectivement [18].
W330 = 257,6 − (2 x Sa) + (3,6 x Ar) + (29,9 x MO) (10)
W15000 = 26 + (5 x Ar) + (15,8 x MO) (11)
AWC = (W330 - W15000) x h (12)
Where Ar: Clay Content (%), Sa: Sand content (%), MO: Organic matter content (%).
The next components are HD = the smallest of the two values (WSR+R) and AWC, soil relative humidity (HR, %) = HD/AWC, PET = limit of MET, MET = superior limit of RET, production coefficient K = MET/PET = 1, RET = actual evapotranspiration = f (HR, PET), residual soil water = HD-RET, Runoff and drainage water RDW=(RS+R)-AWC, soil water deficit D(RS) = AWC-RS, relative evapotranspiration = RET/PET = PAT/PET = dry matter production index, evapotranspiration deficit of crop supplied by irrigation and the relative evapotranspiration.
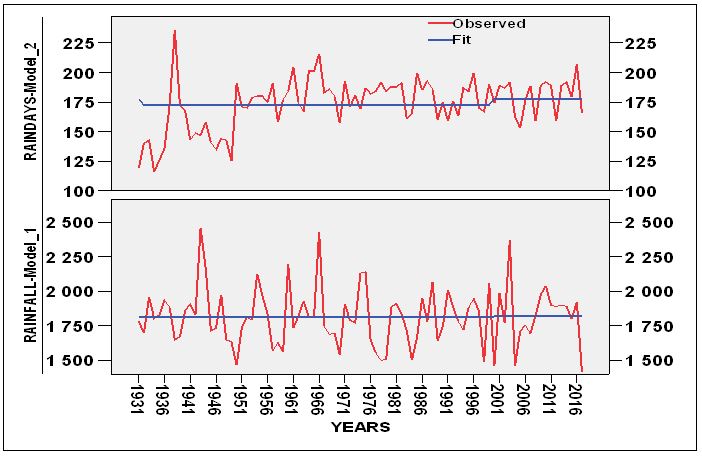
Based on Figure 3, the chronological month by month each year rainfall lineary trend decrease expressed by Y = − 0.0017X + 152.76, practically − 1.753 mm in 87 years, has been unsignificant following the stationary R-squared of 0.001 with Ljung-Box test at 0.169; while quadratic and cubic trends, respectively of Y = 3E − 05X2 – 0.029X + 157.24 and Y = 1E − 07X3 – 0.0001X2 + 0.0306X + 152.34 have defined the rainfall decrease of −1.556mm and −1.4448mm. The test of independance and stationarity of Wald – Wolfowitz shows in Figure 3 that there is unsignificant stationarity with p-value = 0.4386 at Z = − 0.77457 of annual rainfall from 1931 to 2017 in Yangambi. Consequently the trend test of Mann kendall is not significant with p-value = 0.4136 at Z = − 0.81757. The probable changing point of rainfall was unsignificantly detected by rupture decrease after 19 years, in 1950 and rupture increase after 70 years in 2001, with the Pettitt test at p-value = 0.494. The annual rainfall trend masques seasonal and monthly variabilities as shown with seasonality and non-stationarity test in the following point 3.2 (Figure 3).
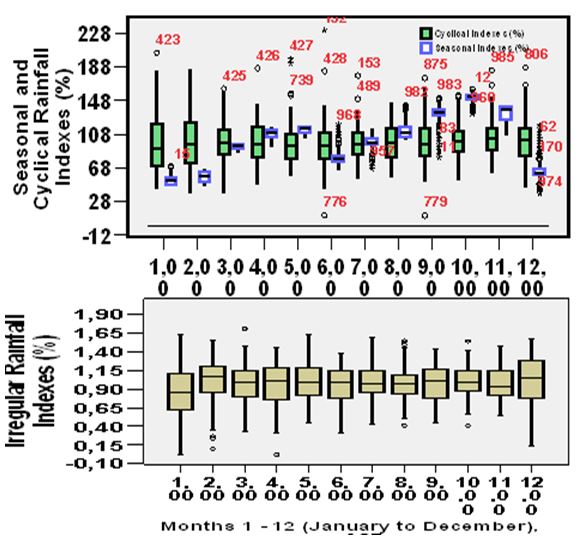
Monthly rainfall seasonal (blue), cyclical (green) and irregular (yellowish) indexes are presented on Figure 4. The coefficients of Kendall’s tau correlation between rainfall and seasonal, cyclical and irregular indexes were significant at 0.01 level of probability respectively with r = 0.450, 0.431 and 0.422, while seasonal indexes were high significantly correlated with only irregular indexes with r = 0.207. Also, the twelve month means of 87 years were significantly differents for each index at p-value = 0.000.
The seasonal rainfall indexes have presented the monthly mean of 100.0±31.01% situated between 34.496% in january and 161.62% in october with the CV of 31.01%. Chronologically, the occurrence of seasonal rainfall movements from 1931 to 2017 superior to 150% has been more pronounced in long dry season, seven times notably in december (1957 :150.61, 1959 :160.9, 1965 :149.84, 1990 :163.1, 1997 :187.37, 1999 :148.37 and 2002 :166.89%) ; january (1936 :167.13%, 1943 :155.88%, 1944 : 163.53%, 1960 :182.1, 1963 :149.57%, 1966 :205.07% and 1991 :151.67%) and february (1936 :154.84%, 1960 :153.66%, 1966 :183.39%, 1987 :150.59%, 1996 :170.55%, 1999 :169,91% and 2010 :153,23%). Then in long humid season were two times occurrencies in september (1960 :161.96% and 2003 :175.12%), october (1960 :152.62% and 2012 :154.37%) and november (1997 :166.37%, 1999 :150.86% and 2012 :184.33%). The occurrence has also been observed in short humid season in march (1966, 1981, 1996 and 1999), april (1966), may (1943, 1966, 1974, 1991 and 1992) and june (1943 and 1966).
Tested with Tukey HSD, the monthly rainfall indexes means significantly different were grouped, differently from the monthly rainfall means, in homogeneous subsets such as (april, may, june, august), (september, november), (october), (march, july), (january, february, december). Furthermore, the Figure 5 presents the polynomial curves of rainfall monthly seasonal indexes such as the soft descending quadratic trends have been observed on the months of may with amplitude (A) = -16.2%, april A = -3.38% and march A = -11.728% ; whereas the soft ascending quadratique trends characterised the months of january with A = +7.704%, february and november with A = +25.584%. The cubic trends of exponential climb have been observed in september with A = +61.248%, june with A = +43.32% and august with A = +14.328%; and the cubic trends of exponential descending on the months of december with A = -85.4%, july A = -46.608 % and october A = -35.408%.
Month intersections of observed in the Figure 5 from 1931 to 1940 and from 1990 to 2012 would indicate the origins of climatic disturbances or of the directional changes of trends. Thus, the symetric relations of convergence of trends of monthly seasonal indexes have been observed in closed horizontal bell shapes between the months of february and july, june and october, and september and october. The symetric relations of divergence in opened horizontal bell shapes have been observed between september and december, june and december, and june and july. The parallel trends of seasonal indexes having missed a reciprocal relation have been observed between descending may and march and descending october and july, while the ring was identified between november and august.
The chronological monthly seasonal rainfall movements from 1931 to 2017 presented on the Figure 5, have determined four rainy zones. The first eco-climatic zone (1) represented the long rain season of Yangambi region, composed from then of four months: august, september, october and november. It constituted the annual period of optimal active vegetation. Since 2003, the principal maximum of september at ISP 155% has remplaced october.
The second eco-climatic zone (2) represents the short rainy season with four months: march, april, may and june. After going down from 1931 with 90% to 1990 with 87 %, the month of june has suffered of a directional change in doubling the amplitude of this zone from 7 to 14 % where it twas exponentially inflexed at 110% (121 mm rainfall), leaving the short dry season to access to this zone.
The third eco-climatic zone (3), the short dry season is constituted by the exponential downing month of july with the index of 65% in year 2000, which becames the only month indecisively dry of the season representing the secondary eco-climatic depression with more than 100 mm (145 mm) rainfall. In sum, going from 2012, the zones (1), (2) and (3) are fusioned into one humid period
The fourth eco-climatic zone (4) represents the long dry season in Yangambi. From 2003, december with 143 mm, has the highest exponentiel decreased trend of rainfall seasonal index RSI downing from 60 to 35%, has represented the probability of driest month and has replaced the principal minimum rainfall depressions of january and february whose rainfall trends ascend in the same zone.
Chronological rainfall cyclical and irregular movements from 1931 to 2017are shown on Figure 4. The cyclycal rainfall movements (CM, in green) on Figure 4, have presented the monthly average of 99.53±26.16% between November and december having the highest average rate of 104 and 102% against June and january with 35 and 43%, respectively. Chronologically 11.68 in june and 231.29% in november have the extrems with the CV of 26.29%. The cyclical movements have in 87 years, identified 959/984 months which are superior to 100% having the deviation means of 2.126 months. The most important deviations between months have been observed in august 1939 at MC 103.24% with 18 months of deviation, august 1983 at 104.625% with 10 months, may 1949 at 101.55% with 11 months, november 2004 at 103.598% with 11 months and november 2006 at 100.535% with 8 months of deviation. The year 2000 had not month superior to 100% (Figure 4).
The number of consecutive months of cyclical movements superior to 100% have been observed from february 1938 to august 1939 with 18 successive months between the CM 102.64% and 103.24%, from may 1943 to september 1944 with 17 successive months between 106.01% and 231.29%, from july 1995 to april 1996 with 10 months between 103.37% and 170.55%, from may 2009 to october 2010 with 18 months between 106.02% and 153.23%, from january 1947 to july 1947 with 7 months between 121.27% and 140.8%, from december 1959 to june 1960 with 7 months between 101.64% and 182.1%, from july 1961 to january 1962 with 7 months between 102.11% and 134.84%, from december 1962 to august 1963 with 6 months between 104.40% and 149.57%, and from december 1965 to juy 1966 with 8 months from 134.3 to 205.07%.
Chronological rainfall irregularities shown on Figure 4 have presented at CV of 26.91% the monthly average means of 0.978±0.263% between 0.021 and 1.715%, from which extrems are dominated by the dry seasons notably the lowest irregularities registered in january (january 1984 with 0.03%, january 2010 with 0.045%), and the highest ones in december and february with 1.035 and 1.025%, respectively. The irregularities in humid seasons are concentrated between 1.2 and 0.6%.
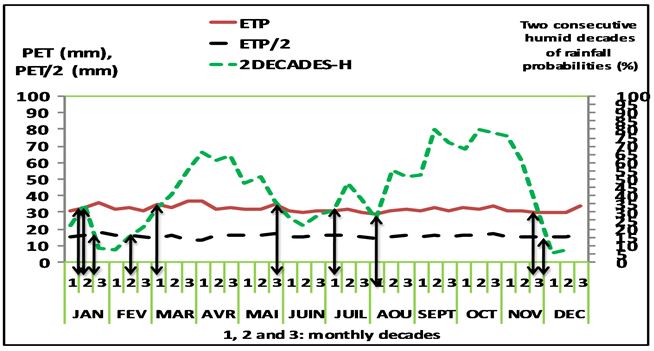
The Figure 6 shows the agro and eco-climatic events defined by projections on abscissa of the curve of probabilities of consecutive 2-humid decades of rainfall intersected with the curves of potential evapotranspiration PET et PET/2 observed from 1950 to 2017 in Yangambi. The figure shows that it rains every each ten daily period all the year where the minimal probability of rainfall is 5.4% in december and it could not be the first nor the last rain. The unique annual humid season has been fixed from march to november as active vegetative period with ten agricultural events defined in periods as followed :
• Soil cultivation period: 5-25 january
• Pre-humid periods : 25 january-15 march and 18 june-28 june
• Humid periods : 15 march-28 may and 28 june-7 december
• Very Humid period (optimal active vegetative period) : 2ème decade august -3ème decade november
• Post-humid periods : 28 may-13 june and 7 december-5 january
• Usable water reserve utilisation period: 7 december-25 january and 13 june-18 june
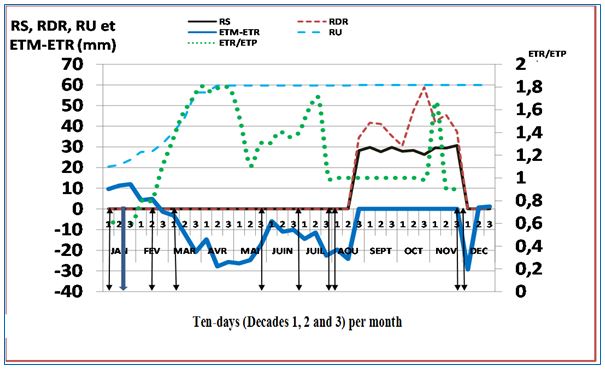
The Figure 7 presents the climatic water balance of Yangambi. Usable soil water reserve (RU) shows an exponential progression from the first decade of january with 20.54 mm to the third decade of december with 60.00 mm. But january decades evaporation deficits (MET-RET) are the highest with 9.57mm, 11.33mm and 11.96mm which can be supplied by irrigation, followed by decades 1 and 2 of february 4.19mm and 4.9mm, respectively ; while the lowest are in decades 2 and 3 of december with 0.64mm and 1.11mm. From decade 1 of january to decade 2 of february, RET/PET is the lowest inferior to 0.5mm, where RET
Concerning the short cultural season from the third decade of march to the second decade of may where R>PET, RET>PET, the dry matter production index (RET/PET) has been annually the highest with 1.7-1.8. The RU is also the highest with 59.78 mm. However, the season is adapted to short duration cycle crop inferior to 90 days.
Very humid period (figures 6 and 7) represents the sustainable optimal active vegetative period from the second decade of august to the third decade of november. The period contains the cumulative unique annual water quantity of runoff and drainage (WRD) of 414.42mm/year that could infiltrate plateau Y1 and valleys AT soil series; but could be erosive on sloping soils series Y2 and Y3 of Yangambi [18]. The highest values of 47.35 mm and 58.80 mm were registered respectively in october decades 2 and 3. In this period, the dry matter production index (RET/PET) is 1 where RET equalises PET, MET equalises RET, but decade 1 of november has highly reached 1.64. This is the only period that stocks soil water (RS, residual soil water) varying from 27.63mm to 30.73mm with the evapotrapiration deficit nul and the water use reserve of 70 mm. On the other hand, RS and WDR are nul from january to the second decade of august.
Monthly rain (R) and potential evapotranspiration (PET) quantities well distributed (R/PET = agroclimatic rainfall index, ARI), PET/Real ET, Maximum ET-RET), Growth Degree Days and sunshine have satisfied the needs of annual and perenial crops and forest trees in Yangambi [11].
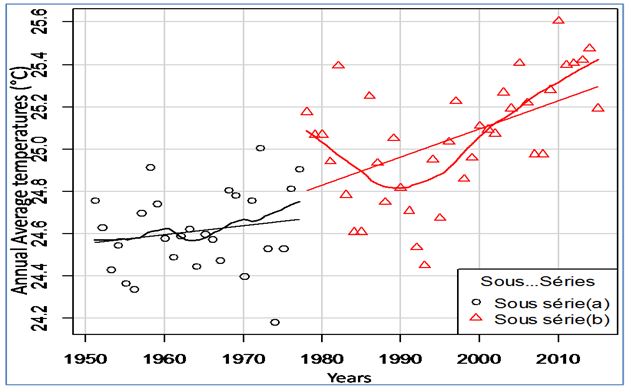
The Figure 3 showed unsignificant ruptures of rains stationary R-squared at 0.009 with the Ljung-Box Q (18) test of 0.130 after 19 and 70 years, while furthermore on Figure 8, the annual average temperatures from 1951 to 2017 in Yangambi, were signicantly tested at p-value = 4.203e-06 with the standardized coefficient Z=4.6011of non stationnarity of Wald-Wolfowitz. The trend test of Mann-Kendall was significant with p-value =1.153e-10 at Z=6.4453, detecting significantly the rupture point of the average temperature series at p-value= 3.976e-06 after 26 years, in 1977.
The rupture would be attributed to the begining of economic crises and demographic pressure in DR Congo enhancing deforestation and warmest decades of 1981-1990 and 1991-2000 in Yangambi, manifested in increases of maxima temperatures from 29 to 30.9°, minima temperatures from 19 to 21.32 °C and average temperatures from 24.5 °C to 24.88 °C, which would affecte monthly or seasonal rainfall and potential evopotranspiration in Yangambi [14].
The significant temperatures increase defined by its annual rupture in 1977, has characterised inter-seasonal rainfall seasonal indexes trends disturbances since year 2000 (Figure 5). Positive trends of rainfall, rainfall day number and relative air humidity, have defined the new natural juxtaposition of two humid seasons, the first of april, may, juin, and the second of august, september and november to form an unique annual active vegetative period from march to november with its optimal phase from august to november. Negative rainfall trends pronounced in december, january, february have determined the unique dry season with the superiority of PET on rainfall seen in the Figure 6, enhanced by the increases of maxima temperatures at 31.9 °C and sunshine of 2020 hours [14]. This period would be propice for harvesting and drying crop products, and practicing soil land cultivations and irrigation.
The rainfall irregularities observed in dry seasons would come from intempestive winds mostly in december, and would be related to the dry season of northern hemisphere stronger than that of southern hemisphere due to the equilibrum of oscillations of oceanic temperatures between north atlantique and south atlantique from global warming [19]. Added to vegetal disturbances by agriculture and the global hit, the irregularities could be less significant to climatic disturbances in Yangambi [20,21].
Observations on climatic disturbances done in Yangambi would be complet and pragmatic when one elucidates more on :
• Making available climatic new disturbance trends information to users.
• Evaluating the water balance for each of the mean four soil series of the catena of Yangambi
• Studying the agro economic impact of climatic disturbances on soil fertility of Yangambi.
• Studying the Yangambi biosphere reserve credit impact on global hit by mesuring :
➢ Above ground CO2 sequastration system in the forest and vegetation system;
➢ Under ground (soil) CO2 sequastration system;
➢ Effect of pedo-forest management systems,
➢ Aquifers tampon effects on soil surface drougth
➢ Water surface evaporation of the intensely ramified hydrographic reseau of Yangambi region.
Has climate changed in Yangambi? Chronological monthly rainfall study from 1931 to 2017 has determined seasonal indexes trends disturbances since 1990 resulting in one active vegetative period from march to november with its well distributed rainfall sustainable optimal phase from august to november, and in one dry season from december to february. But, the bimodal rainfall regime of humid and warm equatorial climate following Köppen has persisted in Yangambi as described by Bernard and Bultot [1,3,9].
For the agricultural control against climatic disturbances, probable sowing commencements are dated on from the third decade of march for less water demanding crops of less than 90 days vegetative cycle and the second decade of august for all crops and forest trees [10]. For, even as annual rains have dimunished by -1,769 mm, the annual average of 1822 mm at CV inferior to 12% with the normal of 1780 mm, is superior to annual water needs for tropical crops, fallowing and reforestation [15].