Assessment of Waste Generation and Sanitation Strategies for Sustainable Environmental Management in Akungba-Akoko, Nigeria
The manuscript assessed waste generation and sanitation strategies with a view to establish quality sanitation control for sustainable environmental management in the study area through questionnaire and secondary data using the methods of systematic random sampling technique and descriptive analysis. The study established that despite the efforts in reducing waste and its associated problems in the study area, increased population (30.4%) contributes highly to continuous waste generation with tendency of high flooding occurrence (24%). Also, the calculated R value (0.393) indicates that there is existing relationship among the waste parameters and the observed influence within the environment. This shows that improper waste disposal would lead to continuous reduction in environmental quality inform of disease outbreak, flooding and pollution. The study therefore suggests that government should introduce environmental sanitation task force for effective supervision of the environmental sanitation exercise.
Keywords: Waste; Environment; Disposal; Flooding
As the human population increases, the quantity of solid waste generation increases worldwide. The quantity of solid waste generation in various countries of the world depends largely on the population, socio economic status of the citizens and kinds of commercial activities being predominant [1]. Research has shown that the quantity of solid waste generated on the earth surface today is far greater than the one in the past years across the world, especially in most of African countries.
For example, in a country like Ghana, Boadi and Kuitunene conclude that waste management has been a difficult issue that extend from the state to the local municipalities, and refuse of all shapes and sizes is a common site in both urban and rural areas [2]. These difficulties are concentrated and complicated by population pressures in the few heavily populated cities of which Accra is the most prominent. Inequality features heavily in the capital. It was further observed that 80 % of the city population are low income earners and live in high density population areas. The middle class is occupied by 17% of the population. Only 3% of Accra lives in high income, low density residential areas. The sanitary infrastructure of Accra is reflective of the income divisions. Only 30% of all houses have toilets that actually flush, while only 1 in every 5 houses has functioning indoor plumbing. The public latrines that have been built to accommodate these disparities are overused and often shared by 10 or more people.
Mabogunje has described the situation of Nigeria environment as “filth and squalor” [3]. This is because there is lack of proper collection and disposal of sewage, liquid and solid waste which constitutes to a major public health issue and vital factor affecting the quality of an ideal environment. Heaps of refuse and garbage are commonly sighted in urban centers of the country together with a host of other ill that plague her cities.
Indeed, Nigerian Government has made huge effort to overcome littered environment. For instance, the state government of Ondo, where the study falls, is saddled with the responsibility of waste management through “Environmental Sanitation Authority and State Waste Disposal Board”. Despite such effort by the government to solve the problems of waste collection and disposal, there is little to show that tangible result has been achieved.
This study, however, considers implications of littered materials on human environment with a view to establish effective waste generation and sanitation strategies for sustainable development. This study would help in policy formulation on waste management in the developing countries. Proper management of wastes is capable of averting the nuisance and its disastrous effect on the inhabitant.
Akungba-Akoko is found in Akoko South West Local Government Area of Ondo state, Nigeria. It is one of the educational institution towns at a distance of 56km away from Akure the capital of Ondo state. This study location is situated between latitude 7028’ and 7030’N of the equator and longitudes 5044’ and 500’E of Greenwich meridian. It is bounded by Ikare-Akoko to the north, Etioro-Akoko to the south, while to the east and west by Supare-Akoko and Iwaro-Akoko respectively (Figure 1).
The climate of the study area is equatorial with two peaks of rainfall and a dry season. The two peaks of rainfall made up the wet season in the study area. The first peak comes up between April and July while the second peak falls between late August and October. These two peaks are marked by heavy rainfall with the mean annual rainfall of 1500-2000 mm. The dry season is between November to March. Akungba-Akoko relative humidity varies from 75-95% and this result into severe cold condition in most cases. As observed by Duze and Ojo in the mean annual temperature of the study area is 23-26 °C [4].
The people in Akungba-Akoko engage in traditional activities which include farming, weaving, petty and trading. The major occupation of the indigenes is farming. Food crops like yam, cassava, potatoes, maize and vegetables are grown for local consumption and sales at the various marketing systems. Akungba has two major markets known as Ibaka market and Okusa. Both markets are rural periodic day markets. The study area is the host community of Adekunle Ajasin University. The other prominent industry in the study area is block making industries. According to the National Population Commission (2006), the population of Akungba Akoko is 15,579 [5].
According to Afolabi (2005), waste accumulated in such large heaps along some street that it impedes pedestrian and vehicular traffic most especially in the neighborhoods of markets [6]. Refuse heaps also block gutters and other drainage channels thereby perpetuating flooding during rain storms. This indisposed refuse gives rise to offensive odor and stench which is furious to human health. The uncollected refuse accumulates in drain, roads and open spaces, causing disruption of community life and creating additional problems in the operation of the other public services. Waste can cause serious and long term pollution of land, air and water. Large areas of land have been spotted by careless dumping of waste and soils on many sites have been made unstable and toxic by the careless deposition of waste.
According to Daniel, et al. geo-technical practice for waste disposal to maintain balance hygienic balance in our society [7]. For example, various methods of disposing waste have been highlighted; Land Fill: This is the most common and probably account for more than 80 percent of the nation’s municipal refuse. It is the most effective method of disposal, with collection and transportation accounting for 75 percent of the total lost.
Refuse is also burned in incinerators; it is more expensive but a safe method of disposal than landfills. Modern incinerators have poisoned air, soil, and water. Communities near incinerators have objected to them because of fears about possible emissions. Organic materials that have little or no heavy metals can be detoxicated biologically. Composing and land farming in which materials are spread out over a large land area so that microbes can decompose them are examples of biological treatment of hazardous waste. If the materials are not detoxicated before they percolate into the ground water, obvious repercussion may occur. The practice of recycling waste is an old one, metal implement were melting down and recast in pre historic times. Today, recyclable materials are recovered from municipal refuse by a number of methods, including shredding, magnetic separation of metals, screening, and washing compositing which includes preparing refuse and breakdown of organic matter by aerobic micro- organisms, those who generate solid waste to keep recyclable items separate them from other waste.
Oluwande shows a higher percentage of organic waste in the traditional (indigenous) core area of Ibadan city with vegetable matter leaves accounting for 81 percent of all the refuse than in the Government Reserved Areas (GRA), where highly classed people live [8]. Waste like plastics, tins, metals, bottles and glasses with other miscellaneous goods characterized the GRA. According to him, refuse disposal is the expression used to describe the unit process adopted to ensure that the refuse is not nuisance misname in human environment.
Academicians, government officials and journalists have written in the spatial setting of environmental sanitation and the problem of waste disposal in Nigerian communities and world over the concept of waste which has been a vital issue that should be opened up for discussion, every aspect of waste that includes the source of waste, waste collection and disposal, the cost structure of undertaking waste management programmes.
According to Akintola, he says that the problem of waste is the creation of atmosphere that encourages the public to use the depots and minimized the disposal of waste in streets, street channels and open drains [9]. He advanced that the incapability of the waste disposal board to handle the waste generated due to lack of vehicle or that the one available have broken down with more vehicles on the road and more capable personnel; he hopes that the accumulated waste could be cleared away totally.
According to Malombe, irregular services rendered to producers of refuse by municipal councils compel them to find ways of disposing of refuse [10]. He observed that the main methods adopted by the producers are burning, composting, or indiscriminate dumping. This is very pertinent in the study area where waste management services are largely inefficient and ineffective.
As noted by Benneh, et al., it is estimated that a larger percentage of the population dump their refuse in either authorized or unauthorized sites in their neighborhoods, and due to weak capacity to handle solid waste, unsanitary conditions are created [11]. It is further observed that residential domestic waste forms the bulk of all sources of solid waste produced in all areas. The household wastes are known to have high densities with high moisture content and the organic component of solid waste, which properly account for a great percentage, while tins, cans, and paper takes the other percentage. They further argued that inefficient communal facilities can lead to open defecation along beaches, drains and open spaces and the tendency for fecal materials to become intermixed with household refuse.
To the problems of disposal of waste, where depots, drums and dust bins are provided, he noted that these waste found in gutters, stream channels and open surfaces has been spread by wind or washed down by run- off with streams channel and other depressions. He explained that most depots are not cleared and these gives room for deliberate littering of the depots and environment by the disposers.
Several factors are responsible for influencing the quantity of waste generation in any given area. The quantity of solid waste generation increases as a result of changes that take place in the environment where man is in control. Man is the greatest generator of solid waste in the environment on the earth surface.
Ogbonna, et al. mentioned a number of factors that influence the quantity of solid waste generation in Nigeria to include lack of advanced technology and facilities for separation at the source, strength of solid waste management policy and enforcement, environmental education and awareness, income status of the individual, among others [12]. These factors determine the quantity and even the rate of solid waste generation in the area [12].
Similarly, Sridhar and Adeoye, stated that the quantity of solid waste generation in various states of Nigeria depends on population, socio economic status of the cities and kinds of commercial activities being predominant. He says population is the greatest determining of solid waste generation in any part of the world [1].
Adewumi, et al. agree with the view of Sridhar and Adeoye which says population is the most determining factor of solid waste generation [1,13]. They add that, Nigeria having the population of 120 million people generates 0.58kg per person per day. They further give the breakdown of solid waste generates by some cities in Nigeria to include: Abeokuta in Ogun states generates 0.60kg/person/ days, Ado Ekiti in Ekiti 0.71kg/person/day, Akure in Ondo state generates 0.71kg/person/day, Ile Ife in Osun state generates 0.46kg/person/day, Ibadan in Oyo state 0.74kg/person/day. Also, about 55200kk/person/day of solid waste were estimated to be generated in the traditional city in Oyo state.
According to Onibokun and Kumuyi, cities in Nigeria, being among the fast growing cities in the world all faced with the problem of solid waste generation [14]. The implication is serious when a country is growing rapidly and the wastes are not efficiently managed.
Geoffrey maintained that, “of the different categories of waste being generated, solid waste had posed a hydra-head problem beyond the scope of various waste management systems in Nigeria as the streets experience continual presence of waste from commercial activities [15].
Abel agrees with the view of Ogbonna, et al. and makes it peculiar that education, income and social status are the important factors influencing per- capital waste generation in Ogbomosho, Oyo state [11,16]. The study has deduced that, the quantities of solid waste in most parts of the world are dependent on the type of activities practiced by the inhabitant of the place. These activities include food production, timber harvesting, trading, and farming, among others. Each of these activities produces by-products in the solid form which can be termed solid waste. Some of the solid wastes are biodegradable (decay with the aid of decaying organism) while others are non-degradable (cannot decay). Degradable solid waste influences the environment both positively and negatively.
Data were collected from both primary and secondary sources. Primary data were obtained through the use of questionnaire. The questions were divided into three sections which include socio – economic status of the respondents, waste materials generated and method of waste disposal, and effect of waste materials, and waste management strategies employed in the study area. However, secondary data were sourced from relevant documents of waste disposal and management. Systematic random sampling technique was adopted for data collection through which, every 10th houses was selected. Twenty-Five (25) copies of questionnaire were administered in each of the five (5) quarters of the study area. In all, a total of 125 questionnaires were distributed and used in the course of this study. Both descriptive and inferential statistics were employed. Descriptive analysis includes simple percentages; while regression analysis was used to establish significant relationship between the waste parameters and effects in the study area. Simple tabulation was employed for the presentation of results.
The study revealed highest response of 54% from female respondents in the study area (Table 1). This further explained 8% difference from the response received from the male. The observed scenario established the facts that female are the major subjects who are regularly engaged in trading activities. Among the respondents, it was equally observed that highest percentage of 42 was recorded between ages 18 to 30 years. This indicates that majority of the respondents are from maturity circle whose responses are with some level of reliability.
In view of the current trend of employment saga in Nigeria, most of the respondents were unemployed, though engaged in self-employment. The study revealed that 58% the sampled population in the study area are fully engaged in self-reliance. This is more so in terms of various petty trading through which they earn daily living. Despite the fact that majority of the people involved in this study are with higher educational qualification of tertiary institution, still the menace of indiscriminate waste disposal is evident in the area. It was gathered that 49% of the highest tertiary education is a function of the environment being an academic environment. The educational situation as observed in this study has assisted in accurate and knowledge based response to questionnaire.
There are seven (7) types of wastes identified in the study area, which include food wastes, plastics materials, paper and its product, cellophane materials, glass and bottles, vegetables and metal/irons (Table 2). The percentage of these waste materials are identified as follow; food wastes (24), plastics materials (19), paper and its product (17), cellophane materials (14), glass and bottles (11), vegetative materials (10) and metal bin (5).
This observation revealed that food waste contributes the highest percentage of waste materials in this area. The wastes generated from left over in different market locations often increase level of waste in the study area. To this, Benneh, et al. noted that residential domestic waste forms the bulk of all sources of solid waste produced in all areas [11].
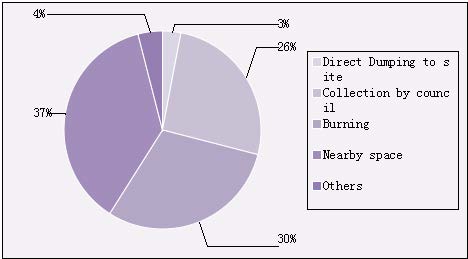
The major identified method of waste disposal include dumping refuse in surrounding bushes, gutter, sewage, vacant plot of land, direct burning of wastes, and house to house collection by the local government council. This study, however, revealed that dumping refuse at any available open space formed a common practice in the study area. This is because of the highest percentage of 37 recorded for this indiscriminate waste disposal in the area (Figure 2). Though, 30% response was got from people, which revealed burning of refuse as the second highest option for waste management in the study area. Any waste that is indiscriminately disposed was believed to be easily washed away by overland flow. This action, in many cases, has resulted blockage of drainage system and thereby cause flooding.
This study is in firm agreement with the work of Malombe, who submitted that irregular services rendered to producers of waste by municipal councils compel them to find ways of disposing of refuse [10]. He observes that the main methods adopted by the producers are burning, composting or indiscriminate dumping. Also, Benneh, et al. (1993) estimated that a larger percentage of the population dump their refuse in an authorized or unauthorized sites in their neighborhood due to weak capacity to handle waste, which results into unsanitary environmental conditions [11].
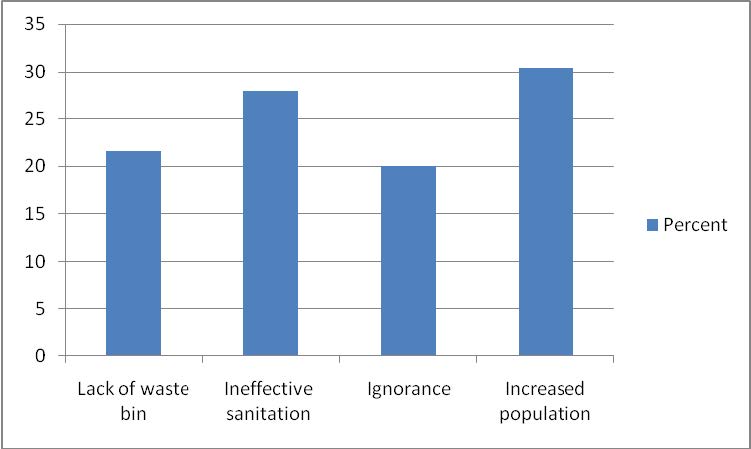
Indiscriminate waste disposal is one of major problems inhibiting sound environmental condition of the study area. For instance, there are certain observed factors responsible for this inappropriate disposal of waste in this area, which include lack of waste bin, ineffective sanitation practice, ignorance of waste impact, and increased population.
Residential waste bin is a first-hand-container kept in an accessible range within or outside a building where domestic wastes are being dislodged. The study observed in Figure 3 that 21.6% of the residents lack this basic waste container in their various homes, which is responsible for improper disposal of waste in the area. In relation to this finding, Benneh, et al. (1993) established that because the capacity to handle all the household waste generally is weak, larger percentage of the population dump refuse in either authorized or unauthorized sites in their neighborhood which creates unsanitary condition [10].
Sanitation monitoring agency is saddled with the responsibility of ensuring effective disposal of wastes from time to time by the residents. This study, however, observed that 28% response was given by the respondents to indicate ineffectiveness of sanitation monitoring practice in the study area. This sanitation monitoring practice is saddled by the responsibility of government agencies and private organizations. In relation to this finding, Asamoah revealed that lack of adequate sanitary facilities results in indiscriminate dumping of refuse and defecation at places not designated for such purposes [17]. He suggested that big containers should be provided at specific intervals and ensures the proper usage of the containers by the residents.
It is obvious that there are noticeable levels of ignorance among the people about the effect of the indiscriminate waste disposal. It was observed that 20% response was given to indicate level of the ignorance among the people. To this, Abrokwah observed that ignorance, negligence, lack of law to punish sanitary offenders and low level of technology in waste management are the major causes of waste management problems [18]. He suggested that awareness should be created among residents to manage household refuse and educate them on hazards that ill-disposed waste could pose to the environment.
Increased population is observed as the leading factor among others that induce indiscriminate waste disposal in the study area. For instance, 30.4% response indicates highest percentage impact of this factor on waste generation. This is more so when considering increase population visa-vis the consumption level of people that necessitate continuous generation of food waste per time. Afroz, et al. submitted that rapid increase in the population and improvements in the quality of life, have aggravated the problem of waste generation [19]. Therefore, municipal authorities will require huge capital investments and operational strategies for collection, transportation and disposal of waste. Similarly, Sridher and Adeoye stated that the quantity of waste generation in various places depends on population [1]. He argued further that population is the greatest determining factor of solid waste generation in any part of the world.
The study observed traffic congestion, increased mosquitoes, flooding, fire hazard, disease outbreak, and source of nuisance in the environment. Table 3indicates 24% impact of waste as one of the major causes of flooding in the study area. Other impact that include traffic congestion (14%), breeding space for mosquitoes (21%), fire hazard (11%), diseases (8%), and environmental odor (22%). This result implies that most of the available drainage systems are being blocked by wastes and consequently hinders free flow of run-off. This situation, in most cases has led to flooding that claimed live and properties in the study area.
Apart from flooding occurrence, much more is the pollution impact of the indiscriminate waste disposal. The injection of nuisance that most times turns bad odor has affected this environment badly. This is evident in the percentage of responses (22%) given by the people in the study area, who disclosed that wastes that not adequately managed often times resulted into irritation. This finding has also been observed in the work of Michael, who argued that refuse and sewage cause pollution to the environment by producing offensive odor to the environment when they decay [20]. He further explains that it also affects drainage, when solid wastes are dumped in drainage channels in gutters; they block the flow of water leading to flooding. He maintained that sewage as a product of solid waste serves as a breeding ground for pathogens which causes diseases to human and even death. Not only this, refuse that heaps up can block gutter and other drainage channels thereby perpetuating flooding during rain storm.
The examined waste types necessitated the application of regression model in order to achieve the level of influence it has on the study area. In this wise, the independent variables such as the types of generated and the dependent variable that include various effects of wastes on the environment were subjected to statistical tests.
The waste parameters and effects were grouped as dependent (Variable 2) and independent (variable 1) while the coded values were calculated with regression analysis (Table 4). The decision rule states that reject H0 if Fc > Fα at V1V2 of 95% confidence level. The above statement shows that the calculated F value of 0.44 is significant at P= 0.05 (Table 5). This established that the waste parameters have significant influence on the observed effects within the environment. The R value (0.393) indicates the level of the existing relationship among the waste parameters and its impacts. This result implies that the waste parameters under consideration are some of the major factors of the environmental problems in this area. The improper waste disposal would lead to reduction in environmental quality of the study area. The correlation coefficient of 0.15 signifies that different waste types identified have 15% influence on the entire area while the remaining 85% could be attributed to other factors of environmental problem within this area. The study has established that increased level of indiscriminate waste disposal would impede development and further degenerate the entire area.
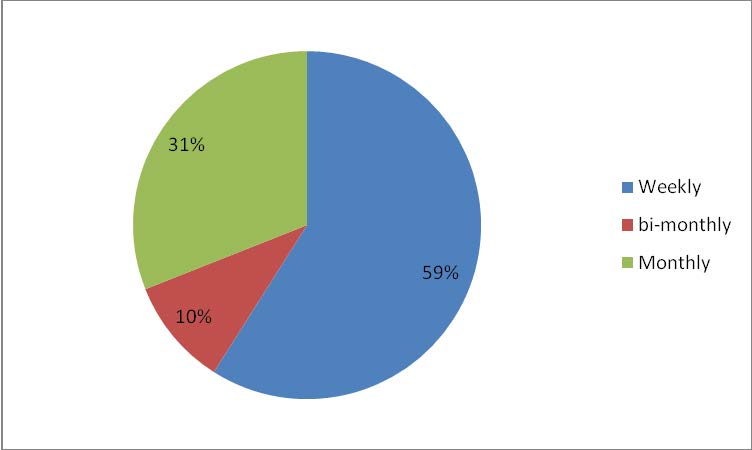
Following the identified environmental problems through indiscriminate waste disposal in this area, major efforts that are put in place to avert its continuity include waste collection system and dump site burning. The waste collection system is scheduled based on periodic interval when wastes are to be collected by the waste management agency. The intervals of collection periods are structured on weekly, bi-monthly, and monthly basis. Figure 4 revealed weekly collection with 59% of highest response. This weekly waste collection is unconnected from periodic local market days that come up on every interval of fifth day. Refuse collection usually occurs at least once per week because of the rapid decomposition of food waste generated by the traders during the market period.
Collection of wastes is majorly the responsibility of both community members and the government body. The 48% response recorded in Table 6 indicates the combined effort of the community and the government to get rid of waste from the environment. This study essentially established that removal of waste is basically the function of all, as the community and the local government understand this concept and therefore they both work hand in hand to ensure sanitation in the environment. Benneh, et al. in his work argued that inefficient communal facility can lead to open defecation along beaches, drains and open space and the tendency for fecal material to become intermixed with household refuse [11].
This study assessed waste generation and quality sanitation control with a view to establish sustainable environmental management in the study area. In view of the efforts in reducing waste and its associated effects in the environment through periodic waste collection system, the study observed that increased population induces indiscriminate disposal of wastes. This is more so when people do not understand the effect of their action on an environment that often lead to disease outbreak, flooding and pollution. Following the consequences of the inadequate waste management in the study area, it is therefore essential that government should introduce environmental sanitation task force who will be responsible for effective supervision of the environmental sanitation exercise. This will help in maintaining healthy environment through time to time cleanness and proper strategy for waste management.

.jpg)
.jpg)