C-Reactive Protein as a Diagnostic Marker for Gangrenous Cholecystitis
Background: This retrospective cohort study evaluates the pre-operative C-reactive protein (CRP) levels in patients undergoing emergency cholecystectomy, to assess its diagnostic utility in differentiating patients with gangrenous or non-gangrenous cholecystitis.
Method: A retrospective review was conducted of patients who underwent emergency cholecystectomy for cholecystitis and had a pre-operative CRP value documented from August 2013 to February 2018. Patient characteristics, pre-operative white cell counts (WCC), CRP values and histopathology results (used to ascertain diagnosis) were recorded. Mean WCC (x109/L) and median CRP values (mg/L) were compared between groups and the discriminatory ability of WCC and CRP to classify patients with gangrenous cholecystitis (GC) was assessed using receiver operator curve analyses (ROC).
Results: The study population comprised 55 patients, of whom 18 (33%) had GC. Median CRP values were significantly higher in patients with GC [242; Interquartile Range (IQR): 172-307] compared to patients without GC (38; IQR: 6-74; p=0.009). Mean WCC were also significantly higher in patients with GC (p-value <0.001).
Upon ROC analyses CRP displayed superior discriminatory ability in classifying patients with GC [Area under the curve (AUC): 0.94; 95% CI: 0.89-1.0] compared to WCC (AUC: 0.74; 95% CI: 0.61-0.88). The optimal cut-points for classifying patients with GC in the study were 12.45 for WCC and 123 for CRP.
Conclusion: The study provides evidence that median CRP levels were higher in patients with GC and CRP may perform better than WCC in discriminating between patients with gangrenous versus non-gangrenous cholecystitis.
Keywords: Acute Cholecystitis; Laparoscopic Cholecystectomy; CRP; Gangrenous Cholecystitis
Gangrenous cholecystitis is an uncommon yet significant variant of acute cholecystitis that is present in 2-20% of patients with acute cholecystitis [1]. Unlike uncomplicated acute cholecystitis which can be successfully managed with conservative therapy in 80% of the cases [2]. Gangrenous cholecystitis is associated with gallbladder perforation, fistula formation, intra-abdominal abscess and generalised peritonitis. It has a mortality rate of up to 50% and requires timely cholecystectomy [3].
Clinically, it can be difficult to differentiate gangrenous cholecystitis from uncomplicated acute cholecystitis, Murphy’s sign may also be absent due to denervation of the necrotic gallbladder wall [4]. Imaging findings may also be non-specific, such as the sonographic findings of asymmetrical gallbladder wall thickness or focal perfusion defects [5]. On CT scans, gangrenous cholecystitis may demonstrate features of luminal or intramural gas, lack of mural enhancement, or wall irregularity [6]. Increased age, male gender, the presence of cardiovascular disease and diabetes mellitus as well as delayed treatment is risk factors for the development of gangrenous cholecystitis [7]. High white cell counts (WCC) and increased bilirubin levels have been shown to be associated with gangrenous cholecystitis with recent studies showing its correlation with high C-Reactive Protein (CRP) values [8,9].
To prevent potential fatal sequalae of gangrenous cholecystitis, particularly in elderly patients with low cardiovascular reserve, timely decision-making regarding management options is crucial. A high index of suspicion in conjunction with appropriate investigation is therefore required. A retrospective review was performed to assess the utility of CRP in aiding the diagnosis of gangrenous cholecystitis, to ascertain its role in differentiating patients who require early surgical intervention from those that can be managed conservatively with antibiotics and delayed laparoscopic cholecystectomy.
A retrospective chart audit was conducted of patients who underwent emergency cholecystectomy for cholecystitis at Caboolture Hospital, an outer metropolitan hospital in Queensland, Australia, from August 2013 to February 2018 and who had pre-operative measurements of WCC and CRP. WCC and CRP were measured within the 48-hour period prior to surgery. Where patients had two recorded values during the timeframe, the highest value was used. Cholecystitis was classified as gangrenous based on histopathology results from excised tissue. Other potential risk factors including age, gender, cardiac history (including ischemic heart disease, atrial fibrillation and valvular disorder) and presence of diabetes mellitus were also assessed. In this review, we have excluded patients with concurrent gallstone pancreatitis and patients with a documented secondary source of infection including skin infections, pneumonia or urinary tract infections.
Continuous variables which were approximately normally distributed were summarised using means (standard deviation) and compared between groups using Student’s t-test. Variables with a skewed distribution were described using medians (interquartile range) and compared between groupsusing Wilcoxon’s rank-sum test. Categorical variables were described using frequencies (percentages) and compared between groups using Fisher’s exact test. A total of 55 patients were included in the study, of which 26 (47%) were male. The mean age was 54 (SD: 19) years. 7 patients (13%) had a diagnosis of Type 2 Diabetes Mellitus and 7 patients (13%) had cardiac risk factors (Table 1). The discriminatory ability of WCC and CRP to classify patients with gangrenous cholecystitis was assessed using Receiver Operator Curve (ROC) analyses. The optimal cut-point was determined from Youden’s index, which maximises the sum of the sensitivity and specificity. Analyses were performed using the Stata statistical software package (version 15) [10].
The study population comprised 55 patients, of whom 18 (33%) had gangrenous cholecystitis. The distributions of variables of interest by whether or not the patient had gangrenous cholecystitis are shown in Table 1. The mean age of patients with gangrenous cholecystitis (69 years) was significantly higher compared to patients without (47 years). Overall, 26 (47%) were male, with males comprising 78% of those with gangrenous cholecystitis. Mean WCC (15 vs. 11 p-value 0.009) and median CRP (241.5 vs. 38 p-value<0.001) were significantly higher in patients with gangrenous cholecystitis compared to patients with non-gangrenous cholecystitis (Table 1). Overall, 7 (13%) had cardiac risk factors, with 33% of those with gangrenous cholecystitis having cardiac risk factors; 7 patients (13%) had Type 2 Diabetes Mellitus with 3 (17%) in the GC group.
The results of ROC analyses comparing the utility of WCC and CRP in classifying patients with gangrenous cholecystitis are shown in Table 2. The area under the ROC curve (AUC) for CRP was 0.94 (95% CI 0.89-1.0) compared to 0.74 (95% CI 0.61-0.88) for WCC, indicating superior discriminatory ability for CRP. The optimal cut-point for CRP was 123 mg/L, at which Youden’s index was 0.84, sensitivity was 94% and specificity was 89%. This compares to an optimal cut-point for WCC of 12.45 x10⁹/L when Youden’s index was 0.48, sensitivity was 78% and specificity was 70%. At the cut-point of 123 for CRP, the positive and negative predictive values are 82% and 89% respectively.
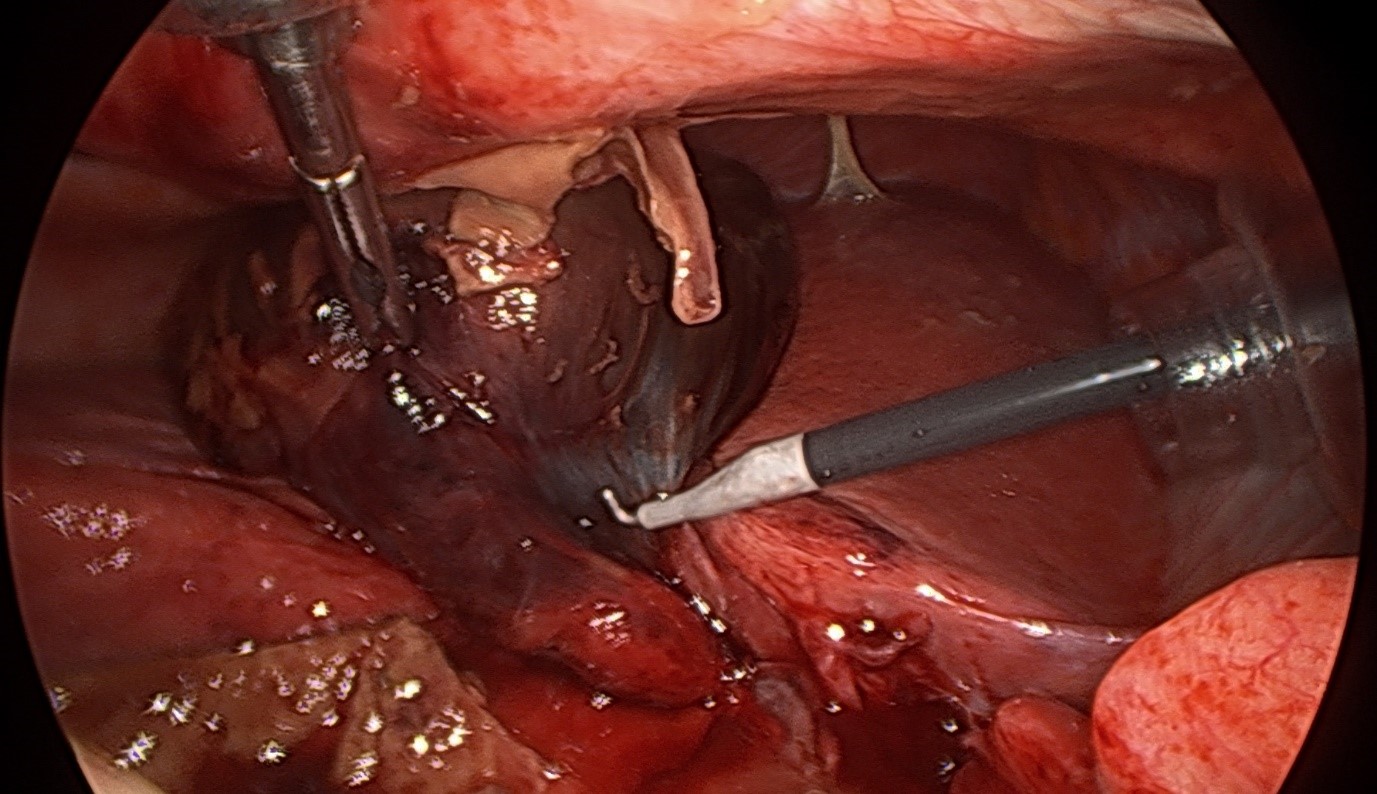
The aetiology of gangrenous cholecystitis is a result of vascular compromise secondary to persistent obstruction of the cystic duct. This leads to epithelial injury and increased wall tension as well the associated inflammatory response [9]. White blood cells and C-reactive protein are both markers of inflammation and are useful in the detection of non-specific systemic infection or inflammation. Studies suggest both white cell count and CRP values are reliable adjuncts in the diagnosis and prognostication of sepsis with CRP showing superiority [11]. Particularly in the case of CRP, as an acute phase protein, the rate of secretion increases with inflammation and a significantly elevated level may therefore aid the diagnosis of a severe inflammatory condition such as gangrenous cholecystitis [12] (Figure 1).
In this study, we observed that patients with gangrenous cholecystitis were on average older and more likely to be male, which is an interesting contrast to the increased prevalence of cholelithiasis in females in the general population [13,14]. It has also been proposed the pathogenesis of gangrenous cholecystitis is due to microvascular disease of the cystic artery, making cardiovascular disease and diabetes mellitus risk factors [15]. In our study, we noted 33% of the patients with gangrenous cholecystitis had cardiac risk factors as opposed to only 3% in the non-gangrenous cholecystitis group. However, only 13% had diabetes mellitus, resulting in low power. Our results are consistent with those reported in a study performed by Önder, et al. in which 24.3% of cases with cardiovascular disease and 19.6% of cases with diabetes mellitus in the gangrenous cholecystitis group [1]. The differences in the demographics raise the suspicion that gangrenous cholecystitis may be a different disease process to its non-gangrenous counterpart.
The mean WCC and median CRP levels are also significantly higher in patients with gangrenous cholecystitis., In our study, the optimal cut-points for classifying patients with gangrenous cholecystitis was 12.45 and 123 for WCC and CRP respectively. The results of ROC analysis showed a superior discriminatory ability of CRP in classifying gangrenous cholecystitis. Studies of similar design reported variable cut points of WCC between 15- 17 to be predictive of gangrenous cholecystitis [15-17]. In terms of CRP, studies noted cut-points of 94, 134 and 200 [16,18,19]. A study by Kabul Gurbulak, et al. also concluded that CRP can be accepted as a strong predictor in classifying the severity of acute cholecystitis [20].
The optimal cut-point generated from this study provides value in the decision-making process regarding the timing and prioritisation of cholecystectomy. As the study demonstrates, a CRP value of greater or equal to 123 has an 82% positive predictive value of gangrenous cholecystitis; given the higher complication and mortality rates associated with gangrenous cholecystitis, urgent operative intervention should be considered in this group of patients.
This study is limited by the sample size and the retrospective design. There were insufficient observations to perform multivariable logistic regression modelling to further explore the effects of risk factors. As patients with acute cholecystitis were not routinely investigated with CRP levels, the included population in our study is vulnerable to sampling bias with subsequent reduced external validity.
The results of our study suggest a role of CRP in the diagnosis and triage of patients who require early cholecystectomy to prevent the potentially fatal sequalae of gangrenous cholecystitis. Although several attempts have been made in classifying the severity of acute cholecystitis and the associated outcomes and management options, most notably the Tokyo Guidelines 2013 and the Tokyo Guidelines 2018, no previous studies have focused on the utility of CRP in assessing gangrenous cholecystitis as a disease entity [20-22]. There is a potential for larger well powered prospective studies to incorporate CRP along with other risk factors in predicting the severity and sequelae of gangrenous cholecystitis. From this study, we suggest checking the CRP levels of patients who present with acute cholecystitis as CRP may have an important role in predicting gangrenous cholecystitis and hence informing the decision about whether emergency cholecystectomy or conservative management is the most appropriate for an individual patient.
Gangrenous cholecystitis is an uncommon variant of acute cholecystitis and is associated with significant complication and mortality rates. This study provides evidence that CRP performs better than WCC in discriminating between patients with gangrenous versus non-gangrenous cholecystitis. This study also shows that an elevated CRP value of ≥ 123mg/L is a good predictor of gangrenous cholecystitis which can aid in the decision-making process regarding the timing of cholecystectomy.