Case Studies on Environmental Management Strategies and Linkage with Waste Management Hierarchy: A Review
This paper is concerned with a review on various approaches of waste management since pre-industrial period (before 1960’s) up to date. During pre-industrial period, the waste produced from different sources was not beyond the carrying capacity of the environment. And, hence, industries discharge their waste as it is in to the environment causing not that much serious problem. With increasing urbanization and industrialization, the waste generated become very diverse and of great quantity. This diverse nature of waste produced demanded good management. Because of this, strategies were progressed from passive (dilute and disperse) through reactive (end-of-pipe and on-site approach) to proactive approach (cleaner production). Each of these strategies is also linked with the waste management hierarchies of Pollution Prevention Act of 1990.
Keywords: Pre-Industrial; Waste; Environment; Pollution; Prevention
There was no corporate environmental management prior to the 1960s. The absence of environmental protection legislation enabled companies to operate without any environmental safeguards and resulted in a wide range of ecological problems. Hence, the pollution from increasing urbanization and industrialization makes one of the largest environmental challenges faced by today’s world [1]. Rachel Carson’s Silent Spring, a book on the global problems of herbicides and pesticides written in 1962, prefigured the arrival of the environmental era. In 1960s, it was felt that growth and development and protection of the environment could not go hand in hand [2].
Environmental strategy is a long-term plan of action for resolving problems of natural environment considering particular functions and activities of organization in order to improve the quality of nature and of its components. The realization of environmental strategy brings the most desired effects when it is being used for a long period of time therefore it is necessary to realize it regularly and constantly. Implementation of the environmental strategy fundamentally influences the living conditions of present and future generations [3].
A strategy of environmental management has evolved over the years through a series of successive paradigms as presented in this review paper: passive (dilute and disperse approach), reactive (end-of-pipe and on-site recycling approaches) and proactive (cleaner production approach) [4]. The passive strategies were ineffective and the quality of environment improved only a little.
Apart from dilute and disperse (passive strategy) in 1970’s, reactive approaches of waste management including end-of-pipe approach and on-site recycling strategy evolved in the history of environmental management. There were some new solutions which consider the main challenges of the 21st century. In the Rio Conference (1992), some new bases of pro-ecological education were created. The managers are to think of and foresee the negative effects of different activities, and to make the ecological effects. The Cleaner Production strategy became the basis of the idea which is to foresee the effects of economic activity and prevent the waste production at source [3]. Therefore, in the next few pages, environmental management strategies with case studies are presented.
The waste management practice in 1960s (pre-industrial society) was based only on the assimilative capacity of the natural environment. After the Industrial Revolution, this approach seemed to be adequate for atmospheric emissions and wastewater discharges. It is a passive environmental strategy or technique where effluents from industries were discharged to large bodies of water, which had the capacity to dilute and disperse wastes. Because of this, seas and oceans had become a huge dumping ground for the world wastes [5]. Their effect might not pronounce when there were small industries. However, with massive industrialization and urbanization, heavy metals and other diluted wastes start to cycle and get accumulated in sediments or plant biomass leading to contamination risks. Therefore, this advanced to another preferable waste management approach: reactive strategies [6].
Landfilling is the most frequent municipal solid waste (MSW) disposal method worldwide, recognized as being an important option both now and in the near future, especially in low- and middle-income countries. For example, 338 million tonnes of waste were landfilled in most of the countries (Table 1). In the middle- and lower-income countries, they have poorly operated landfill that are likely classified as controlled dumping and 71.5 million tonnes waste were disposed through open dumping [7]. Among developing Asian (that is, Malaysia, Vietnam, India, Thailand and Indonesia), 70 to 90% of the MSW are being disposed in landfill (Table 1).
Solid-waste management is emerging as a major problem for policy makers in developing countries as the quantity of solid waste generated has increased significantly and its characteristics have changed as a result of changes in peoples’ lifestyles due to swift industrialization and urbanization. Rapid population growth and an increase in economic activities combined with a lack of education in modern solid-waste management practices, complicate efforts to improve the situation in these countries. Compared to high-income residents in developed countries, the urban residents of developing countries produce less solid waste per-capita. However, the capacity of developing countries to collect, process, dispose, or reuse the waste in a sustainable manner is highly limited [8].
Sri Lanka is located off the southeastern coast of India and covers an area of 65,610 km2. The Palk Strait separates Sri Lanka from India. Sri Lanka has nine provinces, three districts of western province (WP) and nine local authorities in Colombo District. Sri Lanka’s population was approximately 20 million in 2012 with a per capita gross national product (GNP) of US$1395 and a growth rate of 7.7%.
Sri Lanka underwent decentralization of its government structure with the setting up of Provincial Councils responsible for carrying out activities planned by central government ministries and their departments and agencies. The Provincial Councils are responsible for supervising the functioning of these lower authorities, including their solid-waste management.
The most common method of final disposal of MSW is an open dumping, which accounts for more than 85% of the collected waste. These are non-engineered sites where waste is tipped haphazardly without environmental protection. The majority of open dumps are in the low-lying areas - marshes and abandoned paddy fields that are filled with solid waste primarily as a means of land reclamation. Some of the local authorities use a daily topsoil cover to reduce nuisance and allay public opposition. These dumps are used to dispose of every type of waste, including industrial, hospital and clinical, and slaughterhouse wastes, together with MSW, without any proper segregation. None of the open dump sites is engineered to manage the leachate or control pollutants released from waste decomposition.
Few or no basic operations exist, such as leveling or covering of waste at the site, presumably due to the high costs involved. Soil cover is applied only at the final stage when there is a projected use of the land or public pressure. In addition to dumpsites operated by the relevant authorities, random dumping by private individuals takes place along streets, and on marshes and abandoned paddy fields. In the central part of the country, waste is mostly disposed of along the roads. Local authorities with regular responsibility take little control over these malpractices, mainly because of a lack of resources or stringent laws [8].
The city of Solapur is located in Eastern India, south eastern part of Maharashtra state, near Karnataka border with population of 873,009 in 2001. Total waste generated in Solapur corporation area is 420MT/day. The total quantity of solid waste generation is 75,000 Kg/day of which 50% is biodegradable (dry), 25% recyclable 15.3% green (wet) and 9.9% debris and silt. About 51% of the total solid waste collected from entire city is biodegradable processing the energy potential, if harnessed with anaerobic digestion, gasification or palletization technologies [9].
The waste is disposed daily to the landfill site located on Tuljapur road and Bhogaon. The disposal site is open and gives rise to contamination and the treatment process is not followed. The landfill sites are not well maintained, which create the threat of groundwater contamination due to leachate percolation. Open dumped garbage serves as breeding ground for disease vector such as flies, mosquitoes, cockroaches, and rats affect the other pests. Most of the waste remains laying down in open causing pollution with the odour and smell unless degrades naturally. A treatment plant of anaerobic digestion is in progress to extract energy from organic waste generating the biogas.
Landfill workers are vulnerable to various health hazards including injuries from scarp waste materials and they may also lead the poisoning from chemical wastes. Sometimes injuries caused by infected sharp metal waste. Further, workers face eye and skin infections, asthma, tuberculosis (TB) and some respiratory diseases.
From the 1960s onwards, it became obvious that ‘dilute and disperse’ was no longer effective for important point or concentrated sources. The globalization of environmental problems and the recognition of the planetary effects of pollution, particularly the effects on climate change and on the stratospheric ozone levels, contribute to the development of clean-up technologies, based on end-of-pipe approaches [10].
Reactive environmental strategy is compliance strategy, wherein firms rely on pollution reduction through an “end-of-pipe” approach, often resisting the enactment and enforcement of environmental legislation. Therefore, sustainable industries determined that conventional end-of-pipe environmental systems are not effective at damage remediation and are costly to operate and maintain [11].
Although end-of-pipe approach was effective to a certain extent, it generally produces by-products like sludge which has to be dumped or burned that consequently causes other environmental impact. Furthermore, the system does not reduce the amount of waste production; it transfers pollution from one medium to another medium; it does not eliminate pollution entirely and had limitations to solve environmental problems in their whole complexity [6].
The Malaysian palm oil industry is growing rapidly and quickly becoming a significant agriculture-based industry in this country. Table 2 shows that the total productions of crude palm oil in 2008 and 2009 are 17,734,441 and 16,044,874 tonnes, respectively [12,13]. The high production of crude palm oil prompts the palm oil industry to become an important contributor to Malaysia’s GDP. Export earnings from palm oil, palm kernel oil and relating products in 1998 amounted to almost US$5.6 billion, equivalent to 5.6% of the GDP. In Malaysia, palm oil is even utilized in the production of biodiesel (palm oil methyl ester or palm oil diesel) for buses and cars, and a major expansion of Malaysian diesel production with 5% palm oil fuel is expected from 2006 [14].
Malaysia has adopted a wet process for palm oil milling since the dry process, which is used in certain places in the south of Thailand, is unsuitable for use in large-scale production. The number of palm oil mills in Malaysia has increased tremendously, i.e. from about 10 mills in 1960 to 410 operated mills in 2008, in order to meet the crude palm oil demands both locally and internationally. However, the production of such large amounts of crude palm oil results in even larger amounts of palm oil mill effluent (POME) in which case in the year 2008 alone, at least 44 million tonnes of POME was generated in Malaysia and the figures are expected to rise every year. With this alarming figure, the palm oil mill industry in Malaysia is identified as the one generating the largest pollution load in rivers throughout the country [14].
Ponding system has been employed by most of the palm oil mills as their conventional treatment of POME, in which case more than 85% of the palm oil mills in Malaysia have adopted this method for POME treatment. Nevertheless, ponding system requires long retention times and large treatment areas because this system usually consists of a de-oiling tank, acidification, anaerobic and facultative ponds with respective hydraulic retention times (HRT) of 1, 4, 45 and 16 days. Also, the treated POME using ponding system sometimes couldn’t meet the discharge standard of 50 mg/l BOD and the removal of nitrogen from POME is usually unsatisfactory because nitrification is an uncommon phenomenon in the ponding system.
With the rapid expansion of the palm oil industry and the public’s increased awareness of environmental pollution, the industry is obliged both socially and aesthetically to treat its effluent before discharging it. In 1977, the Malaysian Government proposed and legalized standards for POME discharge into watercourses. Since then, palm oil mills are required to treat their POME prior to discharging it into streams and rivers. Therefore, instead of pollution control, pollution prevention should be the aim of any policy intervention.
In Nepal, there were no specific national policies on the waste management till 1996. Nepal has many problems with medical waste which impact adversely the environment including human health. Nepal Health Research Council in collaboration with Ministry of Health (MoH) and world health organization (WHO) has developed national health care waste management guidelines and training manuals for medical professionals. Health Care Foundation of Nepal (HECAF) is another organization which has been working in the field of medical waste management since 1999 [15]. There is a national guideline on medical waste management, but it has not been implemented. As a result, many hospitals use small scale incinerators, or open burn or dump the waste in their premises until the garbage pickers comes and dispose in the landfill. Most of the incinerators have a problem of quality and maintenance of equipment. These issues are not given adequate attention [16].
Incinerator facilities, if properly implemented, not only reduce final disposal of waste, but also produce electricity and/or heat, saving (energy) resources. However, incineration plants also contribute to externalities, such as emissions to air and chemical waste residuals [17]. The situation in Nepal is much worsen because it was not properly built and there are residents who could directly be affected by emissions resulted from the smoke around the burning equipment [18].
End of pipe methods often resulted in increased costs with no appreciable benefits to industries in terms of enhanced materials or energy uses; as a result, recycling wastes and resource recovery methods were evolved in 1980s; which were actually better mechanisms of resource use and waste minimization tactics over the end-of pipe strategy [19].
The importance of waste recycling cannot be overstressed as it leads to the reduction of municipal solid waste treatment and disposal costs as well as the prolongation of landfill life-span and conservation of the environment. Although often unrealized and overlooked, as noted by Ruiz (2001), recycling is a method of solid waste management like landfilling or incineration but is environmentally more desirable [20].
Recycling unlike previously mentioned strategies of waste management has its own economic advantage. For example, Cabral et al , (2013) identified considerable resource recovery in waste package recycling system of France as indicated in (Table 3) [21].
Ondo State Integrated Wastes Recycling and Treatment Project are located along Igbatoro Road, Akure in Ondo state. Akure is the capital of Ondo State and it is located in South Western Nigeria. The state has eighteen (18) local government areas and a land area of 13,595km2. The amount of solid waste generated in Akure has increased steadily over time, from an estimated quantity of 60,000 metric tons per year in 1996 to 75,000 metric tons in 2006 because of the increasing population, industrial and economic development. While the population of Akure was about 283,108 in 1996, it increased to approximately 353,211 in 2006 [22].
The recyclable materials in Akure are organic matters (kitchen, yard waste and animal dings), paper, cardboard, metals, plastics, and glass. These recyclable materials are sorted on-site by OSIWRTP employees before they are transferred to various units. Although Waste separation after collection is an expensive and difficult process, the employees are well educated on the issue of solid waste management and source separation [22].
Some recycling activities in Akure include composting (turning waste into organo-mineral fertilizer for agricultural use); recycling of plastics whereby plastics are shredded to smaller particles and are converted to pellets; scrap metals are turned into ingots by melting the metal, pouring the liquid metal into moulds, and then removing the moulds when the metal is formed; and turning landfill gases into renewable energy. Important role is played by OSIWRTP in solid waste management and in generation of wealth for the state. This initiative has not only made Akure environmentally friendly but has created employment for operators [22].
Pollution abatement, energy saving, social benefits and economic benefits are the primary indices that will measure the advantages of the waste to wealth activities of OSIWRTP when fully made operational. Organic fertilizer, pelletized plastic, recycled metal scraps are various sources of income on Akure.
Dell Company, through its “legacy of good” programme, the technology giant has ambitious plans to cut waste, create more eco-friendly products and inspire its stakeholders to adopt “circular” thinking. In particular, it plans to use 50m pounds (22.7m kg) of recycled plastic and other sustainable materials by 2020, create 100% recyclable or compostable packaging, and recover 2bn pounds of electronic waste. In 2014, Dell sourced 4.5m kilos of recycled plastic to build monitors and desktops. It also began capturing waste materials from customers’ old computers to incorporate in new products [23].
People in 78 countries are already taking advantage of its free take-back programme to recycle end-of-life electronics, with 560m kilos of e-waste recycled so far. Now, the company is transforming some of the collected plastic waste into new materials for its OptiPlex 3030 desktop computer, creating the industry’s first certified “closed loop” recycling system.
Elsewhere, Dell eliminated 20m pounds of packaging between 2008 and 2012, generating more than $18m (£12.3m) in cost savings. Its intention to reduce packaging waste has seen the company replacing non-biodegradable, oil-based materials with organic alternatives such as bamboo and mushrooms. Its wheat straw packaging uses 40% less energy and 90% less water than traditional paper-based cardboard.
As part of its effort to encourage others to see waste as a valuable resource, Dell formed a partnership with the United Nations Industrial Development Organization to collaborate on developing recycling models for e-waste in developing countries. This builds on its work to empower people in Kenya to generate additional income by collecting e-waste, and a roadmap it created for other organization’s to prosper by recycling waste.
Finally, the most appropriate waste management strategy to control environmental pollution is cleaner production. In comparison with the previously discussed strategies, cleaner production is a proactive approach where companies take preventive measure to reduce waste production at source.
Proactive environmental strategy is going beyond compliance to a focus on prevention, a systemic approach that emphasizes source reduction and process innovation. The introduction of such environmental technology was focused on the prevention of pollutants coming into the air, soil or water, but not on the prevention of the ‘production’ of the pollutants themselves. The Pollution Control approach has been the basis for the perspective that a company environmental policy and programme always cost much money. From the 1980s, the benefits of ‘Pollution Prevention at Source’ have been explored in case studies in the United States and Europe. The case studies introduced the perspective that ecology and economics can go together [24].
World Commission on Environment and Development (WCED) (1987), stressed on the urgency of meeting the needs of present and future generations in an environmentally sound way [25]. Industrial operationalization of ‘Sustainable Development’ is being developed via cleaner technologies and products. By sharing responsibilities for the environment at all organizational levels within companies, by substituting toxic compounds and applying renewable energy and environmentally sound technologies, new environmental management instruments are developed.
Cleaner production concepts cover internalization of environmental effects in new management approaches. The term cleaner production was developed by an expert working group in 1989 as advice for United Nation Environmental Program’s ‘Industry and Environment Program’ [26].
Cleaner Production (CP), a strategy for addressing the generation of pollution as well as efficient use of resources at all stages of the production process, is playing an increasingly prominent role in China’s industrial and environmental protection policies [27]. China started its promotion and implementation of CP in the 1990’s, and its first CP project began in 1993 with support from the World Bank and the UNEP (China Council for International Cooperation on Environment and Development [28]. In 2004, the Sino-German Technical Cooperation Programme ‘‘Environment-oriented Enterprise Consultancy Zhejiang’’ (EECZ), in cooperation with the Zhejiang Economic Trade Commission (ZETC) and the Zhejiang Environmental Protection Bureau (ZEPB), provided Environment-oriented Cost Management (EoCM) training to selected enterprises in the province. The objective of this ongoing project is to improve the implementation of CP among enterprises in Zhejiang Province.
The Zhejiang government has worked consistently to promote CP and develop a circular economy as well as issuing a number of supporting policies and legislation. The Zhejiang government assisted the establishment of the Zhejiang Cleaner Production Promotion Center (ZJCPC), and a demonstration project for ten pilot companies to carry out a CP audit in the Taihu area in 2002 [27]. Initiated in 2003, Zhejiang Province establish an eco-province, “Build Green Zhejiang” program which involve the selection of a further 500 pilot companies for CP implementation and aims to construct 153 ‘‘green’’ enterprises by 2007.
ZEPB allocates RMB 30 million (approx. US$3.7 million) for pollution control projects and the support of certain enterprises carrying out CP audits and ISO14000 certification. Both on the provincial as well as the local level, the Economic and Trade Commissions also provide subsidies to those companies that have successfully carried out a CP audit [29].
Despite all the efforts made in order to implement CP, China has encountered significant challenges in improving, on a large scale, the environmental performance of its industries. Factors such as the difficulty in mainstreaming CP in industries, limited institutional resources as well as constraints in financial and technical resources of small and medium-sized enterprises have hindered the widespread adoption of CP [27].
Schick’s Verona, Virginia facility (formerly American Safety Razor) manufactures a wide variety of blades and tools from steel stock, for personal care, professional use, and specialty categories such as medical blades. Trichloroethylene (TCE) was used as a cleaning solvent in both liquid and vapor cleaning/degreasing operations. The bulk of the TCE was recycled onsite through carbon absorption and distillation; some wastes were generated and shipped offsite as hazardous waste (United States Environmental Protection Agency [USEPA], 2017).
When Schick acquired the facility in 2010, the company’s prior experience with TCE, particularly the potential for contamination and subsequent remediation, combined with other factors – increasing costs (of TCE, waste disposal, and energy needed for distillation), and increased regulatory risk -- made TCE elimination a priority. The plant installed aqueous “wash boxes” on production lines to replace TCE-based cleaning operations, and also uses an alcohol-based cleaner in vapor degreasing as an effective substitute for TCE. The procedures were rigorously tested to insure equivalent cleaning results, and employees were trained in their operation. Schick’s prior experience with these technologies facilitated the adoption at the Verona plant [30].
TCE use has been completely eliminated at this plant; the chemical is no longer used in operations and there is no remaining inventory. Although risk reduction was the key driver for these pollution prevention measures, the plant estimates cost reductions of $250,000 a year from reduced energy, material and hazardous waste disposal costs.
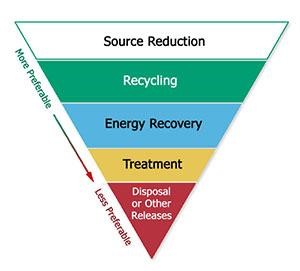
The Pollution Prevention Act (PPA) of 1990 was enacted to focus industry, government and the public on source reduction (pollution prevention) rather than upon treatment and disposal. Pollution prevention is the reduction or elimination of wastes and pollutants at their sources (Figure 1). The Pollution Prevention Act of 1990 explains the hierarchy clearly as follow:
a) Prevention/Source reduction: it is the most desirable option of the hierarchy and the most effective way to reduce risk. Pollution should be prevented or reduced at the source whenever feasible.
b)Recycling: pollution that cannot be prevented should be recycled in an environmentally safe manner whenever feasible.
c) Treatment: pollution that cannot be prevented or recycled should be treated in an environmentally safe manner whenever feasible; and
d) Disposal: this is release into the environment should be conducted in an environmentally safe manner.
In order to link the pollution prevention strategies with environmental management strategies, firstly prevention, which is placed at the top of the hierarchy, is linked with cleaner production environmental management strategy. This mechanism is the best option in order to reduce any form of waste released to the environment. The risk of pollution here is reduced by means of prevention/cleaner production.
Secondly, recycling and treatment which are ranked second and third in the pollution prevention hierarchy are related to on-site recycling and end-of-pipe approaches of environmental management strategies respectively. In any product life cycle process, waste is generated at every step of the process. It is therefore crucial to safely release these waste so as to overcome pollution problem. Both recycling and treatment mechanisms are reactive approaches that companies are trying to reduce the amount of waste that finds its way to landfill. Through these approaches waste couldn’t be avoided totally and there is still waste at the end, waste of waste.
Finally, disposal is linked to dilute and disperse approach. It is a strategy where waste that couldn’t be recycled, reused or treated can be managed. Disposal is the last option by which waste that is no longer usable is collected, transported and finally dumped or disposed of. It was practiced since 1960s still today in mainly low- and middle-income countries. It causes serious pollution problem; water and soil pollution through leachate, air pollution through the emission of mainly methane gas (greenhouse gas). Therefore, when disposal is the only option, it has to be well managed safely operated.
In this paper, environmental management strategies from passive through reactive to proactive supported by case studies were reviewed. In 1960s when dilute and disperse approach was common option for companies to manage their waste, the environment was resilient enough to accept and still functioning. But in the course of time, industrialization caused so many problems threatening the planet earth because of wastes, emissions and pollution. The waste management strategies were progressed from disposal to treatment, recycling and reuse. These approaches of waste management were better than disposal but not complete enough in order to create clean environment. To overcome these problems, cleaner production strategy is the best option to bring about green growth and ensure sustainable development, where environment and society are equally important as economy. Therefore, countries of the world, whether developed or developing, should invest in this regard to make our planet earth habitable.