Characterization and Environmental Assessment of Leachates Generated Around Solid Waste Disposal Sites in Port Harcourt, Nigeria
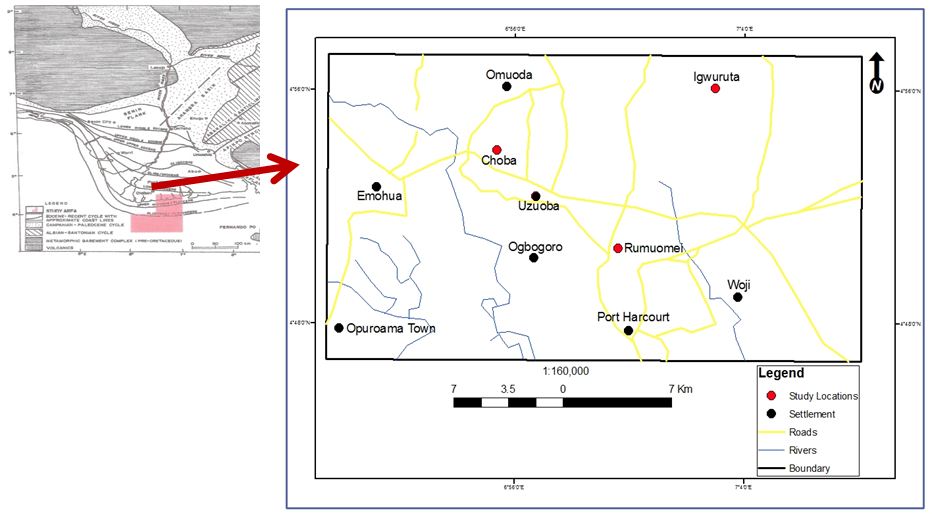
In this study, the leachate characterization is defined from different dumpsites in some parts of Port Harcourt, namely Choba, Igwuruta and Rumuomei. Leachate samples were collected from the three locations of dumpsites and analyzed for physico-chemical parameters. The results were compared with the world health organization (WHO) standard and Nigerian standard for drinking water quality. It was observed that the pH, Phosphates, Sulphates, Zinc and Cupper were within Nigerian regulatory standard while EC, Cl, BOD, COD, Pb, Fe, Mn and Cr exceeded the standard. The heavy metals content of leachate samples obtained from the laboartory analysis included Copper (cu), Zinc (zn), Iron (Fe), Managenese (Mn), Chromium (Cr). Copper has a range of -0.067 to 0.192mg/l, with mean value of 0.019mg/l. The mean falls below the WHO standard of 1.0mg/l. The relative low values of heavy metal obtained may be attributed to dumping of muncipal waste and small percentage of industrial wastes. Zinc concentration of the lechaete sample range from 0.113 to -0.2.38mg/l, with a mean value of -0.126mg/l, which falls below the WHO standard of 5mg/l. The concentration of Zn depicts the dumping of batteries and flourescent lamps in the dumpsite. Lead has a range of 0.027 to 1.440mg/l with a mean value of 0.062mg/l. The quantity of lead, is attributed to presence of lead related waste such as batteries, paints and photograph processing chemical in the dumpsites. Iron has a range of 8.916 to 13.27mg/l with a mean value of 10.84mg/l. The high level of iron in the leachte samples may indicate presence of iron and steel scraps waste in the dumpsite. Managense concentration range 1.796- 4.117 mg/l. Chromiun has a range of 0.04-0.588mg/l, with a mean value of 0.351mg/l. The presence of microbes are indicated in the value of Total coliform (TC), Total heterotrophic bacterial (THB), Total heterogenous fungi (THF),which exceed the value of WHO standard. Goverment has a huge responsiblilty in funding , enacting laws, providing and maintainace of necessary infrastructure for environmental sound collection, transportation and disposal, through the Rivers State Waste Management Agency (RIWAMA). Goverment and waste agency should promote educational and awareness program for the citizens as well as in schools to inculcate an attitude on waste prevention, seperation of waste at source, and other environmentally sound municipal waste management approach.
Keywords: Leachates; Haevy Metals; Solid Waste; Waste Management; Leachate Characterization
The composition of refuse generated in an area determines the type of disposal method suitable for a particular form of waste and the effectiveness of a collection system depends on the cooperation of households and individuals in various sectors of the city in providing containers for storing refuse in accordance with the regulation and regularly placing the materials for collection Afon [1]. Miller defines waste as man’s unwanted materials that need to be discarded [2]. Adegoke defines waste as substances and materials which are disposed of or are required to be disposed of according to the provision of the national law [3]. Miller defines solid waste as any unwanted or discarded material that is not liquid or a gas [4]. It may not generally be accepted that solids and indeed wastes are “useless, unwanted or discarded (undesirable) materials” given the degree of scavenging on waste heaps in less developed countries like Nigeria by both humans and animals. Urban wastes are those materials that are generated, used and have no further value and are thrown away in the environment, these materials can be valuable raw materials located at a wrong place [5].
A solid waste is any material that is discarded by being abandoned, inherently waste-like, a discarded military munitions, material that can be recycled in certain ways. Improper municipal solid waste disposal and management causes all types of pollution; air, soil, water. Surface and ground water can be contaminated through run off from leachate of dumpsites. United State Environmental Protection Agency [6]. Solid waste is characterized by corrosiveness, ignitability, reactive; toxicity and this are threat to the environment and health of human when they are beyond threshold [7].
Butu and Mshelia in their studies classified solid waste into non- biodegradable and bio-degradable [8-10]. Non- biodegradable materials are known to have metals that emit toxic when exposed to a certain level, example of such are the polythene bags and e-waste usually from electronic waste, while biodegradable are without direct chemical impact, but result in nuisance and means to convey disease by vectors example rodents, reptiles and insects.
Solid wastes predominantly consist of municipal solid waste (MSW), residential, commercial, and industrial waste. Municipal Solid Waste is more commonly known as trash or garbage and it is point of this study. Domestic or residential waste are those that are collected from dwelling place on regular basis, such waste include organic matter resulting from dwelling places on regular basis such waste include organic matter resulting from preparation and consummation of food, rags nylon and ashes are the remain after various cooking and heating processes.
The commercial wastes are those that arise from shops, supermarket, market and others; they include paper, carton, polythene bags and nylons. The industrial wastes are those waste materials that arise from industries; these could be solid, liquid, sludge or emotive title attached to them like toxic, hazardous and special. The industrial waste include metals, scraps, chips and grits from machine, shop, sawdust, paper pieces and glass [11-13].
Solid waste can be classified into three kinds, namely Garage, Ashes and Rubbish according to Kenneth and Huie [14]. The garages include organic matter resulting from preparation and consumption of food. Ashes include remains of cooking and heating process and rubbish may either take the form of combustible such as paper, rags, wood, leaves and weeds or non-combustible such as glass, plastic, polythene and metal materials.
Solid waste management is a serious problem in Nigerian, and most cities like Port Harcourt lack proper management place, as well as standard engineered landfills [15-17]. The lack of provision of proper engineered sanitary landfills for disposal of waste by the local government authorities and state government has given room for the proliferation of open dumps that are scattered in every available space within and outside the city. These scattered refuse dumpsite usually become eyesore to passer-by and could obstruct road user. The problem of solid waste has become more sensitive in the city as its urbanization and industrialization activities increase rapid within the metropolitan. Municipal Solid Waste (MSW) problems in developing countries like ours (Nigeria) especially Port Harcourt which is more complex due to a number of reasons, such as urbanization, economic growth, political, cultural aspect and to an extent, lack of government enforcements of sanctions. The convectional municipal solid waste management (MSWM) approach is reductionist, not the ability to solve the complexities caused by interaction of different part of the system. Functional elements of waste management are considered independently, while these elements are influenced by one another, consequently one problem is solved but others remained. These challenges promote holistic approach that considers all the aspect such as cultural, environmental, social and political and all stakeholders of municipal solid wastes management system. Therefore for a sustainable solid waste management with an aim of reduction in environmental and health adverse effects, a multi-dimensional approach should be followed. Therefore, it is pertinent to access the environmental and health threat that we are exposed to through solid waste.
Geographically, the study area covers within Ikwerre and Obio Akpor Local Government Areas of Rivers State, Nigeria. These locations were chosen because it is growing and it is within the metropolitan area. This is because about 80 percent of solid waste generated comes from domestic sources and one of the locations is the approved site from the state. The effect of solid waste is usually on receptors like plants, human, environment in the location.
Port Harcourt is located within the oil-rich Niger Delta sedimentary basin. Generally, the basin consists primarily of regressive sediments which are of Tertiary age. The detailed geology of the lithostratigraphic subdivision of the Niger Delta basin was given by Short & Stauble [18]. The Niger Delta basin is one of the most prolific hydrocarbon systems in the world. The delta was formed at the site of a rift triple junction that is related to the opening of the Southern Atlantic; starting in the late Jurassic, continuing into the Cretaceous.
The coastal sedimentary basins of Nigeria have witnessed three depositional cycles. The first depositional cycle began with a marine incursion in the middle Cretaceous, which was terminated by a mild folding phase in the Santonian. The second cycle is identified by events leading to the growth of a Proto-Niger Delta during the late Cretaceous, ending in a major marine transgression in the Paleocene. The third cycle stretched from Eocene to Recent, marking the continuous growth of the main Niger Delta. A threefold subdivision is established for the lithostratigraphic units of the Niger Delta subsurface. These units occur throughout the Niger Delta basin; with ages ranging from early Tertiary to Recent. They are related to the present outcrops and environment of deposition [18].
The Benin flank is regarded as the northern boundary of the Niger Delta; which is an east-north-east trending hinge line which lies south of the West African basement massif. The basin’s north-eastern boundary is defined by outcrops of the Cretaceous on the Abakaliki High and also further east-south-east by the Calabar Flank (a hinge line bordering the adjacent Precambrian). The Tertiary portion of the basin is subdivided into three distinct formations, representing a prograding (regressive) depositional facies which are distinguished by their sand-shale ratio.
(1) The Akata Formation: This formation lies at the base of the basin, which is of marine origin; composed of low density, high pressure shallow marine to deep water thick shale sequence. Beginning in the Paleocene and through to the Recent, the Akata Formation formed during lowstands, when terrestrial organic matter and clays were transported to deep water areas that are characterized by low energy conditions and anoxic settings. The formation underlies the entire stretch of the delta and it’s typically over-pressured. During the development of the delta, the deep sea sands of the upper Akata were most likely deposited by turbidity currents.
(2) The Agbada Formation: This consists of paralic siliciclastics over 3700 meters thick and represents the actual deltaic portion of the sequence. The formation is entirely an alternating sequence of deltaic (fluvial, coastal, fluvio-marine) sands and marine shale. In the lower Agbada Formation, shale and sandstone beds were deposited in equal proportion. However, the upper coastal portion is mostly sand with minor shale interbeds [18].
(3) The Benin Formation: This formation consists of freshwater continental (fluviatile) deposits, comprising of alluvial and upper coastal sands and gravel with occasional clay layers. The formation has a thickness of 2100 meters at the basin center [19].
Standard sampling methods were employed in the study and visual examination of the field before sampling was carried out. The observation was targeted at determining the land orientation of the location amongst other reasons.
The Leachate samples were collected from the surface at the low gradient of each location. Prior to the sampling, the sample bottle were labeled to avoid further exposure of the sample after collection and difficulty in labeling of the bottle due to its wet condition. Once the sample is collected and the crown cork placed appropriately, it is immediately stored in the iced cooling box. The location is then geo-referenced both in the field note and in the base map. The elevation of the location is also obtained using the GPS. Both the coordinate and elevation were obtained with maximum error margin of 3.0m
Samples were taken and transported to the laboratory for analysis on the same day. They were conveyed in the cooling box to maintain normal and acceptable condition. The physio-chemical analysis was carried at the Institute of Pollution Studies (IPS), Rivers State University, Port Harcourt, by standard methods APHA 20th Edition [20]. Physico-chemical parameters such as pH, electrical conductivity, total dissolved solid (TOS), total hardness, dissolved oxygen (DO), biological oxygen demand (BOD), sulphate, phosphate, and chloride were analysed.
Laboratory analysis of Heavy Metals such as Lead, Copper, Zinc, Iron, Manganese, and Chromium were carried at Anal Concept Ltd with standard method analysis by GBC Avanta Version (2.02). Microbial analysis was carried out at Austino Research & Analysis Laboratory Nig. Ltd by standard methods of Pour Plate Method for Total heterogeneous bacterial-THB, and Total heterogeneous fungi-THF, for Total coli form Most Probable Number Method was used.
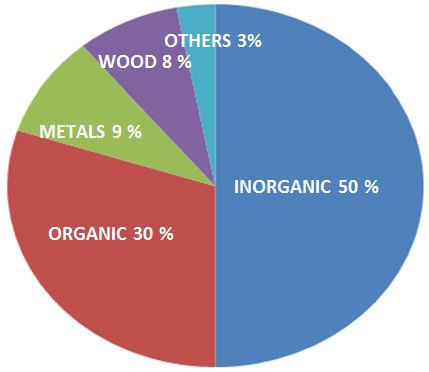
The municipal solid waste of the study areas contain metals, woods, organic fractions(paper, food waste, yard waste) and inorganic matters (textile, plastics, glass, leather) from different sources, such as residential, commercial, institutional, industrial areas. Figure 2 shows the characterisation of the study location. By random sampling, observation from the three (3) different locations, the composition of the municipal waste can be characterized as follows:
for the leachate sample examined ranged from 6.54-6.99, with a mean value 6.765 while the control had a value of 5.34. This falls within the recommended WHO standard [21]. The value indicate acidicty.
is the measure of a substance to accomodate the transport of an eletric charge. It also measure ionic strength. The EC has a value range of 746-16200us/cm. The control has a value of 61.4us/cm. According to Paul, chloride,sodium and potassium contribute mainly to conductivty [22].
The presence of PO4, in leachate is dangerous as it increase eutrophication and promote the growth of algae. It has a value of 0.05mg/l.
This has a range of 6.67- 72.33mg/l which is below WHO standard of 200mg/l. Sulphate show variation in its value with the different dumpsite and may have resulted from oxidation of iron sulphide present in a particular site.
The value of chloride in the leachaete ranges (49.4-1877mg/l) with a mean value of 939mg/l. This exceed WHO standard of 200mg/l. Cholride has a conservative contaminant effect and therefore pose serious threat to groundwater pollution.
Value ranges from 17.1-548mg/l with a mean of 351mg/l. BOD5 showed maturity of the tends to indicate the maturity of the dumpsite.
The heavy metals content of leachaete sample obtained from the laboartory analysis included Copper(cu), Zinc(zn), Iron (Fe), Managenese(Mn), Chromium (Cr).Copper has a range of -0.067 to 0.192mg/l, the mean value is 0.019mg/l. The mean falls below the WHO standard of 1.0mg/l. The relative low values of heavy metal obtained may be attributed to dumping of muncipal waste and small percentage of industrial wastes. Zinc concentration of the lechaete sample range from 0.113 to -0.2.38mg/l, with a mean value of -0.126mg/l, which falls below the WHO standard of 5mg/l. The concentration of Zn depicts the dumping of batteries and flourescent lamps in the dumpsite. Lead has a range of 0.027 to 1.440mg/l.The mean value is 0.062mg/l. The quantity of lead, is attributed to presence of lead related waste such as batteries, paints andphotograph processing chemical in the dumpsite. Moturi et al . , Mor et al [24,25]. Iron has a range of 8.916 to 13.27mg/l with a mean value of 10.84mg/l. The high level of iron in the leachte sample may indicate presence of iron and steel scraps waste in the dumpsite. Managense concentration range 1.796- 4.117 mg/l. Chromiun has a range of 0.04-0.588mg/l, with amean value of 0.351mg/l. The presence of chromiun in the sample may indicate waste from the emission of automobiles. The presence of these heavy maetals is an indication of industrials waste in the these dumpsites [26].
The presence of microbial as in the Table 1 is indicated in the value of Total coliform (TC), Total heterotrophic bacterial (THB), Total heterogenous fungi (THF), which exceed the value of WHO standard. These coliforms of bacterial and fungi are known to be pathogenic and are opportunistic and their presence indicates poor quality of water [27-29]. High concentration of total coliform in these study areas is indicative of high pollution of groundwater by organic contaminant at the dumpsites.
This study has shown from characterization of the study area, to have about 50% percentage composition for inorganic matters which comprise of textile, plastics etc. The municipal solid waste in Port Harcourt shows high level of non-biodegrabable matter, such as plastic and polyethen bags in form of pure water sachets are indiscrimatly littered in the metropolis. Plastics are so versatile in use that their impacts on the environment are extremely wide ranging. Careless disposal of plastic bags chokes drains, blocks the porosity of the soil and causes problems for groundwater recharge. Plastic disturbs the soil microbe activity, and once ingested, can kill animals. Plastic bags can also contaminate foodstuffs due to leaching of toxic dyes and transfer of pathogens. Careless disposal on the ground, littered around in open drains, or in unmanaged garbage dumps. Plastics cause extensive damage to the environment at large.
Solid waste generation is tightly connected to population, urbanization and affluence. Solid waste has become a major challenge for municipality to collect, recycle, treat, and dispose of the due to growth in population,prosperity and urbanization in our country as a developing nation. The neglect of solid waste management in a country will compromise sustainble development. The problems of which solid waste generate are of concern to life preservation. It must be emphazied that there are severalpublic health and environmental cobenefits amass from effective, solid waste management practices, which concurrently will improve the quality of life, prevent water and soil contamination, promote good health for humans and maintain friendly environmental condition by reducing green house gas emissions,conserve natural resource and provide renewable energy benefits [30].
Municipal solid waste management & disposal continue to be area of concern in relation to health, social, environment and economics issue. Solid wate management requires a holistic approach to attend a sustainable management plan. Proper management of solid waste reduce or eliminates adverse impacts on the environment and human health and supports economic development and improved quality of life. Therefore a number of methods should be followed in achieving a subtainable plan. Methods of waste reduction, waste reuse and recycling are the preferred options when managing waste [31].
Standard landfills (not the ordinary dug earth) should be constructed at specific locations to minimize the impacts of municipal solid wastes. These locations should be located at a safe distance from all human settlement/ residential area. Landfill sites should be well lined and walled to ensure that there is no leakage into the nearby ground water sources. Recycling too carries health risks if proper precautions are not taken. Rag pickers and others, who are involved in scavenging in the waste dumps for items that can be recycled, may sustain injuries and come into direct contact with these infectious items. It becomes necessary to be guard against chemical when working with waste disposal agency.
Goverment has a huge responsiblilty in funding, enacting laws, providing and maintainace of necessary infrastructure for environmental sound collection, transportation and disposal, through waste management agency in the state Riverstate Waste Management Agency (RIWAMA). Goverment and waste agency should promote educational and awareness program for the citizens as well as in schools to incucate an attitude on waste prevention, seperation of waste at source, and other environmentally sound municipal waste management approach.
Plastics Industries should design eco-friendly, biogradable plastics with less use of colouring,to reduce the use of chemicals that are generated from the dyes.Generally the cost of remedies of the effect of improper solid waste management can be avoided if the public or citizen, manufactuers promote the use of biodegradable solid waste more than nonbiodegradable waste.