Comparative Analysis of Chemical, Fungal and Enzymatic Degradation of MCP
In general three different methods are used for the cleanup of pesticides. These include chemical, microbial and enzymatic methods. Therefore, the present study is an endeavor to compare the efficiency of all the three methods for the study of degradation of monocrotophos (MCP) (150 μgml-1). Chemical method involved the use of 0.1N NaOH, whereas for the biological as well as enzymatic method, molecularly characterized fungal strain Aspergillus niger JQ660373 was used. %age of MCP degradation was assessed in the form of residual MCP concentration and hence degradation kinetics was premeditated. The results were confirmed by using analytical tools, High Performance Thin Layer Chromatography (HPTLC) and Fourier Transfom Infrared (FTIR). Results of the study demonstrated that degradation of MCP followed first order kinetics with the calculated half-life of 0.79 days in enzymatic method as compared to 3.16 and 4.21 days for fungal and chemical method. HPTLC chromatograms clearly indicate significant decrease in the standard MCP peak (rf 0.19-0.21) with increasing incubation duration. Molecular insight of MCP degradation as studied, suggests hydrolytic cleavage of MCP resulting in the formation of inorganic phosphates (–PO4) and amines. The overall efficiency of degradation was found to be Enzymatic > Fungal > Chemical.
Keywords: Chemical; Organophosphorus; Pesticide; Degradation; Enzymes
The term “pesticide” embraces an enormous diversity of products that are used in a number of different activities and are intended for preventing, destroying, repelling or mitigating pests. Among newly developed pesticides, organophosphorus pesticides (OPPs) are most commonly used as they degrade faster in the environment. MCP (Dimethyl (E)-1-methyl-2 methyl carbamoyl vinyl phosphate) is an organophosphate with broad-spectrum contact and systemic activity against spur throated locust, sorghum midge, western flower thrips, aphids, the green vegetable bug, mites, the stem borer, potato tuber moth which are common pests of sorghum, sunflowers, tomatoes, cotton, potato, soybean and tobacco [1,2].
Despite increasing crop productivity MCP is highly toxic to human beings. Mechanism of toxicity of MCP involves irreversible acetyl cholinesterase inhibition [3].
Owing to its highly toxic nature, degradation of MCP from the environment is very essential. Degradation of MCP occurs by biotic as well as abiotic factors of the natural environment. These factors influence the degradation of MCP and act in tandem and complement one another in the microenvironment [4].
Traditional cleanup methods of pesticides include the use of chemicals. These chemicals pose hazards on the soil fertility and soil microbial flaura and fauna. Therefore, these methods were discarded and biological methods emerged as a new tool for the degradation of pesticides.
Different microbial species such as algae, Chlorella vulgaris Beijernik, Scenedesmus bijugates, Synechococcus elongates, Nostac linckia and Phormedium tanue [5], several bacterial strains, Azospirillum lipoferum and Bacillus sp.[6], Arthrobacter atrocyaneus MCM B-425 and Bacillus megaterium MCM B-423 [2], Arthrobacter atrocyaneus, Bacillus megaterium, and Pseudomonas mendocina [7], Pseudomonas aeruginosa F10B and Clavibacter michiganense subsp. insidiosum SBL 11 [8], Paracoccus sp. M-1[9], Pseudomonas and Flavobacterium [10] are well known for their MCP degradation potential.
The main disadvantage of the use of bacteria for the degradation of pesticides is their short life span and low tolerance capacity to different environmental stresses. Hence, new technique of using fungi as a tool for the degradation pathway came into existence.
Fungi generally biotransform pesticides and other xenobiotics by introducing minor structural changes to the molecule and rendering it nontoxic. This bio-transformed pesticide is released into the soil, where it is susceptible to further degradation by bacteria [11].
Different fungal strains such as Aspergillus and Penicillium sp., [12], Penicillium corrylophylum [13], Aspergillus oryzae [14], Aspergillus sp. [15], Aspergillus niger JQ660373 [16], Aspergillus flavus, Fusarium pallidoroseum and Macrophomina sp. [17] are also very well known for their MCP degradation efficiency. Now a day’s extracellular protein plays major role in the biodegradation of pesticides [18-22].
Different enzymes such as phosphatase and esterase [23,24], phosphotriesterase [8], carboxylesterase [25] and organophosphate hydrolase (OPH) [26] have been reported to degrade MCP.
Therefore the present study is an endeavor to compare the MCP degradation rate by three distinct methods, chemical (0.1N NaOH), microbial and enzymatic by using Aspergillus niger JQ660374 as a model microorganism.
MCP of analytical grade (99.5% purity) was purchased from sigma and stock solution (1 mgml-1 in ethanol) was prepared. All the other chemicals used in this study were of analytical grade and were obtained from Himedia and Rankem, India.
Modified Czapekdox medium (CZM) was used as growth medium which contained sucrose, 30 g; NaNO3, 2 g; KCl, 0.5 g; MgSO4.7H2O, 0.5 g; glucose,10 g; FeCl3,10 mg; BaCl2, 0.2 g; CaCl2, 0.05 g per litre and was supplemented with MCP (150 μgml-1) as a sole source of phosphorus.
Pure culture of Aspergillus niger was isolated from soil by serial dilution [16]. Hydrolases were purified from the fungal isolate by the method of [26].
Chemical Method: 125 ml of CZM medium was inoculated with 1 ml of 0.1 N NaOH.
Microbial Method: Aspergillus niger JQ660373 was suspended in 1 ml, 0.85% saline to make a cell suspension of 1×10⁸ cells per ml and this suspension was inoculated in 125 ml of CZM medium [16].
Enzymatic Method: Aspergillus niger JQ660373 at a concentration of 1×10⁸ cells per ml was suspended in CZM medium and incubated for 10 days in an orbital shaking incubator at 28 ± 2 ºC. After the completion of incubation time the flasks were withdrawn and the filrate was checked for the presence of hydrolase enzyme by the assay procedure described by [26]. Extracellular enzyme was purified by AmSO4 precipitation, dialysis and G- 100 Chromatography. Partially purified enzyme (G-100) was further purified by ion exchange chromatography. The concentration of the purified enzyme was optimized by estimating the enzyme activity at different protein concentrations i.e. 50, 100, 150, 200, 250 and 300 μgml-1. 1 ml (optimum concentration) of the purified enzyme fraction was inoculated in 125 ml of CZM medium [26].
Effective antibiotics, streptomycin and penicillin (30 mgL-1), were added in the growth medium to avoid bacterial contamination. Control sample containing CZM media + MCP (150 mgL-1) were prepared simultaneously. All the flasks are incubated at 28 ± 2˚C for 15 days in an orbital shaking incubator at 90 rpm under aerated culture conditions.
At regular time interval of 2 days, the flasks were withdrawn and the samples were subjected to extraction and cleanup by equal amount of ethyl acetate and florosil column. The residual MCP was quantified by spectrophotometer at 254nm.
% of MCP degradation was calculated using the formula

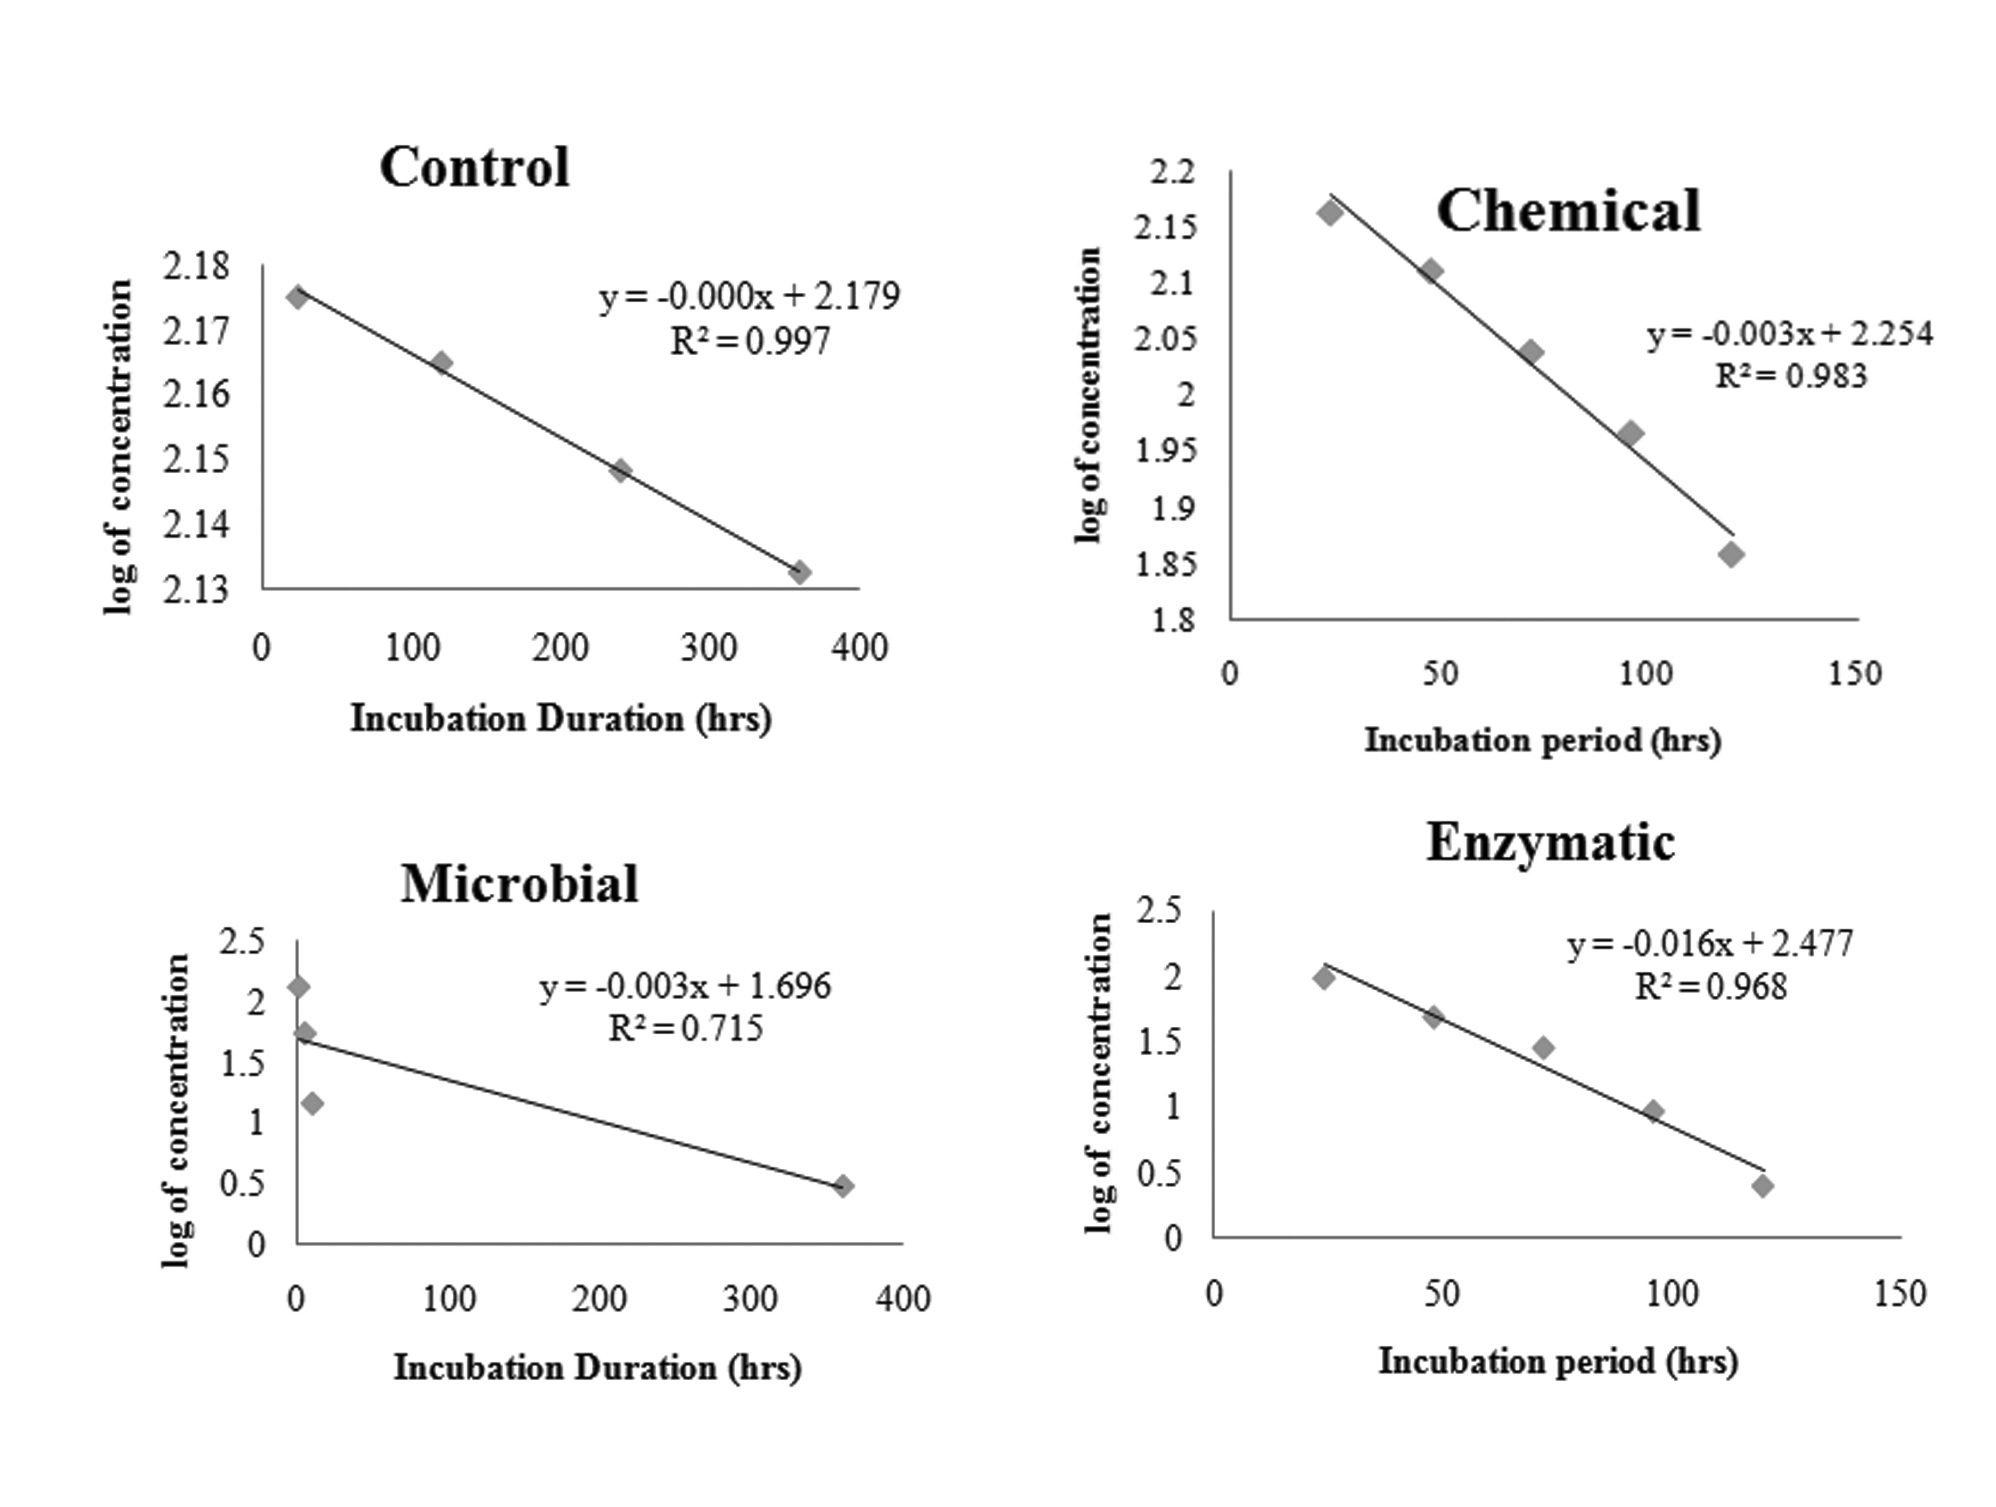
Kinetics of degradation was studied by plotting logarithmic residual MCP concentration as a function of time [16].
The results were further confirmed by HPTLC and FTIR.
Analytical Method: High Performance Thin Layer Chromatography (HPTLC) (CAMAG Linomat 5, Switzerland) was used for analysis of samples. The aqueous samples from MCP degradation flasks were extracted with ethyl acetate. The samples (20–25 ml) were inoculated on silica gel (60 F 254) TLC plates (E. Merck, India) using an applicator system. A twin trough glass chamber (20×20 cm) containing Dichloromethane: Methanol (9:1) as the mobile phase was used for development of the chromatogram. Spots were detected using a CAMAG TLC scanner-3 at the wavelength of 254 nm using a deuterium lamp.
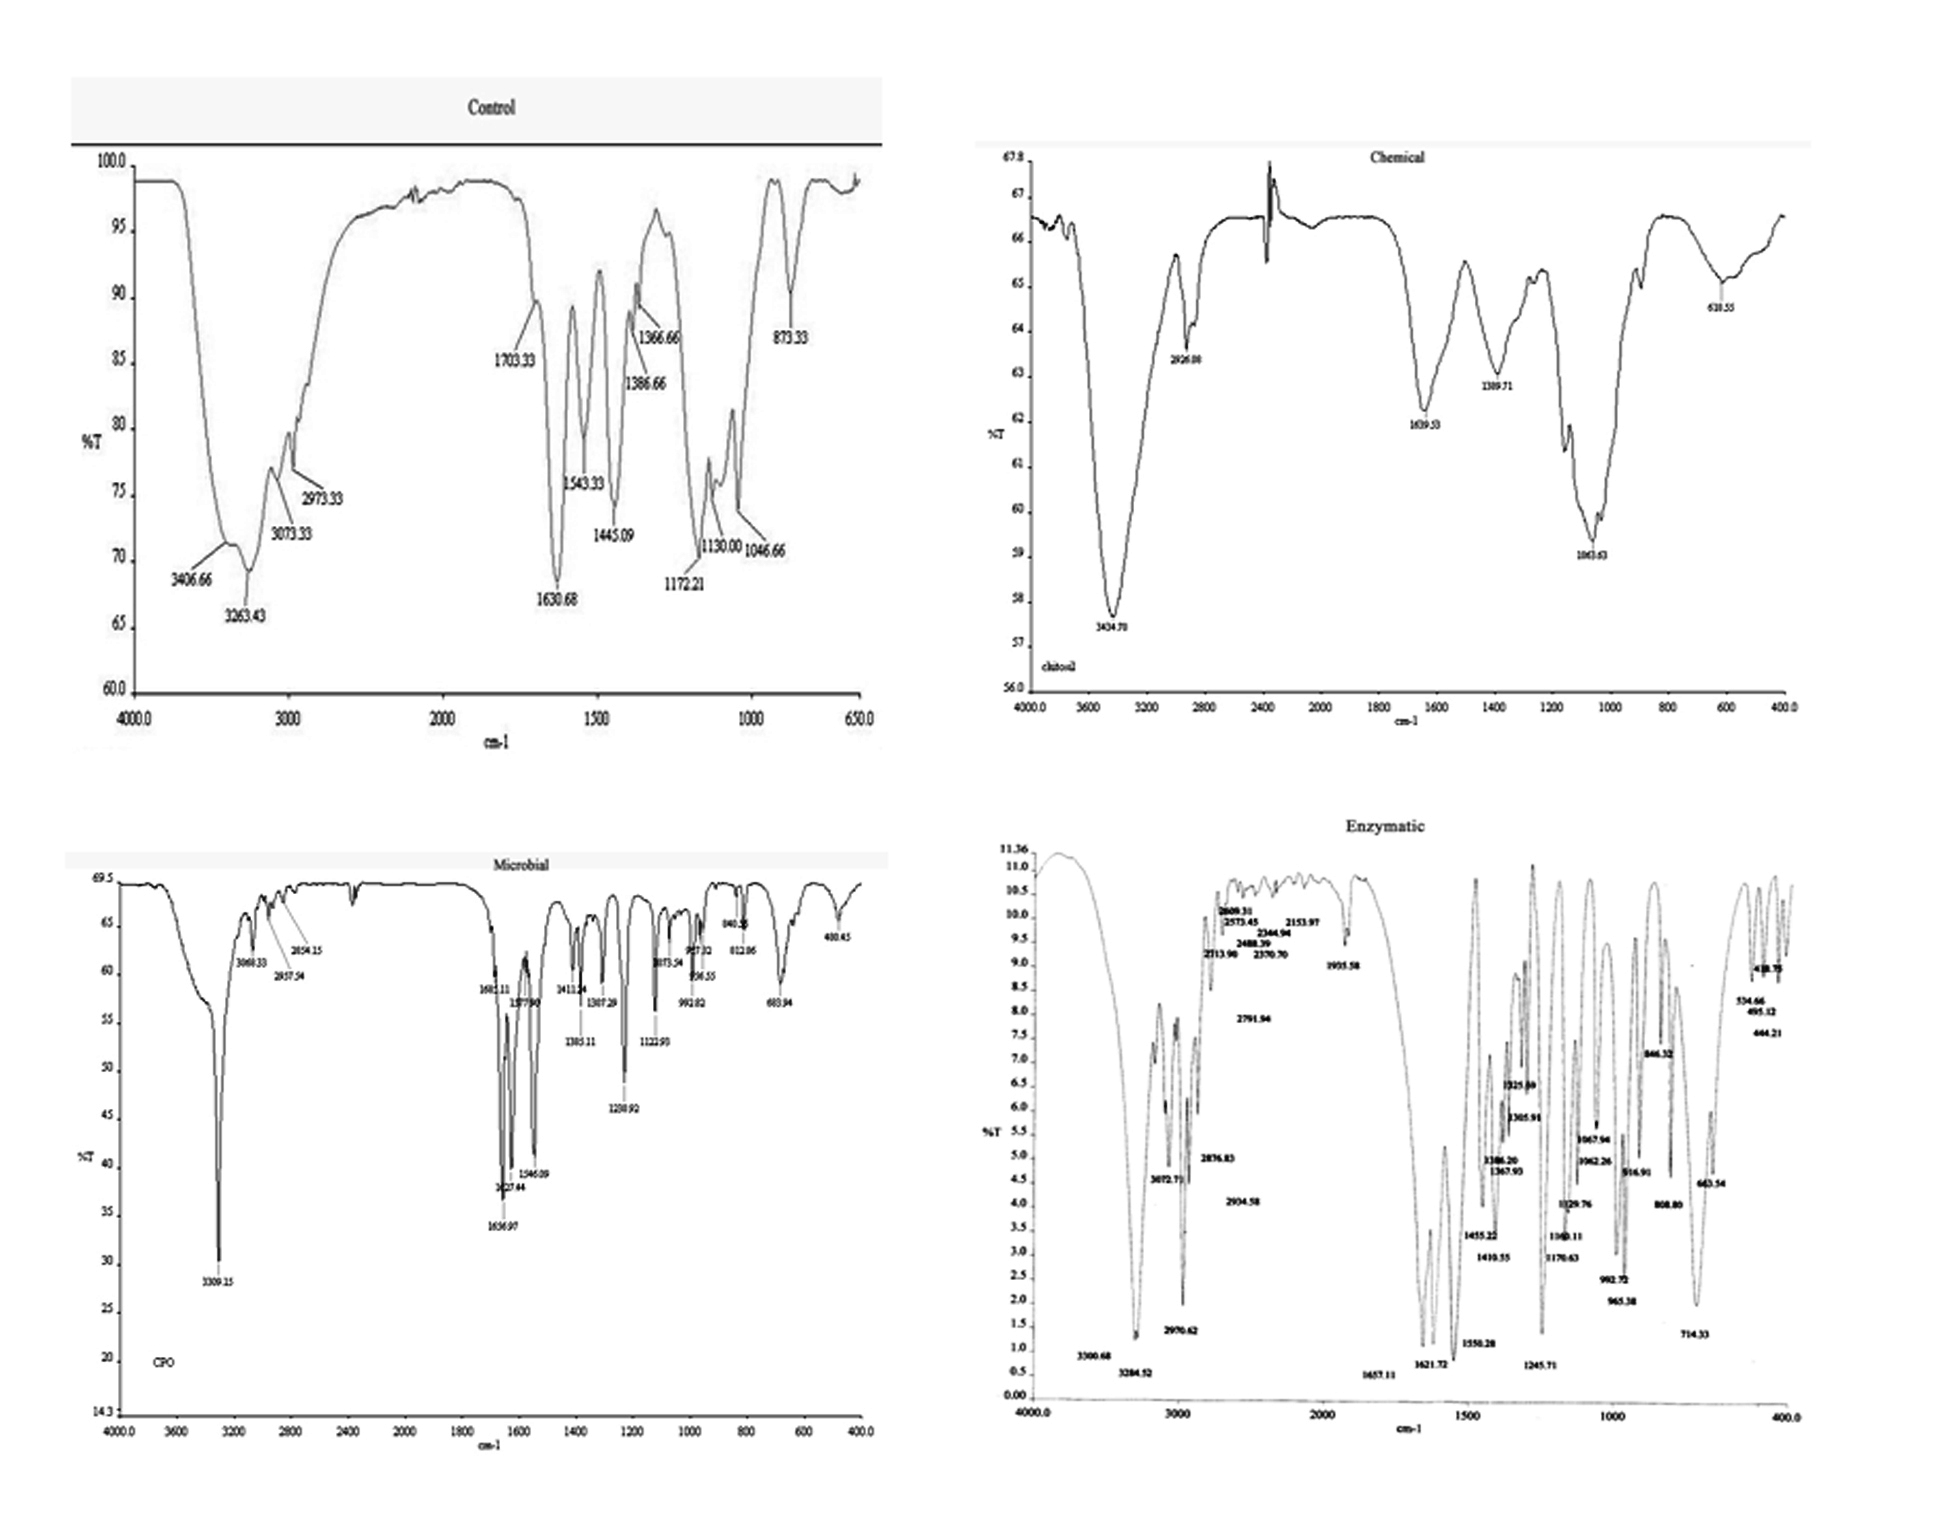
Infrared spectra of the parent compound (MCP) and sample after fungal degradation were recorded at room temperature (25 °C) in the frequency range of 4000–400 cm-1 with a Fourier transform infrared (FTIR) spectrophotometer (8400 Shimadzu, Japan, with Hyper IR-1.7 software for Windows) with a helium neon laser lamp as a source of infrared radiation. Aqueous samples (96 h of incubation) from MCP degradation flasks were extracted with ethyl acetate and solvent was evaporated using a rotary vacuum evaporator (Rotavapor R.214, Bu¨chi, Switzerland). The contents were re-dissolved in acetone. A drop of this sample in acetone was placed in between two sodium chloride discs, after cleaning with ethyl acetate. The background spectrum for acetone was corrected from the sample spectrum.
All the experiments were carried out in triplicates. The statistical analysis was done by using Statistical Package for the Sciences System 17 (SPSS 17). The variables were subjected to Student t-test and One Way ANOVA.
Aspergillus niger was grown in CZM medium containing 0.5 gmL-1 KH2PO4 for the production of extracellular enzyme secreted by the isolates. After 10 days of incubation period the medium was checked for the presence of extracellular enzyme. Intracellular hydrolase activity was also checked. It was found that Aspergillus niger possessed potent extracellular hydrolase activity (10.34 ± 0.2 U and Sp. activity 3.42 Umg-1) in comparison to intracellular activity (2.31 ± 0.01 U and Sp. Activity 1.12 Umg-1). Therefore the secreted fraction was collected and was partially purified by ammonium sulphate precipitation and gel filtration on Sephadex G- 100 and ion exchange chromatography. The data for the purification of the extracellular OP hydrolase was summarized in Table 1.
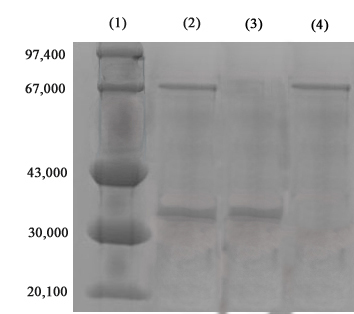
It shows that the purified enzyme showed a purification fold of 37.04 ± 3.07 with a percent yield of 55.37 ± 0.16. The enzyme activity was found to be 450.02 ± 2.64 U with the protein content of 5.26 ± 0.35 μgml-1. Hence the calculated specific activity of purified enzyme was 85.69 ± 6.29 Umg-1. Purified OP hydrolase composed of two different subunits. The molecular mass of each of the subunits as estimated by SDS PAGE analysis as shown in Figure 1 depicts that the enzyme was composed of two different subunits. These were found to be of approximately 33 Kda and 67 Kda molecular weight.
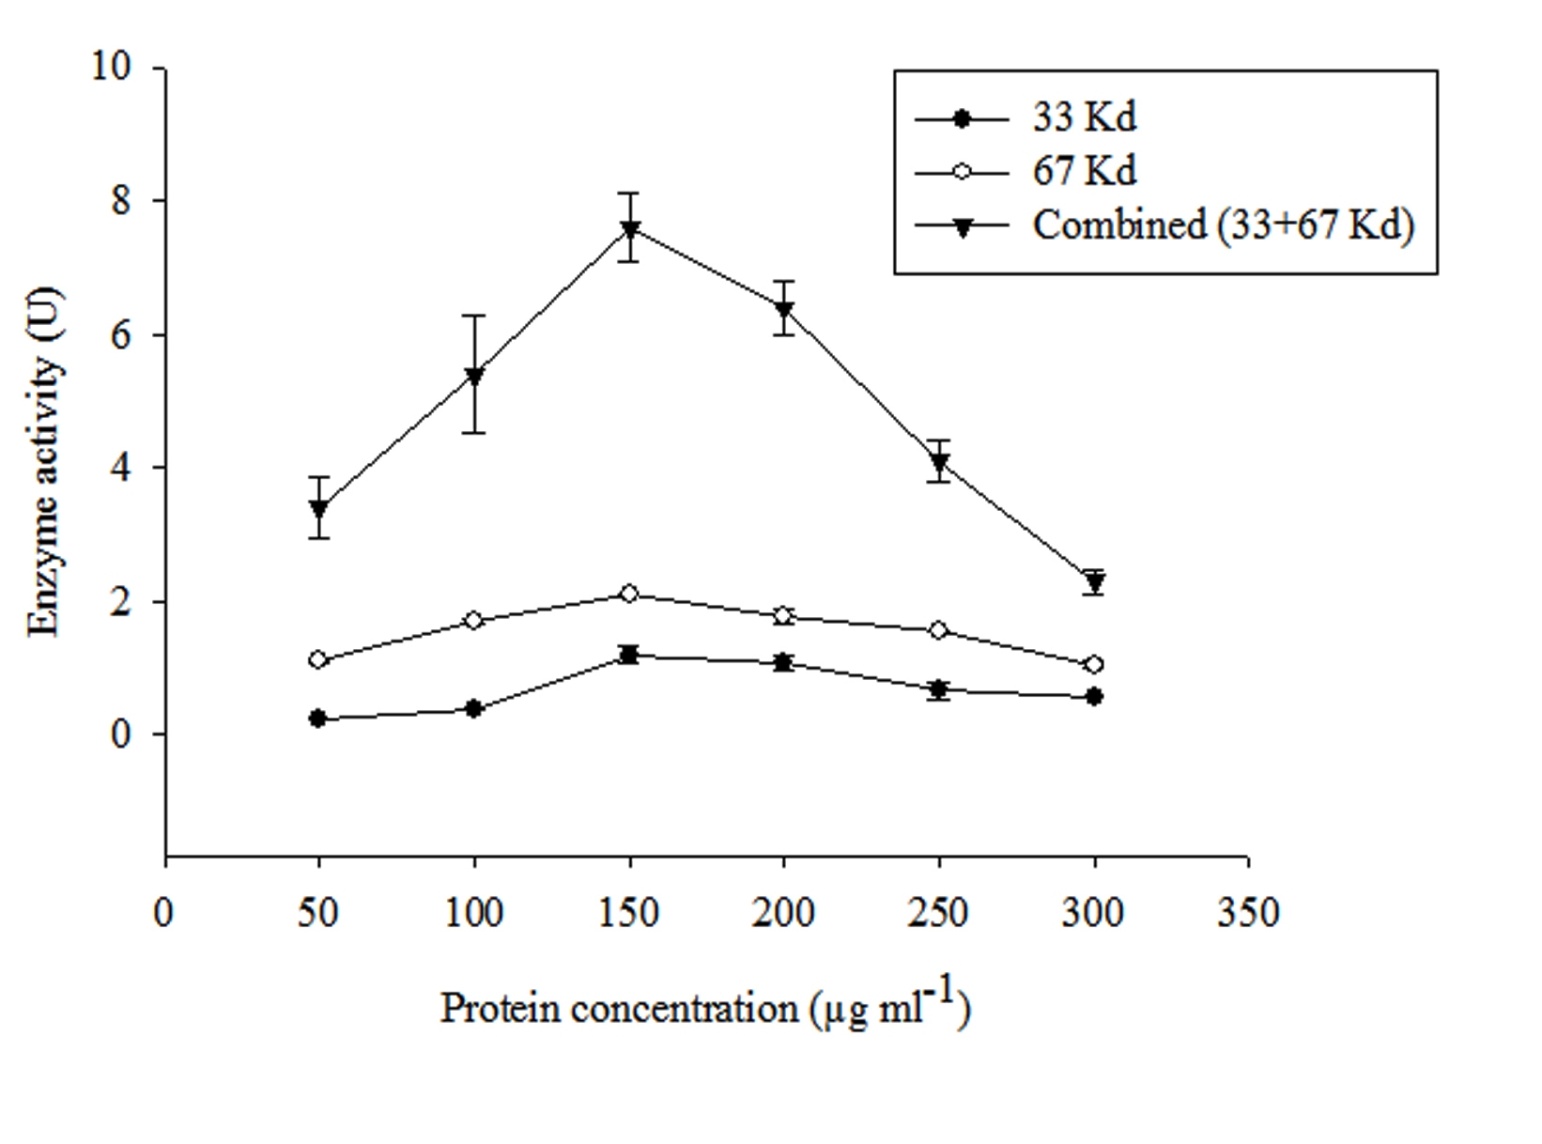
As depicted in the previous section hydrolase enzyme composed of two different subunits of different molecular weights i.e 33 and 67 Kda respectively. Therefore both these purified subunits fractions (individual as well as combined) were tested for their optimum concentration for the efficient degradation of MCP. The enzyme activity of all the three different protein fractions followed an L-shaped pattern. It is evident from Figure 2 that 150 μgml-1 is the optimum concentration among all the tested enzyme concentrations. Therefore, this selected concentration was used for further degradation study. Further it was also observed that combined fraction of both subunits showed high efficiency towards MCP degradation and hence showed high enzyme activity. Therefore, this fraction was further selected for the degradation of MCP.
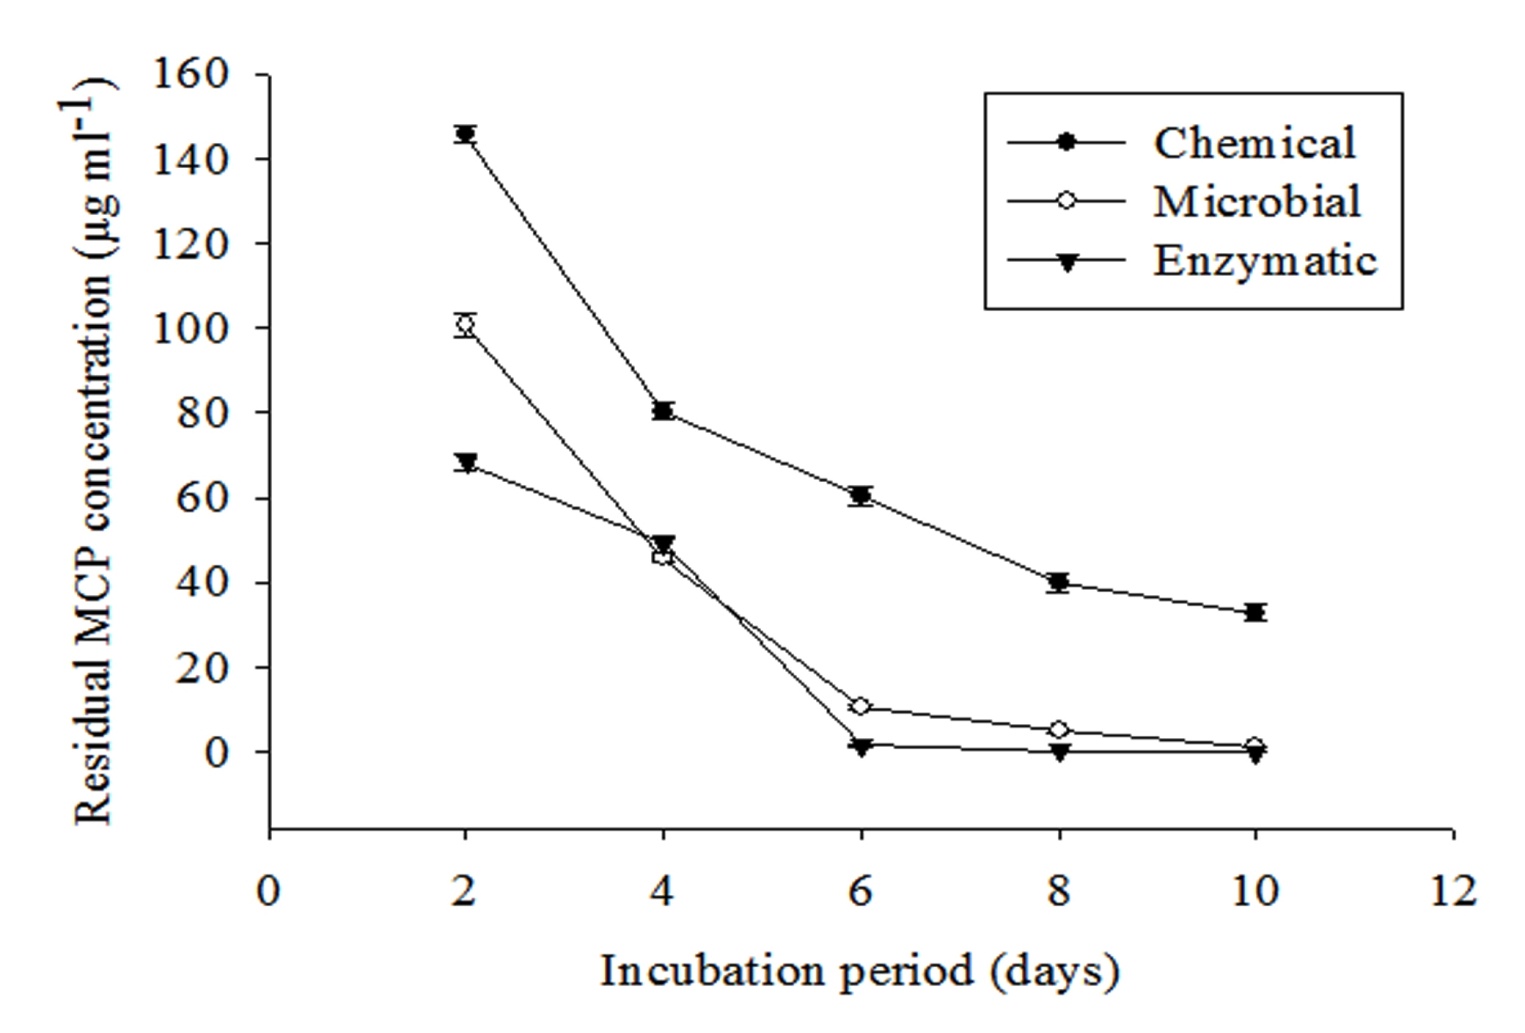
Degradation of MCP in phosphorus free liquid medium was studied by inoculating 1 ml each of 0.1 N NaOH, spore suspension and combined purified enzyme fraction. Residual MCP was extracted thrice with equal amount of ethyl acetate at an interval of 2 days. It is clearly evident from Figure 3 that residual MCP concentration decreases exponentially with increasing incubation period. Maximum decrease was found in the enzymatic method followed by microbial and chemical. Residual MCP concentration was found to be 40.77 ± 1.34, 2.45 ± 0.45 and 0.12 ± 0.001μg ml-1 for chemical, fungal and enzymatic methods respectively after 10 days of incubation.
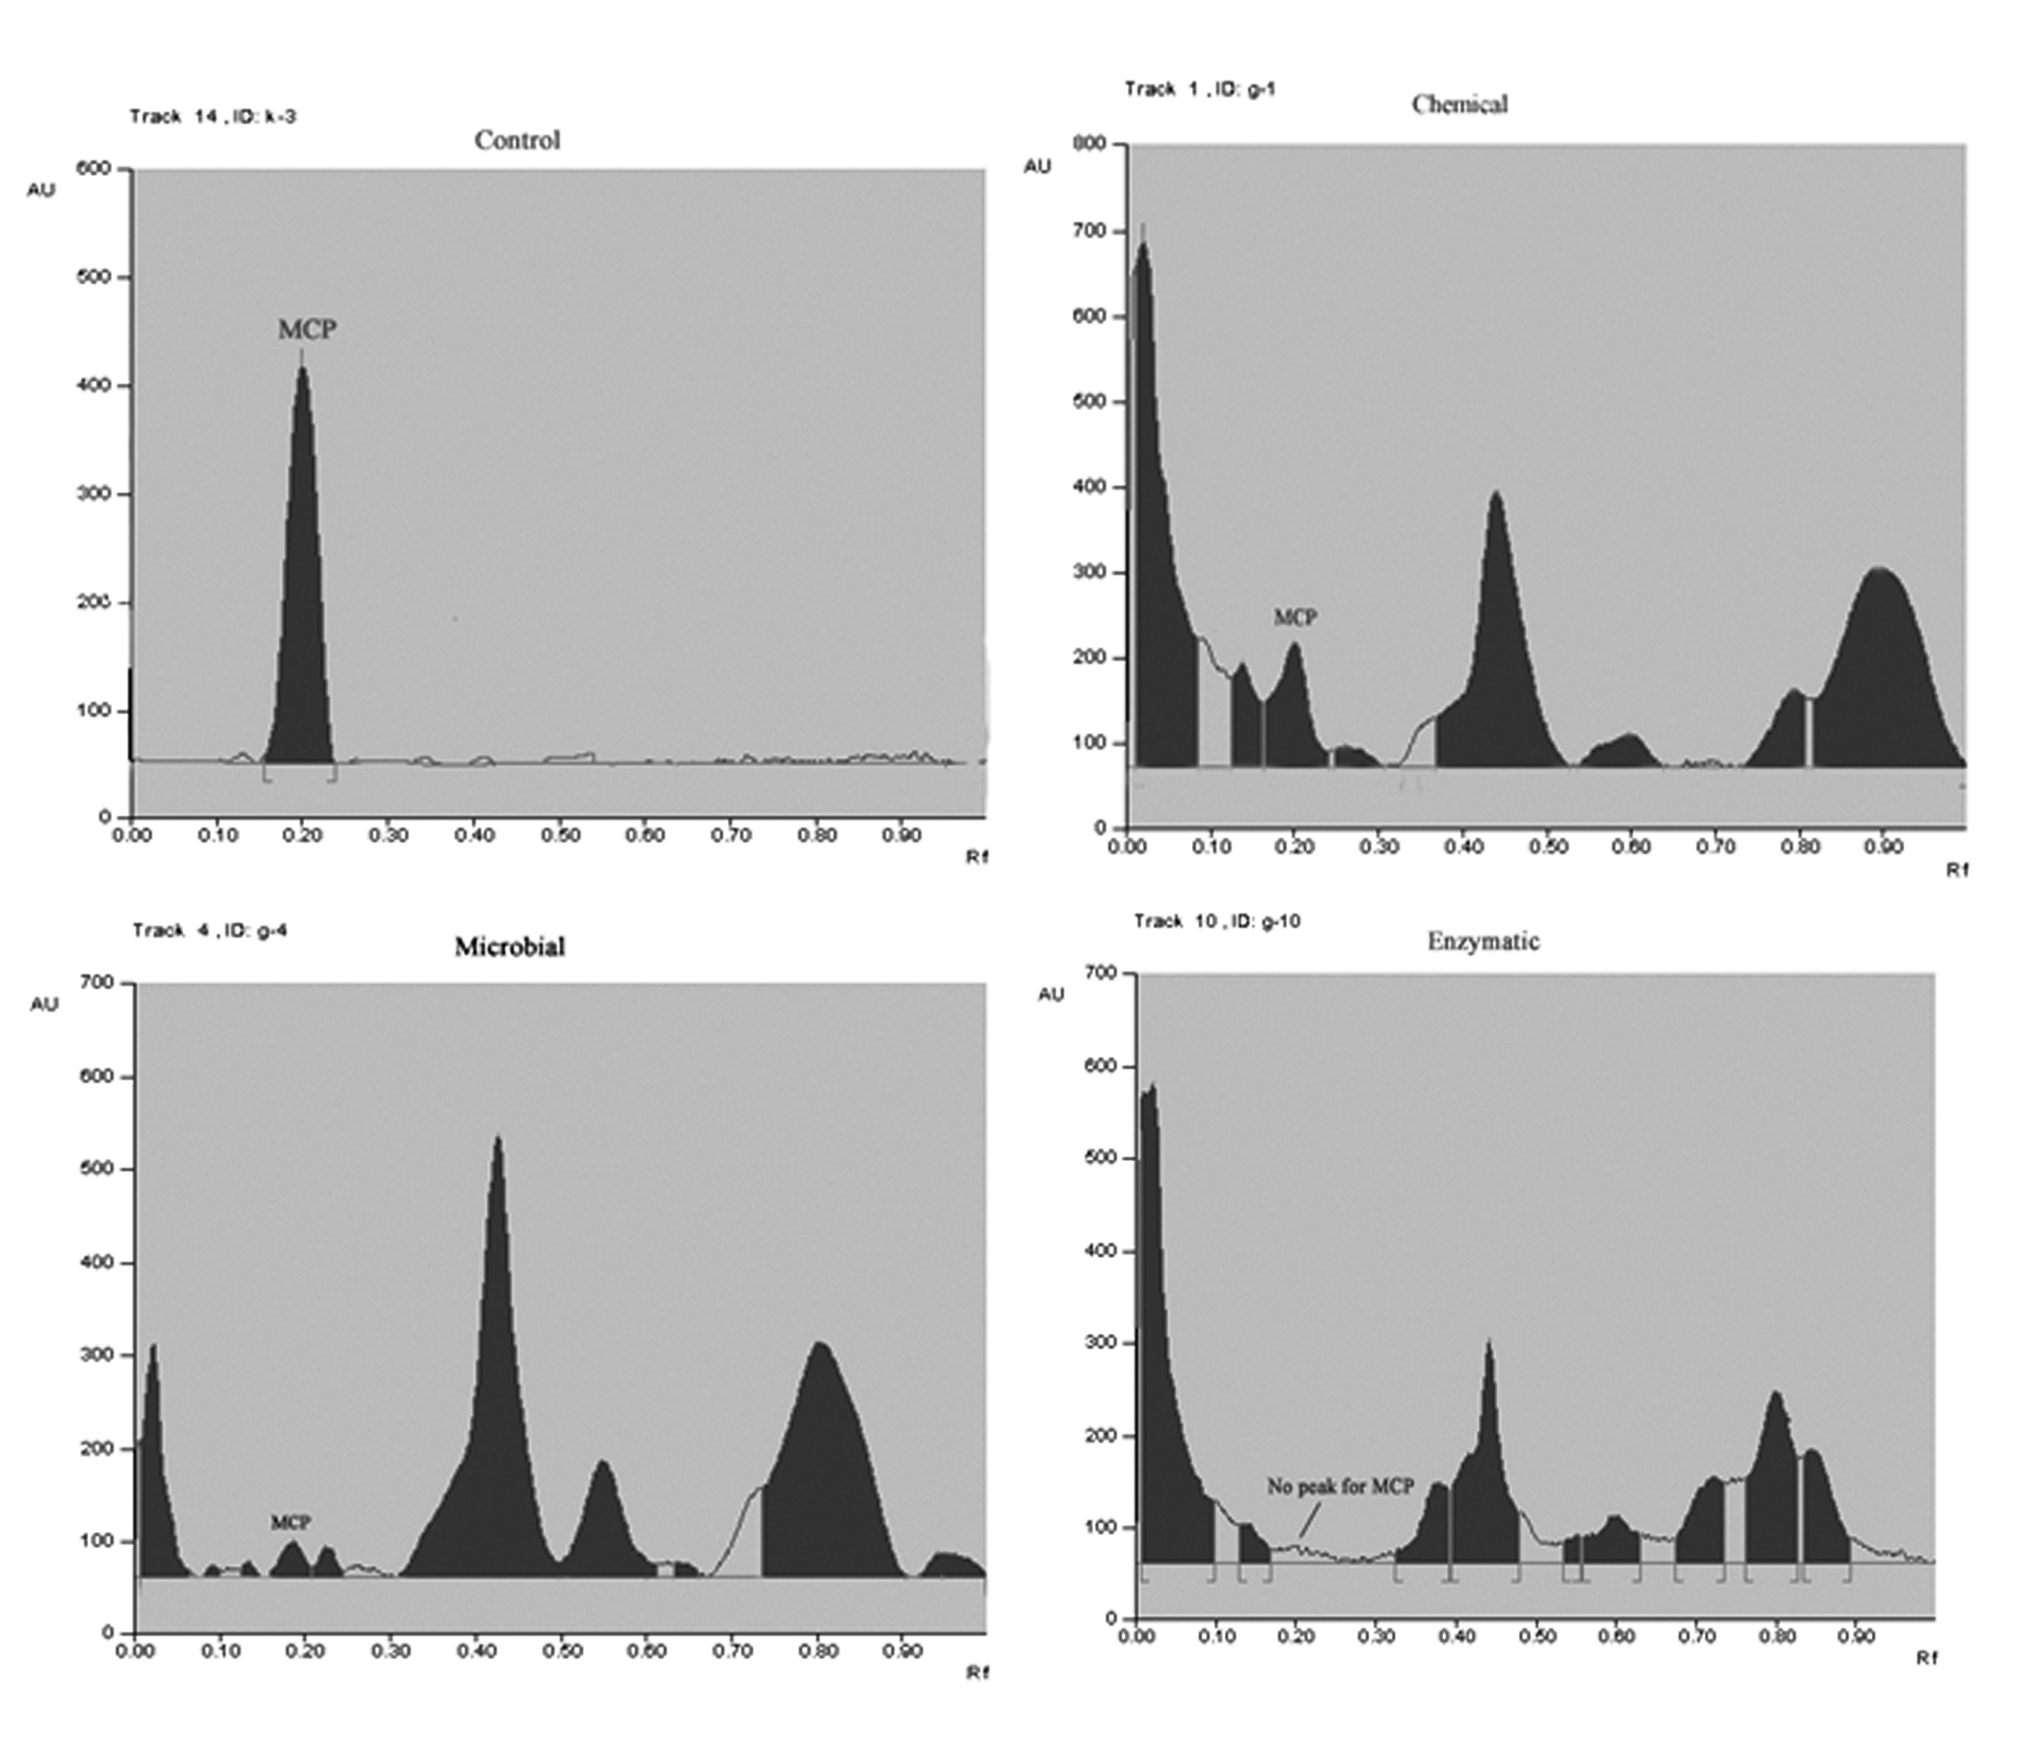
The results of spectrophotometric study were further confirmed by HPTLC. Figure 4 clearly indicate the visible significant decrease in the standard MCP peak with increasing incubation duration. Standard MCP peak was found at rf 0.19-0.21. No such peak was found after 10 days of incubation for enzymatic mode of degradation whereas, for chemical and fungal method short peaks were observed. This clearly indicates complete detoxification of MCP by extracellular fungal hydrolases from Aspergillus niger JQ660373. In addition to the standard MCP peak some other peaks were also observed which were characteristic of the by-products of MCP degradation. However these were not identified as much emphasis was given on parent compound degradation.
FTIR spectrum of MCP degradation as shown in Figure 5 clearly indicates hydrolytic cleavage of MCP with the formation of inorganic phosphates (–PO4). Peaks at 3406 cm-1 and 3263 cm-1 as visible in control samples were characteristic for vinyl bonds. These peaks were completely reduced in the spectrum after degradation. Whereas, a new peak at 1398.71, 1385.11 and 1367.93cm-1 was observed characteristic of inorganic phosphates. Some other peaks at 1063.63, 1073.54 and 1067.24 cm-1 were also observed which were characteristic for aliphatic amines. Some new peaks at a range of 1497.64- 1543.33 cm-1 characteristic for –NH or –NO were also pragmatic. It is also depicted from the figure that the number of peaks increased with enzymatic method as compared to fungal and chemical method as employed in the present study. It also signifies the efficiency of enzymatic method towards degradation of MCP.
Degradation kinetics of MCP followed straight line equation (Figure 6). Hence the rate constant and half life was calculated by using first order kinetics. The kinetic rate constants were observed to be 0.0069, 0.0092 and 0.037 day-1 and hence the calculated half life of MCP was 0.79, 3.16 and 4.21 days respectively for chemical, fungal and enzymatic methods respectively. The half life of MCP was significantly high (infinite) in control sample.
The present study is a comparative endeavor to find out the most efficient method for the degradation of MCP among the three commonly used methods viz. chemical, fungal and enzymatic. Molecularly identified fungal strain Aspergillus niger JQ660373 was used in the present study [16]. In the chemical method 0.1 N NaOH was used, as alkaline hydrolysis is a common method for the degradation of MCP [27]. 1 ml each of 0.1 N NaOH, fungal spore suspension and purified enzyme fraction was inoculated in 125ml of phosphorus free CZM medium for 10 days. It was observed that MCP was degraded exponentially and rapidly by enzymatic and fungal methods whereas, for chemical method the rate of degradation was low. After 5 days there was observed a lag period in case of fungal method and therefore comparative rate of degradation of MCP was found higher for enzymatic than for fungal method.
This clearly indicates that pure enzyme fraction could be easily used at contaminated sites for the removal of MCP. During chemical degradation MCP gets converted into N-methylacetoacetamide, which can be either directly measured or indirectly by the disappearance of MCP from the solution. Metabolic reactions taking place during the metabolism of MCP by microbial cultures are N-demethylation, O-demethylation, hydroxylation of N-methyl groups and cleavage of the phosphate–crotanamide linkage, [23,28,29], with the formation of O-desmethyl MCP monomethyl phosphate, dimethyl phosphate, N-methyl acetoacetamide and N-methylbutyramide. Although the basic mechanism of MCP degradation by enzyme fraction is not exactly known but it can be presumed that firstly MCP is broken down into secondary metabolite and then it is completely mineralized.
Fungal strain was tested for its intra as well as extracellular enzyme content. It was found that the strain possessed high extracellular enzyme activity. The high enzyme activity fraction was then purified by G-100 chromatography and SDS- PAGE analysis depicted that the enzyme was composed of two subunits of different molecular weight [26]. Both enzyme fractions were then separated by ion exchange chromatography.
Both fractions were individually as well as combined tested for their MCP degradation efficiency. It was observed that the combined fraction degrade MCP very effectively. There may be some synergistic association between these two fractions for the degradation of MCP.
To the best of our knowledge, it is the first study comparing the degradation rate of MCP by chemical, fungal and enzymatic methods. However, one such study was reported by [30], in which he compared the degradation rate of crude cell extract of mixed microbial culture growing on parathion with that of 0.1N NaOH. He had reported that rate of enzymatic hydrolysis of parathion was 2,450 times faster than that of the chemical method. He had also compared the activity of this crude enzyme preparation on other seven organophosphate pesticides viz. trizaphos, paraoxon, EPN, diazinon, methyl parathion, dursban, fenitrothion, cyanophos, azinophos-M, ethion, chlromephos and fenthion and reported that the rate of enzymatic hydrolysis was 1005, 525, 11, 43, 143, 122, 40, 205 and 73 times higher than that of the rate of chemical hydrolysis.
Although there are a number of individual studies on the degradation of MCP by different fungal isolates and enzymes but studies on chemical hydrolysis of MCP are scarce. [27] had studied alkaline hydrolysis of MCP in blood samples.
73.33, 98.36 and 99.25% of MCP was degraded within 10 days of incubation by chemical, fungal and enzymatic method. [17] had reported 91, 75 and 79% of MCP degradation by Aspergillus flavus, Fusarium pallidoroseum and Macrophomina sp. within 15 days of incubation. [14], 2009 had reported the ability of Aspergillus oryzae to completely mineralize MCP (1000 mgL-1) in M1 medium within 168 hours of incubation. Similarly [12] had also reported 75% and 50% degradation of MCP (200 mgL-1) within 4 days by Aspergillus and Penicillium sp. respectively.
On the other hand [26] had also reported efficient and rapid degradation of MCP by five distinct extracellular hydrolases isolated from five different fungal isolates.
The results were further analyzed by HPTLC which clearly demonstrate significant reduction in the standard peak of MCP (rf 0.19-0.21). Some new peaks were also seen in addition to the standard peak which might be due to the metabolic products of MCP degradation. However, these were not identified as the emphasis was given on the disappearance of MCP by fungal isolates. Molecular insight of MCP degradation clearly indicated the cleavage of vinyl bond with the formation of new peaks characteristic of –PO4 in the FTIR spectrum. The results were concurrent with the study of [14,17,26] which also correlated degradation of MCP by reduction of its peak as compared to that in the standard chromatogram by hydrolytic cleavage.
Similar to the earlier reports of [14,16,26,30,31] degradation of MCP followed first order kinetics with a half life of 0.79 days in enzymatic method as compared to 3.16 and 4.21 days for fungal and chemical method. This clearly demonstrates the efficiency of extracellular enzymes for MCP degradation. Concurrent with the studies of [17,26] the half life of control sample was found to be infinite and therefore clearly ruled out the possibility of auto degradation.
Concurrent to our study [17] had reported the half-life of MCP to be 4.21, 12.64 and 6.32 days for Aspergillus flavus, Fusarium pallidoroseum and Macrophomina sp. respectively. Simultaneously, [16] had reported the half-life of MCP as 75.87 h by Aspergillus niger. The calculated half life of MCP was found to be 0.79, 2.11, 0.6, 1.8, and 2.11days respectively for five distinct fungal hydrolases by [26].
Hence the study concludes that enzymes proved themselves to be the most efficient tool for the degradation of MCP in liquid culture medium. The overall order of degradation effeciency was found to be Enzymatic > Fungal > Chemical.
This work was financially supported by the Department of Bioscience and Biotechnology, Banasthali University, Rajasthan, India, that is gratefully acknowledged.