Diagnosis Profile and Therapeutic of Hepatocellular Carcinoma (HC)
Objective: Showing up the epidemiological aspect, in clinic or para-clinical and anatomopathological ways of first cancers of liver.
Patients and Methods:Retrospective study with descriptive including all medical records for the patient aftercare for the first cancers of liver in the Carcinology and Radiotherapy Service of the Brazzaville Teaching Hospital from January 1st 2010 to December 2014. We studied the relative frequency with the age, the sex, discovery circumstances and some elements of clinic exam, Para-clinical data, the anatomopathological, the classification and the evolution.
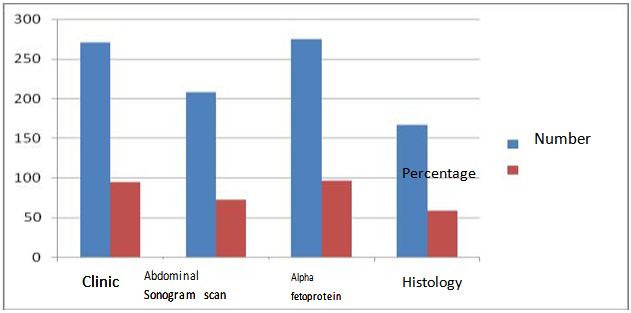
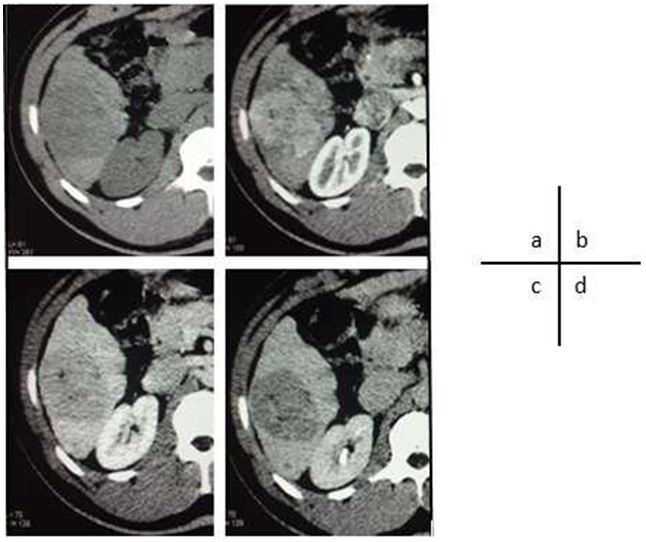
Results:Two hundred and eighty six (286) patients of medium age around 45.02 years old within the two sexes to the extremes of 20 and 72 years old. We noticed that there was male predominance of 201(70.27%). The diagnostic circumstances were given by an abdominal mass 286 (100%) often associated with an icterus in more of 50%. The clinic exam was suggestive 271(94.75%). The abdominal sonogram scan showed up a big hetero-multinodular liver 208(72.72%); the ascites 119(41%). The tom-densitometry reveal a taken of liver with contrast in arterial. The alpha fetoprotein was increased to a volume of 257(89.86%) its serum concentration was on average at 988 ng/ml. One hundred and sixty seven (167) patients that is to say 58.39% had an anatomopathological proof. Analgesic Radiotherapy could not be performed. Following the six (6) months of the first symptoms appearance of 209(73.07%), the evolution to death was inevitable.
Keywords: Epidemiology; Clinical; Paraclinic; Hepatocellular Carcinoma; Brazzaville
The Hepatocellular Carcinoma is a dreadful complication of chronic diseases of liver. It is the third cause of death in connection with cancers and its burden goes with an increase number [1-3]. The epidemiology of the HC in the world is contrasted. For instance, in the north countries, the HC is usually of precocious discovery within the context of cirrhosis aftercare and that is the main subject of the elderly [4,5]. We stood back on the HC study with an increase incidence in carcinology and radiotherapy service to young predominance subject. It seemed to us important to lead a study which the objective was to determine the relative frequency and to show up the epidemiological aspect, clinic and anatomopathological of the HC.
It was about a retrospective study with descriptive on 5 years, from 01st January 2010 to 31st December 2014 including those who have the first tumor of liver in carcinology and radiotherapy of Brazzaville Teaching Hospital.
Being eligible for the study of the suffering patients of abdominal mass having been attached to a HC with clinical evidence, biological, morphological and/or histological which ought to be file and saved the cancer register of Brazzaville as a HC.
We did study the data following the age, the sex, clinical aspect, biological, morphological, anatomopathological, the spread and the evolution. Thus, we did the calculations of frequency, average by using EPIDATA 3, 1 and EPI INFO 3,5,3,0. As for the variables of certain comparison, we used the X² test of tendency and of Pearson. Note that the X² test was significant if p is smaller than 5%.
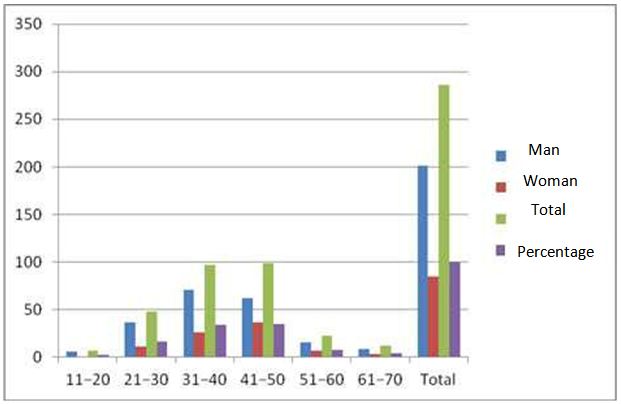
During five years, we saved 2,927 new cases of cancers of Brazzaville, which 286 cases of HCC that is to say 9.77%. The middle age among the two sexes was of 45.02 years with the 20 and 72 years extremes: 201 men and 85 women. The histological confirmation rate was of 167(58.39%). Board I/Diagram 1: Epidemiological Characteristics.
The medical histories were: the hepatitis 9(3.14%), cirrhosis as 6(2.09%), alcoholism 102(35.66%). The middle deadline of office hours was of six (06) months. The peritoneum liquid was bleeding or hemorrhage 45(15.73%), citrine-colored-yellow 74(25.87%). Board II /Diagram 2: Clinical Characteristics Biological and anatomopathological Data
The alpha fetoprotein was increased in the number of 257(89.86%); with an average of its serum concentration of 988 ng/ml. The research of AgHBs was positive in 217(75.87%). The antibody anti-VHC were presents in 45(15.73%) of cases. The echo-guided puncture hepatitis made with a sharp needle 68(23.77), the biopsy hepatitis puncture 99(34.61%). Board III: Histological Types
The abdominal sonogram scan was made to 208(72.72) and we found a big multi-nodule liver, hyperechogenas, of big size of 158(55.24%). The abdominal tom-densitometry was made in 30 (10.5%). The standard radiotherapy of thorax has found back a pleuropneumonia location of 72(25.17%); the standard radiotherapy of skeleton 68(23.77%).
A distance bone location 72(25.17%), pleuropneumonia 68(23.77%). The hospital was mentioned as the third recourse to 126 (76.36%). Then, we said that the evolution was inevitable within the six (06) months following the appearance of the first symptoms in 209(73.07%) whether by hepatitis encephalopathy 81.3% or whether by digestive bleeding 12.4%, severe cachexia 6.3 %. Board IV: classification according BCLC (Barcelona Classification).
Thanks to this study, we estimated the incidence on 5 years of the HCC; it is of 286 new cases that is to say 9.77%. In fact, a smaller incidence has been reported by Gombé in 1981 within an epidemiological study. That could be accounted by the role of Brazzaville cancer register which since its creation in 1996 helps us to record all the new cases cancer of Brazzaville [6].
The middle age among the two sexes was of 45.02 in our series and according to the literature that means the zone age where we can the high incidence [4,7 ,8]. Also, male predominance is noticed in our series with a sex-ratio of 2.36 which goes with the literature [7-9].
The most common medical histories were about alcoholism to 35.66% of viral hepatitis B 3.14% and of the one well-known cirrhosis 2.09%.
The clinical signs are for the most specifics; but, some of them are however an indicative value of carcinomatous transformation of the cirrhosis. The loss of weight associated with asthenia is common 70%. The abdominal pain located with the right hypochondria 72% appearing in a cirrhosis context well-known must evoke the diagnostic. The hepatomegaly, quickly increasing, hard, irregular and painful is another evocative sign 100% in our series. As for the ascites, his bleeding characters 15.73% and citrine-colored-yellow 25.87% and his resistance through classical therapeutics are some aspect elements. All those signs prove the data already available in the literature [9].
Yet, to recall the alpha fetoprotein dose was significantly high 89.86% with a serum concentration average of 988 ng/ml ; the AgHBs research was positive in 75.87% and the antibody anti-VHC were presents too in 15.73% of cases in our series. Our results may be superimposed to the one which reported in a study on hepatocellular carcinoma in Burkinabe milieu [4,10]. But they are discordant with the European and American series [11]. In this way, it could be explained by the prevalence of hepatitis B virus in our environment.
The puncture made with the sharp needle in 23.77% of cases, the hepatitis biopsy puncture echo-guided 34.61% of cases without making significant difference statistically with p < 0.05.
An anatomopathological confirmation rate estimated around 58.38% of cases. The coagulation often disturbed is an obstacle of biopsy puncture of liver in our context.
In addition, the histology or the cytology after the echo-guided puncture; the technic which is recognized by the entire author without danger and reliable when it is made by an experienced operator and with a sharp needle [4,12]. Reynard really observed any significant difference between the results obtained by cytology analysis and those obtained by histological analysis [4,13]. Therefore, the histology is only necessary when the nature of hepatitis lesion is doubtful.
We can remind too that the abdominal sonogram scan was made to 72.72%. In fact, our study has been focus more and especially on the nodule tumors, hyperechogenas, several and with a majority of big size: 9.6 cm (04-18 cm), true characters to those find in Ivory Coast and in Burkina Faso [4,14]. On the contrary, in the occidental series, the HC are of small nodule lesions of less than 3cm isolated which increase progressively of size and more frequently hypoechogenas and homogenous [15]. One of our arguments to explain this difference is the early detection of small size of HC observed in those countries of high technicality of means of medical imaging; in particular in the population with risk of cirrhotic. The Tom-densitometry which we find in most of the image cases hyper arterial vascular.
A distance bone location 72 (25.17%), pleuropneumonia 68(23.77%), with more of the half of our patients were at the terminal stage according to the Barcelona Classification (BCLC). In fact, HC is at present in the descendant malignant osteophyte tumors [16]. No patient has benefited from innovative therapies because of the advanced stage of the disease at the time of diagnosis [17]. The evolution was inevitable within the six (06) months following the appearance of the first symptoms in 73.07% of cases, whether by hepatitis encephalopathy 81.3% or whether by a digestive bleeding by rupture of esophageal varicose vein in 12.4% of cases, the severe cachexia in 6.3% of cases. This is exact copy of the data of the literature [7,9].
It arises from this study an increased relatively frequency of HC through young, we can add that by saying the diagnostic was late, that gives the meaning of our safety lies in the prevention of the HC. Hence, the interest of vaccination against the hepatitis B which is already included in the WPV (Wide Programme of Vaccination), with some measures of public awareness against the infection by hepatitis C.