Effect of Time, C/N Ratio and Molasses Concentration on Saccharomyces cerevisiae Biomass Production
Yeast is one of the potential microorganisms to be utilized as a feed supplement for animals due to its high nutritional value, mainly protein and organic matter content. It could be used for varieties of substrates of agricultural and industrial byproducts. Yeast utilization into animal diet would improve the intestinal environment, especially on digestibility tract, prevent colonization of pathogenic bacteria in small intestine, and also systemic immune functions. To be more proof, this experiment was to introduce and to promote the yeast biomass of Saccharomyces cerevisiae as growth promotor to improve the animal feed nutrition. The experiment was conducted by nested model with 3 replicates to determine the effects of time, carbon and nitrogen ratio (C/N) and molasses concentration within C/N ratio of the growth medium on yeast biomass. The molasses concentrations could be used from lowest to highest, while different levels of urea levels of 0.5, 1.0, 1.5 and 2.0% were used to calibrate the ratio of C/N in the medium for the grow of yeast.
As the result, variations in fermentation time had the greatest impact on the biomass of Saccharomyces cerevisiae. The best fermentation time for obtaining optimum production of yeast biomass to be at 24 h. Biomass of yeast was highest at C/N ratio of 10/1 reached 6.68 g L-1. At a concentration of molasses at 35.00 g within C/N ratio of 10/1 gave highest biomass of yeast, reached 7.57 g L-1.
Keywords: Biomass of Saccharomyces cerevisiae Yeast; Molasses; Urea Levels
Saccharomyces cerevisiae has been used to produce foods such as bread, wine, sake and beer by human. In recently times, Saccharomyces cerevisiae was used to produce single cell protein as an animal feed supplement in animal production [1]. In monogastric animals, the use of live yeast to improve feed nutrition has become more popular when the Europe bans using antibiotics since 2006 as an antibiotic growth promoter in animal production. Any application of antibiotic as growth-promoters in the animals feed would improve the resistance of pathogenic bacteria to antibiotics that may be used in clinical or veterinary practice (Hughes, 2004). Maron, et al., 2013 also indicated that U.S restricted any antimicrobial use, following to scientific evidence to preserve the efficacy of antimicrobial drugs for treatment of infections in humans and animals [2,3].
Use of Saccharomyces cerevisiae to the diet of pigs affected the intestinal environment, improved growth rate and digestibility, prevented colonization of pathogenic bacteria in small intestine, and increased systemic immune functions [4-6]. There have been several studies on the use of Saccharomyces cerevisiae to ferment cassava pulp and root for animal feed [7-9]. The result of those studies suggests that cassava root and cassava by-product can be nutritionally improved with Saccharomyces cerevisiae for animal feeding. Tefera T, et al. (2014) also reported that fermentation of cassava root meal with starter cultures of yeast of Saccharomyces Cerevisiea resulted in elevation of crude protein (CP) and decreased pH, free cyanide (FC) and moisture contents. However, in order to increase biomass of Saccharomyces cerevisiae, the substrate must have enough soluble carbohydrate and nitrogen for the growth of yeast cells [10]. Danesi, et al. (2006) reported that the type and concentration of carbon and nitrogen sources, as well as the C and N ratio of the medium for Saccharomyces cerevisiae cultivation influence cellular growth [11]. The results for cell concentration demonstrated that the use of sugarcane blackstrap molasses and yeast extract at a C and N ratio of 10 gave the highest biomass of yeast. Yeasts of Saccharomyces cerevisiae usually can use some of the amino acids in molasses, but addition of nitrogen sources from urea is required. Pretreatment of yeast with urea solution enhanced the ability of yeast cell to use urea and elevated the biomass yield [12,13]. Manikandan and Viruthagiri (2010) reported that nitrogen source, nitrogen concentration and carbon to nitrogen ratio affect biomass concentration [14]. Supplementation of yeast into the animal feed may boost ADG, augment mucosal immunity, promote intestinal development, adsorb mycotoxins, and reduce post-weaning diarrhea and improvement of immune modulation [15-17]. The feed with supplementation of live yeast may result in increased villus heights and villus-to-crypt ratios which would increase the internal surface of the intestinal walls making available a greater surface area for absorption [16,18]. From the above reason, the study therefore aimed to examine the effect of time, C/N ratio and molasses concentration in the growth medium on yeast Saccharomyces cerevisiae biomass production.
Feed Active Dry Yeast of ICFOOD Company was used in this experiment. One gam of yeast was diluted with sterile distilled water in the range of 10-1 to 10-8 for testing density of yeast in the product. Urea were originated by the companies, distilled water was produced in the Hue University Agriculture and forestry by water distillation machine directly connected with tap water while molasses of the by-product of sugar manufacturing was used.
The experiment was designed by nested model with three replicates.
Calculation C/N ratios as below:
Bacteria and microorganisms use carbohydrates (sugar, starch and cellulose) as a food to generate energy and to grow to produce proteins and new cells. The percentage of the assimilated carbon with respect to metabolized feed carbon, is defined as the microbial conversion efficiency, and is in the range of 40-60% [19]. According to Willett and Morrison, (2006), molasses is approximately 40% carbon [20]. Therefore, in order to get C/N ratio of 5:1, molasses requirement is 25/1. At urea 0.5% contains 0.23 g N, so that added molasses to medium is 0.23 x 25=5.75 g, the remain of water and yeast is =100-(0.5 g urea + 5.75 g molasses) = 93.75 g. The calculation for C/N ratios of 10:1 and 15:1 is similar.
The medium for growing of yeast consists of molasses, urea and water. The carbon source used in all experiments came from one sole of molasses. Urea was used as the only nitrogen rich substrate. The molasses and water were autoclaved at 121˚C for 15 minutes, then cooled and the urea added to the medium (Table 1). The necessary quantity of raw molasses and nitrogen were calculated as in Table 1.
Serial tenfold dilution from 10-1 to 10-8 of the yeast suspensions were cultured on Yeast Extract Peptone Dextrose (YPD) agar plates containing 10 g L-1 yeast extract, 20 g L-1 peptone, 20 g L-1 glucose and 20 g L-1 agar and incubated for 48 h at 30 ˚C and monitored for 3 days. All the plates containing from 20-300 colony on the plate were counted.
The number of colony forming units (CFU), standing for (N) can be calculated by using equation:
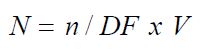
Where:
n = number of colonies forming units on a plate counted; DF = dilution factor; and V = Volume of sample.
One g of yeast was cultured in 100 mL YPD medium at 30 ˚C for 24 h. Then 100 μl YPD medium containing yeast were cultured on YPD agar at 30 ˚C for 3 days. After that, three colonies on those plates were randomly selected as pure colonies for culturing on YPD medium to collect biomass cell for extract DNA. The genomic DNA of the yeast was extracted using the QIAamp DNA Stool Mini Kit. Genomic DNA was stored at 4 ˚C until analysis.
Two universal fungal primers (ITS1: 5’-TCCGTAGGTGAACCTGCGG-3’ and ITS4:
5’-TCCTCCGCTTATTGATATGC-3’) were used to amplify ITS region of fungi. The PCR amplification reactions were performed in a total volume of 50 ml. Each reaction mixture contained 2 ml of template DNA solution, 50 pmol of each primer, 250 mmol of each dNTP and 2 ml of polymerase (Taq Polymerase and Taq gold DNA Polymerase; Perkin Elmer, Foster City, Calif., USA; Taq DNA polymerase, Qiagen, Hilden, Germany; Taq polymerase, Sigma, St Louis, Mo., USA) in an appropriate reaction buffer specific for each enzyme. The PCR was carried out in a MJ MiniTM Personal Thermal Cycler (BioRad) using the following program: 95 ˚C for 5 min, followed by 35 cycles consisting of 90 s at 95 ˚C, 45 s at 50 ˚C and 90 s at 72 ˚C. The last extension step at 72 ˚C was 5 min long. PCR products were stored at 4 ˚C before checking by electrophoresis. The final PCR products were checked in 2% agarose gels.
PCR products were sent to Macrogen Korea for sequence by Viet A Medical Company.
Experiment was carried out in 250 mL flasks containing 150 mL of culture medium, an initial cell concentration of 1.0 g L-1. Cultures were incubated on a rotary shaker at 180 rpm and 30 oC for 28 h. Molasses was used with different levels, corresponding to C: N ratios of 5, 10 and 15. Urea was used as nitrogen rich substrate at different concentrations of 0.5, 1.0, 1.5 and 2.0%.
Samples were withdrawn at 0, 4, 8, 12, 24 and 28 h of cultivation for determination of cell biomass. Cell biomass (X g L-1) was determined according to Danesi, et al. (2006) [11]. 15 mL of cultivation was filtered through a 0.45 μm acetate cellulose membrane (Millipore, Bedford, MA). The cell biomass expressed as g dry cell L-1, was measured by drying the cell cake until constant weight (105 ˚C for 2 h). The overall cell productions (X g L-1) were calculated according to equation:
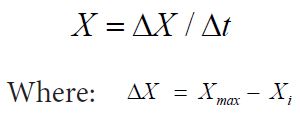
Xmax is the maximum cell concentration (g L-1), Xi the initial cell concentration (g L-1).
Δt = (tf - ti), tf is the time corresponding to the maximum cell concentration; ti is the initial cultivation time (h).
Data were analyzed by nested design of the SPSS software. The model is:
Y= mean + time + C/N ratio + molasses within C/N ratio + e
With this model we can answer effects of time, C/N ratio and molasses within C/N ratio on yeast biomass production.
The result on density of yeast in Feed Active Dry Yeast of ICFOOD Company was presented in Table 2. The number of colony forming unit (CFU)/g of yeast in the product from 21.84 x 10⁹ to 21.88 x 10⁹. This result was consistent with the result of the yeast cell density recorded by the manufacturer.
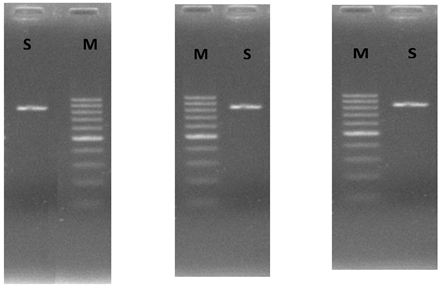
Amplification of the ITS region yielded clear products without by-products, for all three samples of DNA band with a size of approximately 800 bp as determined by electrophoresis in 2% agarose gels (Figure 1).
The results in Table 4 show the effect of time on biomass of yeast. Continuous increment in fermentation time led to a significant increase in quantity of biomass of yeast produced from 0 to 24h. Biomass increased at each 4hour interval, from 1.00 g L-1 to 6.82 g L-1. There were significantly difference on biomass of yeast from 0 to 12 h (p<0.05). Biomass was highest at 24 h, reached 7.91 g L-1 and had tendency reduce at 28 h, reached 7.62 g L-1. However, there were no significant difference on biomass of yeast at 24 h and 28 h (p>0.05).
The effect of C/N ratio on Saccharomyces cerevisiae was displayed in the Table 5. There were significatly differences (p<0.05) in biomass of Saccharomyces cerevisiae when using different ratios of C/N. Biomass of yeast was highest (p<0.05) for C/N ratio at 10/1 and lowest for C/N ratio at 15/1 and 5/1.
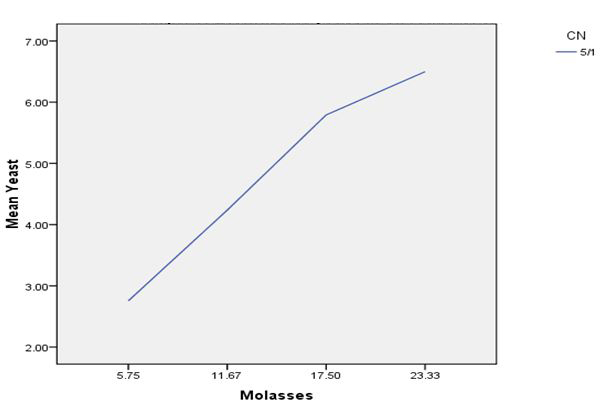
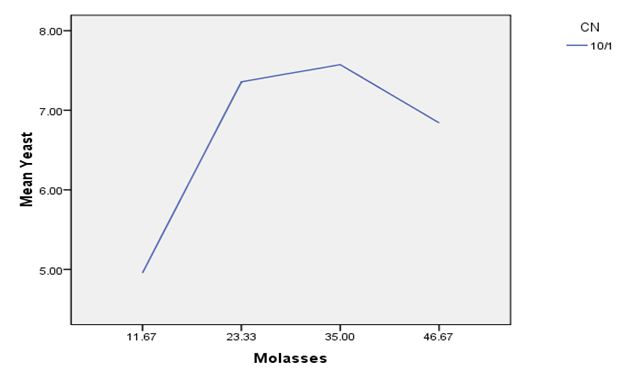
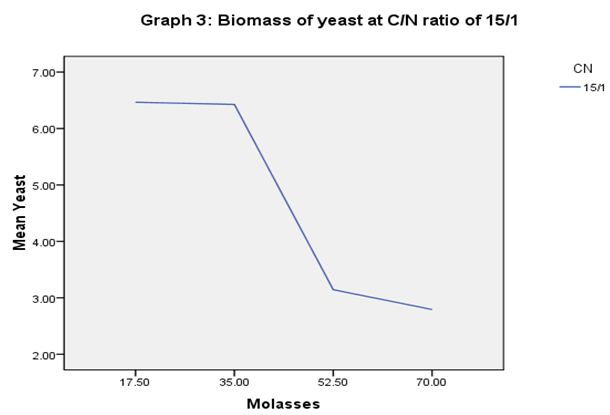
In order to estimate Saccharomyces cerevisiae biomass production in molasses medium containing different C/N ratios, the cell biomass was collected at different fermentation time 0, 4, 8, 12, 24 and 28 h. At C/N ratio of 5/1, the yeast biomass was highest at molasses concentrations of 23.33 g, respectively 6.49 g L-1 (Graph 1). At C/N ratio of 10/1, the yeast biomass was highest at molasses concentration of 35.00 g, respectively 7.57 g L-1 (Graph 2). At C/N ratio of 15/1, the yeast biomass was lowest at molasses concentration of 70 g L-1, respectively 2.79 g L-1 (Graph 3). The results showed that too low or too high levels of molasses concentration also affect the growth of Saccharomyces cerevisiae.
Yeast is the first microorganism to be used as a feed supplement for animals. Yeast has high nutritional value. Yeast contains 45-55% protein, 2-6% fat, 5-10% ash [21]. Yeast is one of the microorganisms used to produce single-celled proteins because yeast can be used in a wide variety of substrates such as agricultural and industrial byproducts [1]. In order to estimate density of yeast in Feed Active Dry Yeast product for further study, 1 g product was diluted in sterile distilled water from 10-1 to 10-8. Then 100 μl dilute solution were cultured on YPD medium, incubated for 48 h at 30 oC and monitored after 3 days. The result of colony forming units (CFU/g) was 21.86 x 10⁹ CFU/g products. Our result was similar with data reported from company. This product has a moisture content of lower than 10%, great advantage is long time use and easy transport.
Yeast has an important role for food fermentation to produce bread and bakery products. The fermentation parameters are clearly related to the yeast flora genotypical characteristics. Therefore, the accurate identification of yeast species is very important. Traditional method for identifying yeast requires laborious and time consuming. In recently, a non-conventional sensitive and specific method for the detection of Saccharomyces cerevisiae in food is proposed. Polymerase chain reaction (PCR) led to the identification of this yeast in some commercial bakery products [22]. Molecular method has been used successfully to identify yeast by ITS1 and ITS4 regions [22,23]. Analysis DNA band of ITS1 and ITS4 region of yeast shows that amplified products for yeast. Internal transcribed spacer amplification (ITS1/ITS4) produced a single band of about 800 bp for yeast. The result of this study was similar with Arlorio et al., (1999) [22]. The data in Table 3 indicated that utility of ITS1 and ITS4 sequences for distinguishing yeasts. All sequences were compared with known strains using NCBI-BLAST2 Nucleotide search (www.ebi.ac.uk/; http://blast.ncbi.nlm.nih.goverevisiae/). All three sequences was closest sequence with Saccharomyces cerevisiae with high identity of 99%. That is similar with species of product.
Saccharomyces cerevisiae is suitable for single cell protein production at commercial scale because of its nutritional quality (protein content 45-55%). Yeast can grow up on different carbon sources such as lactose, pentose, maltose, molasses, and agricultural or industrial wastes [1,24,25]. Recently, some studies have shown that different rates of C: N affects the biomass of yeast cells. The result for cell concentration was highest at a C: N ratio of 10 [11]. According to Sarlin and Philip, (2013), molasses medium was most suitable for growth of the yeast to compare with glucose, sucrose and rice water [24]. In this study, molasses that is a by-product of the sugar manufacturing was used as a sole source of carbon and nitrogen source was from urea. The reason to add urea as a nitrogen source in to molasses medium because of molasses contains low nitrogen. The molasses concentrations were calculated in the C/N ratios of 5/1; 10/1 and 15/1 at different levels of urea 0.5; 1.0; 1.5 and 2.0% (Table 1). The results showed that the highest biomass of Saccharomyces cerevisiae was observed at ratios of C/N of 15/1 and 5/1, reached 4.71 and 4.82 g L-1, respectively (Table 5). Specifically, the cell biomass obtained in the molasses concentration of 35.00 g was 7.57 g L-1 and lowest in the molasses concentration of 5.75 g, 11.67 g, 52.50 g and 70.00 g were 2.75 g L-1, 4.96 g L-1, 3.14 g L-1, and 2.79 g L-1, with a C/N ratio of 5/1, 10/1 and 15/1, respectively. The results of this study are similar to the results of Danesi et al. (2006) when culturing recombinant Saccharomyces cerevisiae at C/N ratio of 10/1, which also obtained the highest biomass. Kalil, et al. (2008) and Manikandan and Viruthagiri (2010) reported that nitrogen source, nitrogen concentration and carbon to nitrogen ratio affect biomass concentration. Kalil, et al. (2008) used organic (pepton, trypton, yeast extract) and inorganic (ammonium sulfate, ammonium nitrate, ammonium chloride) nitrogen to find the best source of nitrogen for biomass production. The result shown that organic nitrogen was better for bacterial growth, and the nitrogen concentration affects bacterial growth [14,26]. Sarlina and Philip, (2013) showed that both molasses concentration and organic nitrogen (pepton, yeast extract) concentration influenced biomass of yeast. The result of this study also demonstrated both C/N ratio and molasses concentration influenced biomass of Saccharomyces cerevisiae [24,27].
Further in vivo studies are necessary to evaluate the device’s effects on the safety and pharmacokinetics of intravitreal injections. Experienced ophthalmic surgeons will be able to evaluate its practical utility and benefits.
This study concluded that time, C/N ratio and molasses concentration within C/N ratio affect biomass production of Saccharomyces cerevisiae yeast. As the results, molasses concentration of 35 g, C/N ratio and the time of fermentation of 24 h resulted the highest biomass production of Saccharomyces cerevisiae.
The author would like to the thank MEKARN II project for financial support.