Effects of Diet and Exercise-Induced Weight Loss in Sedentary Obese Women on Inflammatory Markers, Resistin, and Visfatin
Resistin and Visfatin are secreted by adipose tissue and are potential regulators of inflammation and insulin sensitivity. This study examined the effects of exercise and diet-induced weight loss on resistin and visfatin. Twenty six sedentary obese women were randomly assigned into a non-exercise and diet intervention control group (C) or a diet plus exercise group (DE) that involved adherence to a 1,200 kcal/day for 1 week and 1,500 kcal/d diet for 11 weeks (45% protein, 30% fat) while participating in a supervised circuit resistance-exercise (4 d/week) with walking (10,000 steps/d, 3 d/week). Body composition and fasting blood samples were obtained at 0 and 12 weeks and analyzed by multivariate, univariate, and repeated measures General Linear Model analysis and bivariate Pearson product correlation analysis. Data are presented as mean±SD changes from baseline. Participants in the DE group lost more weight (DE: -5.9±4.0; C: 0.6±1.4 kg, p<0.001), fat mass (DE: -5.1±4.5; C: 0.4±1.5 kg, p<0.001) and body fat percentage (DE: -3.4±3.3; C: 0.2±1.9 kg, p=0.002) with significant decreases in insulin (DE: -8.5±15.0; C: 0.1±7.7 IU/ml, p=0.07, ηp2 = 0.13), IL-6 (DE: -1.9±4.2; C: 2.7±1.2 ng/ml, p=0.001), TNFα (DE: -0.2±2.1; C: 1.7±1.5 ng/ml, p<0.01), and leptin (DE: -19.8±21.9; C: 4.5±16.0 ng/ml, p=0.003) while tending to prevent decreases in visfatin (DE: 0.9±15; C -20.1±37 ng/ml, p=0.10, ηp2= 0.10). No effects were seen on glucose (DE: -3.8±19.8; C: -2.8±6.9 mg/dl, p=0.87) and resistin levels (DE: 18.6±100; C: 59.9±162 ng/ml, p=0.45). Changes in resistin significantly correlated with IL-6 and visfatin. Linear regression analysis revealed significant correlations between changes in resistin to visfatin (r=0.42, R2=0.174, p=0.034) and resistin to IL-6 (r=0.43, R2=0.185, p=0.028). Results support contentions that diet and exercise-induced weight loss affects insulin sensitivity and inflammatory markers and that changes in resistin and visfatin may be correlated with some of these changes.
Keywords: Resistin; Visfatin; Exercise; Weight Loss; Diet
Obesity is associated with a chronic inflammatory response, characterized by abnormal adipokine production, and the activation of some pro-inflammatory signaling pathways, resulting in the alteration of several biological markers of inflammation such as C-reactive protein (CRP), interleukin-6 (IL-6), tumor necrosis factor alpha (TNFα), adiponectin, leptin, resistin, and visfatin [1]. Conversely, a reduction in body weight is accompanied by a decrease or normalization of these biological parameters [2]. The exact mechanism of inflammation is unclear but several inflammatory factors have been implicated as contributors to this mechanism [3].
A number of studies have shown that diet and exercise are highly effective in promoting weight loss that leads to improve inflammatory markers of obesity and enhanced health and overall fitness [4]. Most research has shown that programs including both diet and exercise produce greater weight loss than diet alone soon after intervention period and after 1 year of follow up in overweight and obese individuals [5]. Nevertheless, the main pathogenic mechanisms of obesity still remains unclear and more research needs to be done to better understand contributing factors.
Several inflammatory markers have been studied in relation to obesity. Among them, resistin and visfatin have gained more attention due to their contradictory behavior and potentially contributing factors to insulin resistance and diabetes. In this regard, resistin has been associated with metabolic syndrome components and demonstrated stimulatory effects on the secretion of several inflammatory factors like TNF-α, IL-6, IL-8, and monocyte chemoattractant protein-1 (MCP-1), which play a role in the mechanism of insulin resistance [6,7]. It is suggested that resistin is engaged in inflammatory conditions in humans by means of its secretion in substantial quantities by mononuclear cells. Resistin has also been shown as a pro-inflammatory adipocytokine. Resistin seems to induce and be induced by IL-6 and TNFα [8]. Fukuhara, et al. [9] recently identified a new adipokine called visfatin which is mainly synthesized and secreted in visceral fat. Visfatin is strongly correlated with total fat mass but not so much with subcutaneous fat mass. However, these results remain controversial [7,10]. According to both genetic and nutritional obesity models, visfatin expression is induced only in visceral adipose tissue. Circulating visfatin levels are closely correlated with white adipose tissue (WAT) accumulation. Additionally, visfatin mRNA levels increase in the course of adipocyte differentiation and visfatin synthesis is regulated by several factors, including glucocorticoids, TNF, IL-6, and growth hormone. Visfatin levels have been shown to be increased in children with higher body mass index (BMI) indicating important implication of this new adipokine in inflammatory mechanisms of obesity starting already in childhood [11]. Visfatin levels were reported to be higher in females with visceral obesity [9]. Visfatin and insulin have the same affinity for the insulin receptor but visfatin levels do not significantly change in fed or fasting states [9].
Recent research has shown that serum visfatin increases with progressive beta-cell deterioration in type 2 diabetic patients [12]. The above mentioned studies suggest that visfatin could be primarily regarded as an inflammatory mediator involved in several pathological processes.
However, additional research is warranted to understand the effects of diet and exercise-induced weight loss on resistin and visfatin. Therefore, the primary aims of this preliminary study were to determine whether diet and exercise-induced weight loss reduces inflammatory markers, including resistin and visfatin; 2) whether changes in inflammatory markers correlate with each other; and, 3) whether resistin and/or visfatin correlate with changes in body composition.
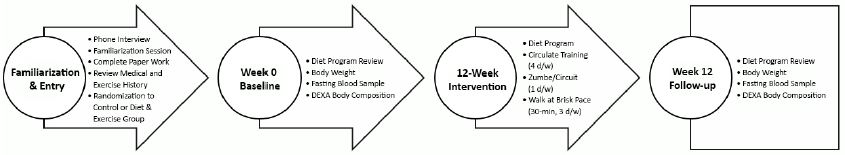
Blood samples used in this analysis came from a from a larger 12-week university-based randomized, comparative effectiveness study that evaluated the effects of different exercise and diet intervention programs on weight loss, fitness, and markers of health [13]. Diet and exercise served as the independent variable while energy and macronutrient intake, anthropometric measures, and fasting blood glucose, insulin, IL-6, TNF-α, leptin, resistin, and visfatin were the dependent variables. Figure 1 shows the overall research design and time course for assessments.
Sedentary and overweight/obese women (BMI>27) between the ages of 18–69 years who had not participated in a diet or exercise program within 3 months were recruited to participate in this study. Recruitment included advertisements posted in local newspapers and via radio ads. Participants were initially screened by phone, with qualifying individuals invited to attend a familiarization session. All participants completed a personal and medical/health history document that included description of their occupational and exercise habits and history. Participants who completed the study received $125 USD in compensation.
Candidates were excluded from the study if they presented with: 1) any uncontrolled metabolic or cardiovascular disorder, including heart disease, a history of hypertension, arrhythmias, diabetes, thyroid disease, or hypogonadism; hepatorenal, musculoskeletal, autoimmune, or neurological disease; 2) were currently taking prescribed medications or dietary supplements for thyroid, hyperlipidemia, hypoglycemia, or weight loss supplements (e.g., thermogenic compounds, etc.) within three months before the start of the study; 3) had hypertension or androgenic conditions; 4) were pregnant, had been pregnant within the past year, or had an interest in becoming pregnant during the study; or, 5) did not obtain physician clearance to participate in this study if they had a controlled medical condition that would not affect study outcomes.
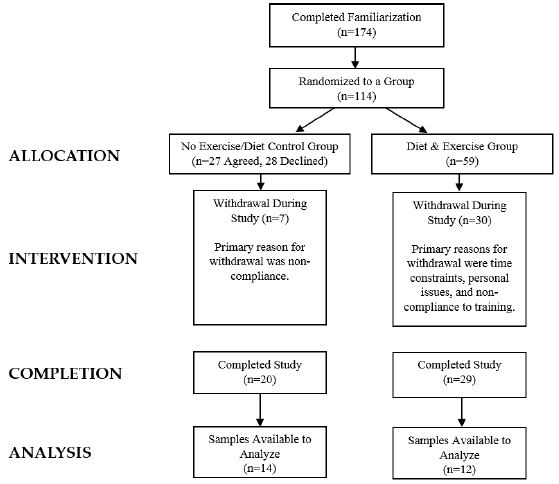
Participants who met eligibility criteria were informed of the requirements of the study and signed consent statements in compliance with the Human Participants Guidelines of Texas A&M University (IRB #2010-0813) and the American College of Sports Medicine. Figure 2 presents a CONSORT diagram. A total of 356 women were initially screened to participate in the larger study with 210 participants found to be eligible to participate in the study and randomized to one of four diet groups and a control group as previously described [13]. Those randomized to the control group agreed to serve as a control during the study in which they did not change their normal diet or exercise habits while being waitlisted to start the program after the study was completed. A total of 59 women were allocated to the diet and exercise (DE) group while 27 women agreed to serve as controls (C). A total of 20 women in the C group and 29 women in the DE group completed the study. Primary reasons for withdrawal were due to time constraints, personal issues, and/or not meeting training and/or testing expectations. Available blood samples from 26 women who completed the study (DE n=12, C n=14) were used in the present analysis. Participants were 46.7 ±11 yr, 90.3±12 kg, 45.8±4% fat, had a body mass index (BMI) of 34.8±5 kg/m2, and a peak VO2 of 18.2±3 ml/kg/min.
Table 1 overviews the diet intervention used in this study. Participants were randomized into the DE or C groups. Participants in the control group were instructed to follow their normal dietary habits.
Participants in the DE group were instructed to follow the Curves Complete™ diet plan (Curves International, Waco, TX). The diet consisted of consuming 1,200 kcals/day for one week followed by 1,500 kcals/day for 11 weeks with a prescribed macronutrient content of 45% protein, 30% carbohydrate, and 25% fat in both diet phases. Participants were provided meal plans to follow in order to meet energy intake and macronutrient goals and encouraged to take daily dietary supplements of calcium, a multi- vitamin, and omega-3 (Curves Essentials 2 Go, Waco, TX). A registered dietitian met with participants prior to the study to explain how to follow the prescribed meal plans and met with them weekly throughout the study to review diet compliance.
Participants in the DE group followed the Curves training program while subjects in the C group followed their normal daily activities with no participation in a structured exercise program. Participants in DE group participated in three circuit-style resistance workouts and one Zumba® dance workout each week for 12-weeks. The circuit training platform utilized the computerized Curves Smart system with software designed by MYTRAK (version 4.2.1, copyright 2004-2011, MYTRAK Health System Inc., Mississauga, Ontario, Canada). This system provides feedback and records performance to ensure participants meet intensity expectations (i.e., 60% to 80% of one repetition maximum). The circuit included 13 bi-directional hydraulic concentric only resistance exercise machines which worked all major muscle groups (i.e., elbow flexion/extension, knee flexion/extension, shoulder press/lat pull, hip abductor/adductor, chest press/seated row, horizontal leg press, squat, abdominal crunch/back extension, chest flies, oblique, shoulder shrug/dip, hip extension, and side bends). During the training period, participants were coached to perform as many repetitions as possible within 30-second time period on each resistance machine.
Between machines, participants performed floor-based aerobic exercises or stepping exercise in order to maintain an elevated heart rate. Participants completed the entire circuit twice during the 26 minute regular circuit workout. During the Curves Zumba workout, participants performed 1 minute of Zumba dance exercise as taught by a certified Zumba instructor followed by performing 1 minute of resistance- exercise on each machine throughout the circuit.
The circuit training sessions were supervised by trained fitness instructors who provided feedback about appropriate exercise technique and led self-monitoring of heart rate in order to maintain heart rate between 60-80% of age-predicted maximal heart rate. Participants also completed 4 minutes of whole body stretching following circuit workouts and were encouraged to walk for 30 min at a brisk pace at 60-80% of age-predicted maximal heart rate on days when they were not using the curves equipment in order to achieve 10,000 steps/day. We previously reported that women participating in this type of training elicit an average exercise heart rate of 126±15 bpm (80% of maximal heart rate), an average exercise intensity of 65±10% of peak oxygen uptake, resistance exercise intensities ranging between 61% and 82% of 1RM on the various exercise machines, and expend 314±102 kcals per workout [14-16]. Participants were required to achieve at least a 90% compliance record (43 out of 48 workouts).
Participants were instructed to refrain from exercising for 48 hours and fast for 12 hours prior to each testing session. Participants reported to the lab at approximately the same time of day each session. The following describes the methods of assessments performed.
Participants were provided a detailed description of how to measure and record food and beverage intake on food logs by a registered dietitian. Participants recorded all food and energy containing fluids consumed for 4-days (including 1 weekend day) prior to each testing session. Food logs were checked for accuracy when returning to the lab for each testing session and analyzed by a registered dietitian using dietary analysis software (ESHA Food Processor Version 8.6, Salem, OR).
Body mass and height were determined according to standard procedures using a Healthometer Professional 500KL (Pelstar LLC, Alsip, IL, USA) self-calibrating digital scale with an accuracy of ± 0.02 kg. Whole body bone density and body composition measures (excluding cranium) were determined with a Hologic Discovery W Dual-Energy X-ray Absorptiometer (DEXA; Hologic Inc., Waltham, MA, USA) equipped with APEX Software (APEX Corporation Software, Pittsburg, PA, USA) that estimated visceral adipose tissue (VAT) by using procedures previously described [17,18]. On the day of each test, the equipment was calibrated following the manufacturer’s guidelines. Mean test-retest reliability studies performed on male athletes in our lab over repeated days revealed mean coefficients of variation (Cv) for total bone mineral content and total fat free/soft tissue mass of 0.31–0.45% with a mean intraclass correlation of 0.985 [19].
Whole blood was collected in an ethylenediaminetetraacetic acid (EDTA) and BD Vacutainer® SST™ Serum Separation Tubes (Becton, Dickinson and Company, Franklin Lakes, NJ) using standard phlebotomy procedures. After collection, the whole blood and serum separation tubes were centrifuged at 1,200 g for 15 min at 4 oC. Supernatant from the serum was transferred into 1.5 ml micro centrifuge tubes while the intermediate white layer or white blood cell (buffy coat) was transferred using a plastic 3 ml transfer pipette into 1.5 ml Eppendorf tubes. Serum was then aliquoted and stored at -80 oC for further analysis.
Fasting serum blood glucose was analyzed by Quest Diagnostics (Quest Diagnostics, 5850 Rogerdale Road, Houston, TX, USA 77072) using an Olympus AAU 5400 Chemistry Immuno Analyzer (Olympus America Inc., Center Valley, PA, USA). Test-retest reliability of performing assays using this system range from 2% to 6%. Fasting insulin and leptin levels were assayed in duplicate by using commercially available enzyme linked immunoabsorbent assay (ELISA) kits (ALPCO, Salem, NH) using a BioTek ELX-808 Ultramicroplate reader set at an optical density of 450 nm with BioTek Gen5 Analysis software (BioTek Instruments Inc., Winooski, VT). The intra-assay Cv for insulin ranged from 2.9% to 6.2% while the inter-assay Cv ranged from 5.4% to 8.6%. The intra-assay Cv for leptin ranged from 3.7% to 5.5%, and the inter-assay Cv ranged from 5.8% to 6.8%. Fasting human resistin and visfatin levels were assayed in duplicate using enzyme immunoassay (EIA) kits from Affymetrix Ebiosciences (BMS2040, Santa Clara, California, USA) and Sigma-Aldrich (RAB0377, St. Louis, Montana, USA), respectively, using a BioTek ELX-808 Ultramicroplate reader set at an optical density of 450 nm with BioTek Gen5 Analysis software (BioTek Instruments Inc., Winooski, VT). The reported intra-assay Cv for resistin was 5.1% with an inter-assay Cv of 8.1% while the intra-assay Cv for visfatin was <10% with an interassay Cv of <15%. Inflammatory markers (IL-6 and TNFα) were assayed using a human inflammatory marker kit following the manufacturer’s protocol with a Luminex 200 multiplexing system equipped with Luminex xPonent 3.0 software (Millipore, Billerica, MA). The reported intra-assay Cv for IL-6 was 2% to 13% with an inter- assay Cv of 5% to 19%.
Data were analyzed using IBM® SPSS® version 25 Statistics for Windows (IBM Corp., Armonk, NY). Baseline variables were analyzed using one-way analysis of variance (ANOVA). The sample size was determined based on prior research indicating that an n-size of 10-15 per group provided sufficient power (>0.80) to detect significant differences between a control group and diet and exercise intervention group in primary outcome variables [13,20-22].
Related variables were analyzed using univariate, multivariate and repeated measures general linear model (GLM) statistics. The overall multivariate Wilks’ Lamda time and group, time, and group x time interaction p-levels were reported along with Greenhouse-Geisser univariate tests time and group x time effects and between-subjects group effects. Delta values (post–pre) were calculated to determine changes from baseline. Bivariate Pearson product correlation analyses was conducted on baseline, post-intervention, and change from baseline data to examine relationships among variables. Linear regression was also used to examine the relationship between changes in resistin and visfatin as well as resistin and IL-6. Data were considered significant when the probability of type I error was 0.05 or less while data were considered as statistical trends if the p-value ranged between p>0.05 to p<0.10. Partial eta squared effect sizes (ηp2) were also reported on select variables as an indicator of effect size [23]. An eta squared around 0.02 was considered small, 0.13 medium, and 0.26 large. Data are presented as means ± standard deviation unless noted otherwise.
Table 2 presents the participant demographics data. Sufficient blood samples were available for analyses on 26 obese women who completed the 12-week study (DE group n=12; C group n=14). One-way ANOVA found no significant differences between groups in baseline age, weight, BMI, fat mass, fat free mass, percent body fat, VAT mass, or waist to hip ratio.
Table 3 presents energy and macronutrient intake observed at baseline and after 12-weeks of intervention for the DE and C groups. Significant time and group effects were observed indicating that participants in the DE group consumed less energy and carbohydrate on average compared to controls. However, in contrast to our more complete reporting of diet results from this study, no significant interactions observed between groups in energy intake or carbohydrate, protein and fat intake [13]. Table 4 presents anthropometric data observed at baseline and after 12-weeks of intervention. Significant group x time interactions were observed in body weight, fat mass, and percent body fat. Delta analysis revealed that participants in the DE group lost more weight (DE: -5.9±4.0; C: 0.6±1.4 kg, p<0.001), fat mass (DE: - 5.1±4.5; C: 0.4±1.5 kg, p<0.001) and body fat percentage (DE: -3.4±3.3; C: 0.2±1.9 kg, p=0.002) as compared to those in the C group. Thus, the diet and exercise intervention employed promoted statistically significant changes in body composition measures compared to controls.
Table 5 shows markers of glucose homeostasis, inflammatory markers and related hormones at baseline and 12 weeks after intervention. Significant univariate interactions were observed between groups in IL- 6 (p<0.001), and TNFα (p=0.01) and leptin (p=0.003) while insulin (p=0.07) and visfatin (p=0.10) levels tended to interact and no significant differences were observed in glucose (p=0.87) or resistin (p=0.45). Delta analysis revealed that participants in the DE group observed a greater decrease in insulin (DE: - 8.5±15.0; C: 0.1±7.7 IU/ml, p=0.07, ηp2= 0.13 medium effect), IL-6 (DE: -1.9±4.2; C: 2.7±1.2 ng/ml, p=0.001), TNFα (DE: -0.2±2.1; C: 1.7±1.5 ng/ml, p<0.01), and leptin (DE: -19.8±21.9; C: 4.5±16.0 ng/ml, p=0.003) and tended to prevent decreases in visfatin
(DE: 0.9±15; C -20.1±37 ng/ml, p=0.10, ηp2= 0.10 medium effect) while glucose (DE: -3.8±19.8; C: -2.8±6.9 mg/dl, p=0.87) and resistin levels (DE: 18.6±100; C: 59.9±162 ng/ml, p=0.45) were not significantly different between groups.
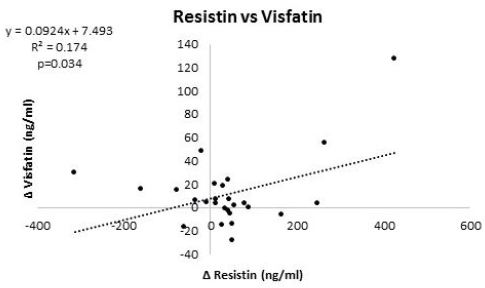
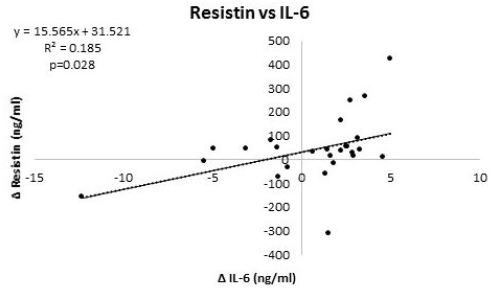
Table 6 and 7 provide overview of correlations among markers of interest at baseline and 12-weeks, respectively, while Table 8 presents correlations among changes from baseline. At baseline, resistin significantly correlated with TNFα while visfatin was not significantly correlated with any other variable analyzed (Table 6). After intervention, resistin was significantly correlated with TNF-α, leptin, and visfatin (Table 7). Analysis of changes from baseline indicated that resistin significantly correlated with IL-6 and visfatin (Table 8). Figure 3 and 4 show regression analysis of changes in resistin to visfatin and resistin to IL-6. Linear regression analysis revealed significant correlations between changes in resistin to visfatin (r=0.42, R2=0.174, p=0.034) and resistin to IL-6 (r=0.43, R2=0.185, p=0.028).
Results of this preliminary study revealed that participants in the diet and exercise intervention group experienced significant reductions in body weight and fat mass with no changes observed in fat free mass (FFM) in comparison to controls. As reported elsewhere, participants also improved their fitness and some markers of health [13]. In this subsequent analysis, we found evidence that diet and exercise promoted decreases in insulin (DE: -8.5±15.0; C: 0.1±7.7 IU/ml, p=0.07, ηp2= 0.13 medium effect), IL-6 (DE: - 1.9±4.2; C: 2.7±1.2 ng/ml, p=0.001), TNFα (DE: -0.2±2.1; C: 1.7±1.5 ng/ml, p<0.01), and leptin (DE: -19.8±21.9; C: 4.5±16.0 ng/ml, p=0.003) and tended to prevent decreases in visfatin (DE: 0.9±15; C - 20.1±37 ng/ml, p=0.10, ηp2= 0.10 medium effect) while glucose (DE: -3.8±19.8; C: -2.8±6.9 mg/dl, p=0.87) and resistin levels (DE: 18.6±100; C: 59.9±162 ng/ml, p=0.45) were not significantly different between groups. Moreover, that change in resistin significantly correlated with IL-6 and visfatin. Linear regression analysis also revealed significant correlations between changes in resistin to visfatin (r=0.42, R2=0.174, p=0.034) and resistin to IL-6 (r=0.43, R2=0.185, p=0.028). These findings support contentions that diet and exercise-induced weight loss affects insulin sensitivity and inflammatory markers and that changes in resistin and visfatin may be correlated with some of these changes [24-28].
Similar results were reported by Lambert and colleagues who evaluated the effects of 12-weeks of diet and exercise (aerobic and resistance exercise training) on weight loss and inflammatory markers in obese elderly individuals [29]. The diet and exercise intervention involved exercise-training 3 days/wk and adhered to a balance diet promoting a 500–750 kcal/day energy deficit. Participants in the diet and exercise group lost significantly more weight (-7.5 ± 1.2 kg, p=0.001) as compared to the control group (-0.3 ± 0.8 kg, p=0.74). The researchers found significant reductions in IL-6 and TNF-α. Similarly, Gielen, et al.[ conducted a study on 20 male congestive heart failure patients, randomized to a training group (i.e., 70% VO2peak for 20 min/d for 60 min/wk) or a control group [30]. They reported that participants in training group experienced a significant 42% reduction in IL-6 levels. Our findings add to a growing body of evidence that weight loss in obese individuals promotes a reduction in markers of inflammation.
In terms of resistin, previous studies showed mixed results on the effects of exercise and/or hypocaloric diet on resistin [27,31-34]. For example, Reinehr and colleagues studied the change in weight status and resistin level over a 1-year period in obese children participating in an exercise, nutrition education (high carbohydrate, fat reduced diet), and behavior therapy that included individual psychological care of the child and his or her family [33]. They found significant weight change but no significant change in resistin levels. Additionally, there were no significant correlations between changes of resistin and changes of BMI, percentage body fat, waist-to-hip ratio, or insulin resistance index. These findings support results observed in the present study. However, Koebnick and associates reported that 43 overweight to obese individuals who underwent dietary and physical activity intervention as compared to controls (n=20) observed a mean weight reduction of -4.5 kg and significant increase in serum resistin levels [25]. This increase was inversely correlated to changes in the waist to hip ratio and no relation was observed between changes in resistin and measures of insulin resistance. On the other hand, Bai and associates reported that individuals participating in an aerobic exercise program for 8 weeks (60%-70% of functional capacity for 60 minutes, 5 times/week) observed a significant decrease in weight, BMI, percentage body fat and blood sugar (P<0.01) while plasma resistin decreased in both male and female participants [35]. However, plasma resistin only correlated with BMI and waist to hip ratio in the male students. Similarly, Vendrell and coworkers found that surgically treated morbidly obese individuals lost a significant amount of weight and that the magnitude or weight loss was best predicted by pre- surgery resistin levels [36]. Moreover, that plasma lipids, insulin resistance, leptin, sTNFR1, and IL-6 decreased while adiponectin and ghrelin increased significantly in response to weight loss. Obviously, more research is needed to determine the effects of diet and/or exercise-induced weight loss on resistin before conclusions can be drawn.
In regards to visfatin, we found that diet and exercise-induced weight loss tended to prevent decreases in visfatin (DE: 0.9±15; C -20.1±37 ng/ml, p=0.10, ηp2= 0.13 medium effect). Our results contradict findings reported by Seo and associates who reported that 12 weeks of combined resistance and aerobic exercise training significantly decreased weight, body fat, and visfatin levels in obese-middle aged women [37]. Brema, et al. also reported significant reduction in visfatin level (~80%) after 12 weeks of aerobic exercise training in severely obese young subjects with type 2 diabetes [38]. Another study conducted by De Luis, et al. [39] evaluated the effects of maintaining a hypo-energetic diet for two months in 41 morbidly obese patients. Results revealed an average weight loss of average 4.41%. However, serum visfatin was not significantly affected.
Furthermore, we analyzed the correlations between resistin with anthropometric and inflammatory markers. We did not find significant correlation between changes in resistin with weight (r=0.054, p=0.793), fat free mass (r=0.112, p=0.587) or visceral adipose tissue (r=0.136, p=0.508). There was also no correlation between changes in resistin and glucose (r=0.057, p=0.782) or insulin (r= 0.137, p=0.505). This latter finding supports several other studies that reported no association of resistin with insulin resistance or indicators of type-2 diabetes mellitus [40-42]. A study conducted by Mozillo, et al. evaluated the effects of weight loss in response of lifestyle modification program on adipose tissue derived cytokines in obese individual with insulin resistance [43]. They found that participants experienced a 6.9±0.1 kg average weight loss with a significant improvement in insulin sensitivity index. However, they did not find any change in resistin levels. The present findings support these prior reports.
However, we did find statistically significant positive correlation between changes in resistin and changes in IL-6 (r=0.430, p=0.028). Interestingly, a study conducted by Kaser, et al. showed that human peripheral blood mononuclear cells seem to be a major source of resistin and resistin was increased by the proinflammatory cytokine IL-6 [44]. They also reported that resistin may be a link in the well-known association between inflammation and insulin resistance. Another study conducted by Tuttolomondo and colleagues reported higher plasma levels of IL-6 and resistin in diabetic subjects with foot ulcers [45].
Similarly, Stejskal and associates conducted a study on patients with type 2 diabetes mellitus and patients with acute inflammatory disease [46]. They reported that patients with clinical signs of severe inflammation had higher concentrations of IL-6 and resistin and a significant positive correlation between resistin and inflammatory markers. Present findings provide some support that changes in resistin are related to changes in IL-6.
Furthermore, we explored visfatin correlations with anthropometric and inflammatory measures. There were no significant correlations between changes in visfatin with changes in weight (r=0.327; p=0.103), changes in fat mass (r=0.348; p=0.081), or changes in FFM (r=-0.026; p=0.900). This could be due to the fact that the resistance-exercise protocol helped to maintain fat free mass during weight loss or small sample size. However, we found positive correlations between changes in visfatin and changes in resistin (r=0.417; p=0.034). A study conducted by Berndt and coworkers reported that visfatin plasma concentration correlates positively with the BMI (r=0.250; p=0.004) and percent body fat (r=0.220; p=0.01) [47]. Interestingly, Novak and colleagues found a negative correlation between visfatin and waist circumference [48].
In conclusion, our study indicated that diet and exercise-induced weight loss positively affected anthropometric measures and inflammatory markers such as IL-6 and TNF-α. However, resistin and visfatin were not significantly affected and changes did not correlate with markers of body composition or glucose homeostasis. We did find that changes in resistin significantly correlated with changes in IL-6 and visfatin. With that said, our study was limited in that we only investigated the impact on a relatively small cohort of women adhering to this particular exercise and diet intervention. As described above, there may be sex differences in resistin and/or visfatin response to a diet and exercise intervention. This preliminary study also did not include an exercise only or diet only group which could have added additional control and/or insight. Finally, it is possible that the normal variability in some assays performed may have influenced results given the low n-size studied. Nevertheless, additional research needs to be conducted with larger sample size in men and women adhering to different types of exercise and diet interventions to further assess the impact of weight and/or fat loss on resistin and visfatin.
We would like to thank all of the research participants and assistants who contributed to this work. We would also like to thank Drs. Jim Fluckey, Steve Riechman, Peter S. Murano, and J.P. Bramhall for their participation in this study. DK conducted resistin and visfatin assays, assisted in performing statistical analyses, and contributed to writing the manuscript. CB served as study coordinator to the overall project and oversaw data collection and entry. BL, EG, CR, YPJ, MK, RD, and MB assisted in data collection, entry, and analysis. SS assisted in data collection and conducted inflammatory analyses. RBK designed the research (project conception, procurement of external funding, development of overall research plan), provided study oversight, and finalized the manuscript.
Curves International (Waco, TX, USA) provided funding for this research through an unrestricted grant to Richard B. Kreider who served as Principal Investigator for this research. No other authors declare a conflict of interest. All coauthors have reviewed and approve this manuscript.