Electronic and Molecular Structure of Carbazole Using Spectrophotometric and In Silico Methods
Carbazole has extensive potential application in supramolecular chemistry and pharmaceutical chemistry due to its rigid structure and large π conjugated system. The electronic structure and molecular orbital data of Carbazole were studied using spectroscopic methods and computational analyses were used to explain some of the properties and to predict others. In this study, calculated structural parameters with the Density Functional Theory at the B3LYP level of theory using 3-21G basis set gave a better approximation to the experimentally determined parameters than the 6-31Gd basis set. The Dunning correlation consistent basis set, cc-pVDZ, gave a better fit than the LanL2DZ basis set of the calculated UV spectrum to the experimentally determined UV spectrum. The reduction of the band gap when Carbazole is dissolved in a mixed solvent system of Ethanol: Water (1:1) by 6% points to one possible way of manipulating the photoelectrical properties of the molecule.
Keywords: Carbazole; Density Functional Theory; VEDA 4; Gaussian 09; Powder X-ray Diffraction
Carbazole and its derivatives are an important type of nitrogen containing heterocyclic compounds that are widespread in nature [1]. The chemistry and biology of Carbazole have attracted an increasing interest over the last 50 years because it possesses desirable electronic and charge transport properties, as well as a large π-conjugated system. This enables various functional groups to be easily introduced into the structurally rigid carbazolyl ring. These characteristics result in the extensive potential application of Carbazole in the field of chemistry (photoelectrical material, dyes, supramolecular recognition) and medicinal chemistry (antitumor, anti-inflammatory, antimicrobial, psychotropic, anti-oxidative) [1-4]. These Carbazole-based compounds are also considered to be potential candidates for electronic applications, such as colour displays, organic semiconductors, lasers and solar cells, as they demonstrate electroactivity and luminescence [5,6].
The molecular and electronic structure of Carbazole is believed to be responsible for all these favourable characteristics of the compound. The electronic and vibrational spectra of Carbazole has been of much interest in the past and a lot of investigations have been done in these areas [7,8]. Lee and Boo used computational methods based on Density Functional Theory (DFT) and ab initio methods to calculate the molecular structure and perform normal vibrational mode analyses of Carbazole at the Hartree Fock (HF) and Becke-Lee-Yang-Parr (B3LYP) levels of theory using the 6-31G* basis set. Their analyses of the vibrational spectra relied on the assumptions that the stronger lines mark the presence of fundamentals. The work by Lee and Boo, though confirming most of the fundamentals published by Bree and Zwarich could not identify some of the modes. They, for example, reported serious disagreement between the value of the fundamental ν52 from their calculations and that reported by Bree and Zwarich [9,10].
This work uses both in vitro (experimental methods) and in silico (computational methods) to study the structural and electronic properties of Carbazole. The vibrational spectra were analysed using the Potential Energy Distribution (PED) method which quantitatively describes the contribution to movement of a given group of atoms in a normal mode. The chemical stability of Carbazole was examined using the Frontier Orbital Theory (FOT). The crystal structure of Carbazole was delineated using data reduction of the Powder X-Ray Diffractogram (PXRD).
Carbazole was purchased from BDH Chemicals, Poole, England with a minimum assay of 98% and was used without further purification.
A 0.0128M solution of the compound was prepared by dissolving the powder in a mixed solvent system of Ethanol: Water (1:1 by vol.). The solution was used subsequently for the Ultraviolet spectroscopy.
The infra-red spectrum of crystalline Carbazole in the region 4000-400 cm-1 was measured at 4 cm-1 resolution with an average of 23 scans on a Perkin Elmer Spectrum Two FT-IR Spectrophotometer. The spectrum was elaborated using the Spekwin 32 software to convert the transmittance to absorbance [11].
The UV spectra of carbazole were determined using a Spectroquant Pharo 300 UV-Vis Spectrophotometer in the region 190 nm – 1100 nm. The spectrum was elaborated using the Spekwin 32 software [11].
X-ray data was acquired using a PANalytical Empyrean X-ray Diffractometer with a copper anode. The K-alpha1 wavelength was 1.54060Å and the K-alpha2 wavelength was 1.39225Å. The sample of carbazole was scanned continuously in steps of .08 ° in 3 seconds with 2θ from 5.04 ° to 80 ° while spinning. Spekwin 32 software was used to sketch the diffractogram [11].
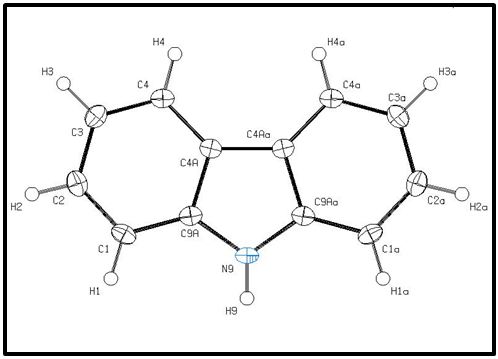
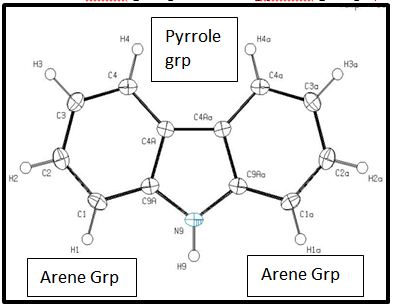
The crystal structure for carbazole has been determined and published by K. Gajda et al. and was visualized using OLEX 2 software and plotted using ORTEP-plot in PLATON version 271014 [12,13]( Figure 1).
The molecular geometry of the compound was optimized using the Gaussian 09 program suite based on the Density Functional Theory (DFT) using the hybrid DFT functional B3LYP and two basis sets; 3-21G, and 6-31Gd basis set [14-33]. For the analysis of the solvent effects on the optimized structure in gas phase, the Continuous Polarizable Continuum Model (CPCM) using Dunning’s correlation consistent basis sets, aug-cc-pVDZ (augmented with diffuse functions) and Lanl2DZ were used [34-41].
Frequency calculations at optimized geometry were done to confirm the optimized structures to be at an energy minimum and to obtain the theoretical vibrational spectra. The true energy minimum at the optimized geometry was confirmed by the absence of any imaginary frequency modes.
The Potential Energy Distribution (PED) of the vibrational modes was calculated with the VEDA 4 programme and the vibrational modes were characterized by their total energy distribution (TED%) [42,43].
The possible electronic transitions of the molecules were calculated by finding the energy levels using the TD-SCF DFT method at the B3LYP level of theory. This made possible the visualization of the HOMO and LUMO states.
The natural bond orbital analyses were performed using the NBO calculations as implemented in the Gaussian 09 package.
The percentage contribution of the various groups on the molecule to the various molecular orbitals were confirmed using the GaussSum software based on the Mulliken Population Analysis [44].
Bond Lengths were measured from both the optimized structure using DFT calculations (referred to as ‘calculated’) using the two basis sets, 3-21G and 6-31Gd, and the ORTEP-plot of the structure determined by X-ray data refinement of the Single Crystal (SC) structure of the Carbazole molecule as solved by K. Gajda et al. and plotted using OLEX 2 and ORTEP-plot in PLATON version 271014 [12].
All calculated bond lengths are longer than determined by SC x-ray data refinement, except Carbon-Carbon bond opposite the nitrogen atom, i.e. C4A-C4Aa using the 6-31Gd basis set. The deviations may be attributed to the crystal packing force (Table 1). This bond is the longest in the pyrrole ring, emphasizing its relative single bond character. This trend is seen in the calculated bond lengths also, though using the 6-31Gd basis set gives a slightly shorter length, 1.4504Å, than the SC x-ray determined length of 1.4534Å (Table 1).
Additionally, the C - H and N - H bonds calculated were also longer by approximately 0.15Å than those determined from the SC x-ray data refinement. This may be because all hydrogen atoms in the structure refinement of the experimentally determined structure were generated in idealized positions and refined in riding mode [12]. The large deviations from experiment may also arise from the low scattering factors of hydrogen atoms in the X-ray diffraction experiment.
Lengths of C – H bonds in the arene rings and C – C bonds adjacent the pyrrole ring (C1 - C9A and C1a - C9Aa) calculated using the 3-21G basis set were found to deviate less from the experimentally determined ones than when the 6-31Gd basis set was used (Table 1). This is not expected as the 6-31Gd basis is at a higher level of theory. A possible reason is that the polarization effect introduced by the 6-31Gd basis set is not effective.
Bond Angles were also measured from both the optimized structure using DFT calculations (referred to as ‘calculated’) using the two basis sets, 3-21G and 6-31Gd, and the ORTEP-plot of the structure determined by SC x-ray data refinement (Table 2).
In the pyrrole ring, two angles, N9-C9A-C4A and C4Aa-C9Aa-N9, are underestimated in the calculation using both basis sets though the deviation is more (0.31 Å) when the 3-21G basis set is used (Table 2). The angles C9A-C4A-C4Aa and C4a-C4Aa-C9Aa are overestimated by the using the basis sets though here also the 3-21G gives a higher deviation of 0.21 Å (Table 2). The angle at the nitrogen atom, 109.53 Å is also overestimated using both basis sets though as usual the 3-21G basis set gives a higher overestimation, 0.2 Å. This is expected as the 3-21G is a lower level of theory.
In the arene rings, the angles furthest from the nitrogen, C4 and C4a are better estimated by the DFT with a deviation (0.26 Å using 3-21G and 0.36 Å using 6-31Gd basis sets). This is as expected since the influence of the nitrogen is minimal here.
The two bonds being shared by the pyrrole ring and the arene rings, C4A-C9A and C4Aa-C9Aa, have an index of 2 (double bond) and are the same length, 1.4145 (15) Å (SC x-ray data) or 1.4263 Å (DFT) though they are longer than the other four double bonds in the arene rings. This is expected since bond lengths in pyrrole rings are usually longer.
The NBO from these bonds are composed of approximately 50% from each carbon hybrid. One bond is composed of sp2.33 for the carbon furthest from the N and sp1.95 for the other carbon hybrid. The second bond is 100% p in character. As expected, the polarization coefficient for the carbon nearest the nitrogen atom is higher than the other carbon due to the influence of the nitrogen hybrid.
The NBO from the N-C bond is composed of 38% carbon hybrid and 62% nitrogen hybrid. The polarization coefficients are 0.7870 for nitrogen and 0.6169 for carbon implying the NBO is more polarized towards the nitrogen than the carbon. The carbon hybrid orbital is composed of sp2.79 while that of the nitrogen is sp1.84.
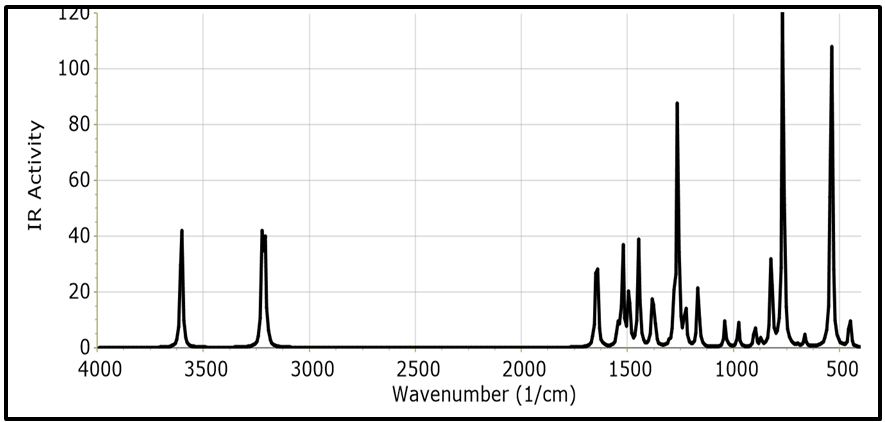
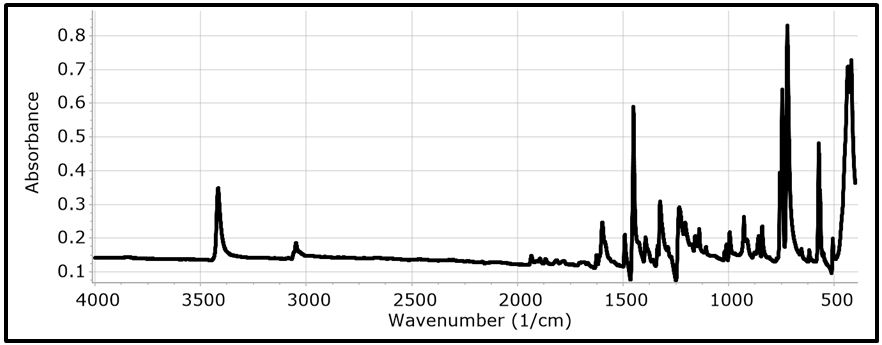
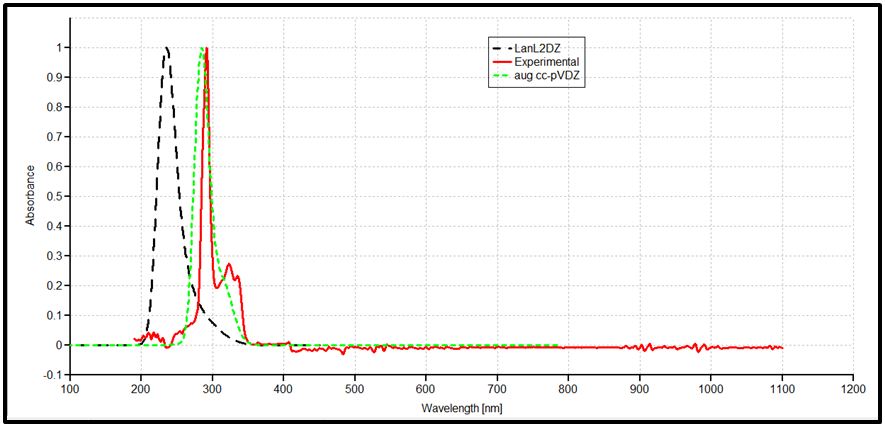
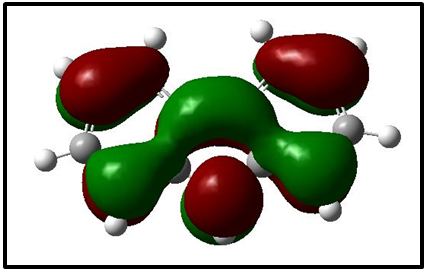
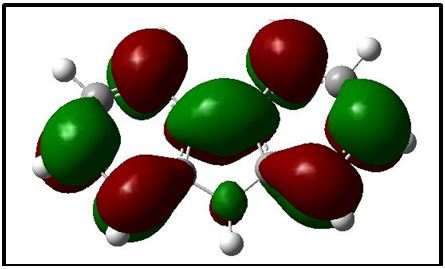
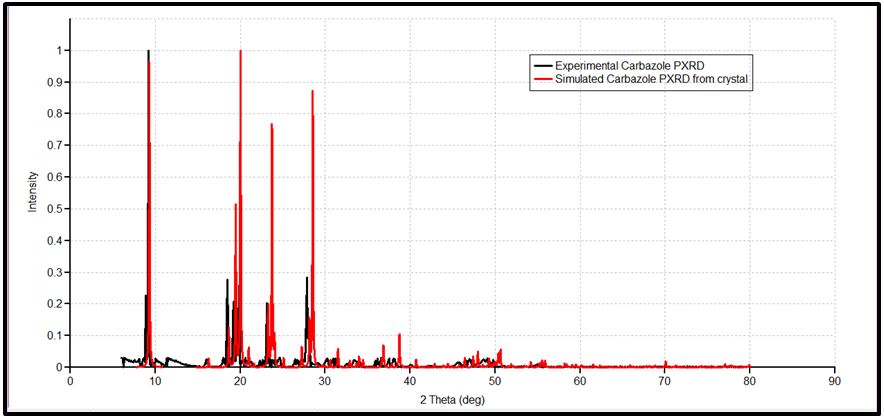
The NBO of the C-H bonds are composed mainly of the carbon hybrid spx (2.27 For the N - H bond also, the NBO is more polarized towards the nitrogen though to a higher degree than in it is towards the carbon in the C-H NBOs. The nitrogen hybrid is sp2.39 and contributes 72% to the NBO. The Carbazole molecule is more polarizable in a protic solvent (Ethanol:Water (1:1) mixture) than in an aprotic solvent (acetone) (Table 3). Supporting Information S1 gives data on the Natural Bond Orbitals. IR-Spectroscopy is an efficient method to determine the geometric structure of the molecules and has been used widely in studying the structural consequences using the vibrations generated thereof [46]. Degree of freedom is the number of variables required to describe the motion of a particle completely. For non-linear molecules, all rotational motions can be described in terms of rotations around 3 axes, the rotational degree of freedom is 3 and the remaining 3N-6 degrees of freedom constitute vibrational motion where N is the number of atoms [47]. The number of atoms in Carbazole is 22. The degrees of freedom which constitute vibrational motion is therefore 60. The number of the different types of vibrational motion or modes in the molecule are constituted as 21 Stretching modes, 20 Bending modes and 19 Torsion modes. Out of these there are 24 CH modes. The PED analysis is more accurate than the visualization of an atom movement to interpret a theoretical vibrational spectrum of a molecule. It also quantitatively describes the contribution to movement of a given group of atoms in a normal mode [43]. The Total Energy Distribution, TED, data generated from PED is used in discussing the IR spectrum of the compound. The highest peak at 759.87 cm-1 is assigned to the stretching of the C2 – H2 bond and the bending of the H3 – C3 – C4 angle. This peak is shown calculated at 756.69 cm-1 (Figure 2). The C - H and C - C stretching vibrations of Carbazole are predicted at 1516.17 cm-1 (C2a - H2a), 1367.21 cm-1 (C3 - H3), 1257.58 cm-1 (C1 - H1), and 771.17 cm-1 (C3a - H3a) for the C - H bonds and 1014.64 cm-1 (C2 - C1) for the C - C bond (Figure 2). These were observed experimentally at 1492.22 cm-1, 1335.43 cm-1, 1233.46 cm-1, 756.69 cm-1 and 1010 cm-1 respectively (Figure 3). These stretching vibrations are predicted to be pure nodes. The N - C stretching vibration is also predicted to be a pure node at 1250.38 cm-1 (N9 - C9A) and this was observed at 1233.46 cm-1. Bending pure modes are predicted at 1058.03 cm-1 (H2 - C2 - C3), 892.65 cm-1(C2 - C1 - C9A), 609.81 cm-1 (H9 - N9 - C9Aa), 580.53 cm-1(H4 - C4 - C4A) and 463.15 cm-1(C4Aa - C4a - C3a) (Figure 2). These were observed at 1019.42 cm-1, 857.44 cm-1, 573.41 cm-1 and 551.26 cm-1 respectively (Figure 3). The PED analysis showed that the C - C and N - C stretching, bending and torsion vibrations are mixed with other vibrations and with themselves. An example is the prediction of a mode at 1610.62 cm-1 for the stretching of C4a - C4Aa mixed with the stretching of C4 - C4A which was observed at 1598.3 cm-1. Another example is the mode predicted at 1377.01 cm-1 for the stretching of N9 - C9A and the bending of N9 - C9A - C1 which was observed at 1335.43 cm-1. Supporting Information S2 gives a comprehensive table of these modes. The Ultraviolet region falls in the wavelength range 190 nm - 380 nm of the electromagnetic spectrum while the visible region falls between 380 nm and 750 nm. The Ultra-Violet spectrum of a solution of Carbazole dissolved in a solvent mix of Ethanol:Water (1:1 by volume) was determined experimentally and by computational methods using the Gaussian 09 package [14]. The major absorption peaks of Carbazole are in the UV range hence the powder is not coloured [48]. The experimental UV spectrum of Carbazole gives the highest absorbance at 291 nm with minor peaks at 323 nm and 333 nm (Figure 4). Density Functional Theory (DFT) calculations using TD-SCF at B3LYP level of theory using two basis sets was performed. The cc-pVDZ basis set augmented with diffuse functions gives one major peak at 284 nm and a shoulder at 314.8 nm while the LanL2DZ basis set gives a major peak at 235.1 nm [36-40]. The difference in the wavelengths for the peak absorptions may be attributed to the approximations made by the TD-SCF models; the aug-cc-pVDZ basis set gives a better approximation of the UV spectrum since it uses a correlation consistent basis set which is augmented with diffuse functions and is appropriate for excited states of electrons. The LanL2DZ basis set on the other hand is an all electron valence double zeta basis set. To simplify the analysis of DFT computed data, the structure of the carbazole drawn using the OLEX 2 and ORTEP49 package was divided into the arene groups and the pyrrole group (Figure 5)[13]. Electronic Transitions of the Carbazole molecule in the ground state were analysed (Table 4). The intensities have also been assessed based on oscillator strengths (f) in the solvents for the ultraviolet induced electronic transitions. Using the GaussSum package, the highest peak in the UV spectrum is at 284 nm is due to the absorption for the transition from the orbital one orbital lower than the Highest Occupied Molecular Orbital, HOMO, (H-1) to the Lowest Unoccupied Molecular Orbital, LUMO (82%) with a minor contribution from the HOMO to L+1 (14.66%), H-2 to LUMO (1.47%) and HOMO to L+7 (0.88%). This is attributed to π Arene → π*Arene transition. Other absorption wavelengths and the transitions responsible for them are given [44] (Table 4). Frontier Molecular Orbitals (FMO) theory is one of the best theories to explain the chemical stability of a molecule. Highest Occupied Molecular Orbital (HOMO) and Lowest Unoccupied Molecular Orbital (LUMO) are important orbitals of FMOs. The HOMO energy is related to the ability of the molecule in releasing an electron, whereas the LUMO energy gives that of gaining an electron. The Frontier Orbital Gap, FOG, the difference between the LUMO and the HOMO, is an important index for the chemical reactivity and kinetic stability of a molecule. It also measures the resistance to change in electron distribution in a molecule [50]. A molecule with a low frontier orbital gap is more polarizable and will exhibit a significant degree of intramolecular charge-transfer from the electron donor section to the electron acceptor section [51]. The Frontier Molecular Orbitals of the molecule in gas and when dissolved in a solvent system were assessed and it showed that when the molecule is dissolved in the solvent system of Ethanol:water (1:1 by volume), the molecule is more polarizable due to the dissolution. Energies in electron Volts of the various molecular orbitals of the molecule in vacuum, when dissolved in a protic solvent, (solvent mix of Ethanol:Water [1:1 by volume]) and when dissolved in an aprotic solvent, acetone, with the solution exposed to ultraviolet waves were also assessed. GaussSum was used to determine the percentage contribution of the various ‘groups’ in the molecule [44] (Table 5,6 and 7). [Carbazole is soluble in ethanol and acetone] [52]. The band gap, given as the difference between the HOMO and the LUMO, is 4.90 eV. The LUMO is made up mainly from the arene groups, with the pyrrole group contributing only 1%. The HOMO is made up of 74% contribution from the arene groups with the pyrrole group contributing the remaining 26%. When the molecule in the mixed solvent is irradiated with UV in the spectrophotometer, the band gap is reduced to 4.61 eV. The contributions by the various groups however did not change much; the LUMO is made up solely from the arene groups (100%),and the pyrrole group contributes 24% to the HOMO while the arene groups contribute 76% to the HOMO similar to that of the molecule in the ground state (Figure 6,7). When the molecule in acetone is irradiated with UV in the spectrophotometer, however, the band gap is increased to 5.01 eV. The contributions by the various groups however did not change much; the LUMO made up solely from the arene groups (100%).The arene groups also contribute 72% to the HOMO while the pyrrole group contribute only 28% to the HOMO (Table 7). Powder diffraction is a scientific technique using X-ray, neutron, or electron diffraction on powder or microcrystalline samples for structural characterization of materials. It is a non-destructive procedure [53]. About 95% of all solid materials can be described as crystalline. When X-rays interact with a crystalline substance (Phase), one gets a diffraction pattern. This procedure in based on the assumption that ideally, every possible crystalline orientation is represented equally in a powdered sample. The resulting orientational averaging causes the three-dimensional reciprocal space that is studied in single crystal diffraction to be projected onto a single dimension. Each compound, regarded as a phase, gives a distinct characteristic diffractogram when analysed. The position and intensity of peaks in a diffraction pattern are determined by the crystal structure. The scattering of X-rays from atoms produces a diffraction pattern, which contains information about the atomic arrangement within the crystal [54]. The X-ray diffraction pattern of a pure substance is, therefore, like a fingerprint of the substance. The powder diffraction method is thus ideally suited for characterization and identification of polycrystalline phases Each substance is characterized by its three strongest lines (d1, d2, d3). The values of d1- d3 are usually sufficient to characterize the pattern of an unknown and enable the corresponding pattern in a database such as the Powder Diffraction File to be located [55-57]. Any one diffraction pattern is characterised by a set of line positions 2θ and a set of relative intensities. Exact matching of the interplanar spacings (d values) and intensities of all peaks (or lines in the case of powder camera) between the standard and observed diffraction patterns confirms the identity of the unknown as the same as the standard material [58]. The powder diffraction pattern, diffractogram, of carbazole experimental determined has its three major peaks at 2 thetas similar to those the diffractogram simulated using single crystal data as reported by Gajda et al. [12](Table 8). The simulation was done using the Mercury software [59]. All other peaks of the diffractogram determined experimentally are also adequately close to those in the diffractogram simulated from single crystal data of Carbazole published by Gajda et al. (Figure 8). The differences in resolution were due to the scanning step size which was 0.08 ° experimentally and 0.02 ° when simulated from the single crystal structure. The d-spacing of the six most intense peaks in the experimentally determined diffractogram vary from 3.18535 Å to 9.64307 Å (Table 9). Both basis sets, 3-21G and 6-31Gd, used in calculating the structural parameters of Carbazole gave good approximations though generally, the 3-21G basis set performed better. The calculated bond lengths are generally longer and the calculated angles wider than those determined experimentally. The double bonds shared by the pyrrole ring and the arene rings are longer than those in the arene rings alone though in all cases the second bond is 100% p in character. A third of the vibrational modes are from C-H stretching. Bonds are more polarized towards the nitrogen atom than the carbon as expected (from their electronegativity values). The Carbazole molecule is more polarizable when dissolved in a protic solvent of Ethanol:Water (1:1) than in an aprotic solvent (acetone). The arene group in the molecule of Carbazole contributes about 100% to its Lowest Unoccupied Molecular Orbital (LUMO) and about 75% to its Highest Occupied Molecular Orbital (HOMO). Dissolution of Carbazole in a protic solvent, Ethanol:Water mixture, reduces its Frontier Orbital Gap (FOG) by about 6% but increases by about 2.2% when it is dissolved in an aprotic solvent, acetone. The major UV peak at 291 nm (284 nm calculated) is from the transition from HOMO-1 to the LUMO level and is due to π→π* transition by the arene groups. The powder diffractogram of Carbazole has its characteristic peaks, d1, d2 and d3 at 2θ of 9.2 º, 18.48 º and 27.84 º. S1: Natural Bond Orbitals of Carbazole
S2: Normal Vibrational Modes of bonds in Carbazole