Environment and Development: Biomass for Future
People are relying upon oil for primary energy and this will continue for a few more decades. Other conventional sources may be more enduring, but are not without serious disadvantages. The renewable energy resources are particularly suited for the provision of rural power supplies and a major advantage is that equipment such as flat plate solar driers, wind machines, etc., can be constructed using local resources. Without the advantage results from the feasibility of local maintenance and the general encouragement such local manufacture gives to the build up of small-scale rural based industry. This communication comprises a comprehensive review of energy sources, the environment and sustainable development. It includes the renewable energy technologies, energy efficiency systems, energy conservation scenarios, energy savings in greenhouses environment and other mitigation measures necessary to reduce climate change. This study gives some examples of small-scale energy converters, nevertheless it should be noted that small conventional, i.e., engines are currently the major source of power in rural areas and will continue to be so for a long time to come. There is a need for some further development to suit local conditions, to minimise spares holdings, to maximise the interchangeability of the engine parts, and of the engine applications. Emphasis should be placed on full local manufacture. It is concluded that renewable environmentally friendly energy must be encouraged, promoted, implemented and demonstrated by a full-scale plant (device) especially for use in remote rural areas.
This communication discusses a comprehensive review of biomass energy sources, environment and sustainable development. This includes all the biomass energy technologies, energy efficiency systems, energy conservation scenarios, energy savings and other mitigation measures necessary to reduce emissions globally. The current literature is reviewed regarding the ecological, social, cultural and economic impacts of biomass technology. This study gives an overview of present and future use of biomass as an industrial feedstock for production of fuels, chemicals and other materials. However, to be truly competitive in an open market situation, higher value products are required. Results suggest that biomass technology must be encouraged, promoted, invested, implemented, and demonstrated, but especially in remote rural areas.
Keywords: Biomass Resources; Wastes; Energy; Environment; Sustainable Development
This study highlights the energy problem and the possible saving that can be achieved through the use of biomass sources energy. Also, this study clarifies the background of the study, highlights the potential energy saving that could be achieved through use of biomass energy source and describes the objectives, approach and scope of the theme.
The aim of any modern biomass energy systems must be:
• To maximise yields with minimum inputs.
• Utilisation and selection of adequate plant materials and processes.
• Optimum use of land, water, and fertiliser.
• Create an adequate infrastructure and strong R and D base.
There is strong scientific evidence that the average temperature of the earth’s surface is rising. This was a result of the increased concentration of carbon dioxide (CO2), and other greenhouse gases (GHGs) in the atmosphere as released by burning fossil fuels [1,2]. This global warming will eventually lead to substantial changes in the world’s climate, which will, in turn, have a major impact on human life and the environment. Energy use can be achieved by minimising the energy demand, by rational energy use, by recovering heat and the use of more green energies. This will lead to fossil fuels emission reduction. This study was a step towards achieving this goal. The adoption of green or sustainable approaches to the way in which society is run is seen as an important strategy in finding a solution to the energy problem. The key factors to reducing and controlling CO2, which is the major contributor to global warming, are the use of alternative approaches to energy generation and the exploration of how these alternatives are used today and may be used in the future as green energy sources. The non-technical issues, which have recently gained attention, include: (1) Environmental and ecological factors, e.g., carbon sequestration, reforestation and revegetation. (2) Renewables as a CO2 neutral replacement for fossil fuels. (3) Greater recognition of the importance of renewable energy, particularly modern biomass energy carriers, at the policy and planning levels. (4) Greater recognition of the difficulties of gathering good and reliable biomass energy data, and efforts to improve it. (5) Studies on the detrimental health efforts of biomass energy particularly from traditional energy users. There is a need for some further development to suit local conditions, to minimise spares holdings, to maximise interchangeability both of engine parts and of the engine application. Emphasis should be placed on full local manufacture [3].
Fossil fuels, especially oil and natural gas, are finite in extent, and should be regarded as depleting assets, and efforts are oriented to search for new sources of energy. The clamour all over the world for the need to conserve energy and the environment has intensified as traditional energy resources continue to dwindle whilst the environment becomes increasingly degraded [4].
Large-scale, conventional, power plant such as hydropower has an important part to play in development. It does not, however, provide a complete solution. There is an important complementary role for the greater use of small scale, rural based-power plants. Such plant can be used to assist development since it can be made locally using local resources, enabling a rapid built-up in total equipment to be made without a corresponding and unacceptably large demand on central funds. Renewable resources are particularly suitable for providing the energy for such equipment and its use is also compatible with the long-term aims [5]. In compiling energy consumption data one can categorise usage according to a number of different schemes:
• Traditional sector- industrial, transportation, etc.
• End-use- space heating, process steam, etc.
• Final demand- total energy consumption related to automobiles, to food, etc.
• Energy source- oil, coal, etc.
• Energy form at point of use- electric drive, low temperature heat, etc.
Bioenergy is energy from the sun stored in materials of biological origin. This includes plant matter and animal waste, known as biomass. Plants store solar energy through photosynthesis in cellulose and lignin, whereas animals store energy as fats. When burned, these sugars break down and release energy exothermically, releasing carbon dioxide (CO2), heat and steam. The by-products of this reaction can be captured and manipulated to create power, commonly called bioenergy. Biomass is considered renewable because the carbon (C) is taken out of the atmosphere and replenished more quickly than the millions of years required for fossil fuels to form. The use of biofuels to replace fossil fuels contributes to a reduction in the overall release of carbon dioxide into the atmosphere and hence helps to tackle global warming [6].
The biomass energy resources are particularly suited for the provision of rural power supplies and a major advantage is that equipment such as flat plate solar driers, wind machines, etc., can be constructed using local resources and without the high capital cost of more conventional equipment. Further advantage results from the feasibility of local maintenance and the general encouragement such local manufacture gives to the build up of small scale rural based industry. Table 1 lists the energy sources available. Currently the ‘non-commercial’ fuels wood, crop residues and animal dung are used in large amounts in the rural areas of developing countries, principally for heating and cooking; the method of use is highly inefficient. Table 2 presented some renewable applications. Table 3 lists the most important of energy needs. Table 4 listed methods of energy conversion.
Considerations when selecting power plant include the following:
• Power level- whether continuous or discontinuous.
• Cost- initial cost, total running cost including fuel, maintenance and capital amortised over life and complexity of operation.
• Maintenance and availability of spares.
• Life and suitability for local manufacture.
The internal combustion engine is a major contributor to rising CO2 emissions worldwide and some pretty dramatic new thinking is needed if our planet is to counter the effects. With its use increasing in developing world economies, there is something to be said for the argument that the vehicles we use to help keep our inner-city environments free from waste, litter and grime should be at the forefront of developments in low-emissions technology. Materials handled by waste management companies are becoming increasingly valuable. Those responsible for the security of facilities that treat waste or manage scrap will testify to the precautions needed to fight an ongoing battle against unauthorised access by criminals and crucially, to prevent the damage they can cause through theft, vandalism or even arson. Of particular concern is the escalating level of metal theft, driven by various factors including the demand for metal in rapidly developing economies such as India and China [7].
There is a need for greater attention to be devoted to this field in the development of new designs, the dissemination of information and the encouragement of its use. International and government bodies and independent organisations all have a role to play in biomass energy technologies.
Environment has no precise limits because it is in fact a part of everything. Indeed, environment is, as anyone probably already knows, not only flowers blossoming or birds singing in the spring, or a lake surrounded by beautiful mountains.
It is also human settlements, the places where people live, work, rest, the quality of the food we eat, the noise or silence of the street they live in. Environment is not only the fact that our cars consume a good deal of energy and pollute the air, but also, that we often need them to go to work and for holidays. Obviously man uses energy just as plants, bacteria, mushrooms, bees, fish and rats do. Man largely uses solar energy- food, hydropower, wood- and thus participates harmoniously in the natural flow of energy through the environment. But man also uses oil, gas, coal and nuclear power. We always modify our environment with or without this source of energy [9]. Economic importance of environmental issue is increasing, and new technologies are expected to reduce pollution derived both from productive processes and products, with costs that are still unknown. This is due to market uncertainty, weak appropriability regime, lack of a dominant design, and difficulties in reconfiguring organisational routines. The degradation of the global environment is one of the most serious energy issues [10].
The range of waste treatment technologies that are tailored to produce bioenergy is growing.
There are a number of key areas of bioenergy from wastes including (but not limited to) biogas, biofuels and bioheat. When considering using bioenergy, it is important to take into account the overall emission of carbon in the process of electricity production.
In addition to the drain on resources, such an increase in consumption consequences, together with the increased hazards of pollution and the safety problems associated with a large nuclear fission programmes. It would be equally unacceptable to suggest that the difference in energy between the developed and developing countries and prudent for the developed countries to move towards a way of life which, whilst maintaining or even increasing quality of life, reduce significantly the energy consumption per capita. Such savings can be achieved in a number of ways:
• Improved efficiency of energy use, for example environmental cost of thermal insulation must be taken into account, energy
recovery, and total energy.
• Conservation of energy resources by design for long life and recycling rather than the short life throwaway product and systematic
replanning of our way of life, for example in the field of transport.
Energy ratio (Er) is defined as the ratio of Energy content (Ec) of the food product / Energy input (Ei) to produce the food as in equation (1).

The atmospheric emissions of fossil fuelled installations are mostly aldehydes (CH3CH2CH2CHO), carbon monoxide (CO), nitrogen oxides (NOX), sulpher oxides (SOx) and particles (i.e., ash) as well as carbon dioxide. Table 5 shows estimates include not only the releases occurring at the power plant itself but also cover fuel extraction and treatment, as well as the storage of wastes and the area of land required for operation (Table 6). A review of the potential range of recyclables is presented in Table 7.
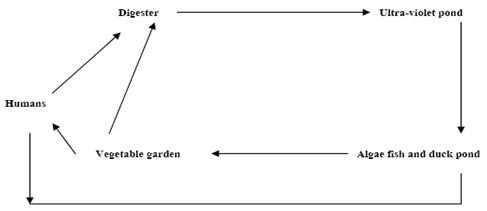
Scientific assumptions for a short-term energy strategy suggest that the most economically efficient way to replace the thermal plants is to modernise existing power plants to increase their energy efficiency and to improve their environmental performance [11]. Figure 1 summarises the biomass utilisation cycle concept.
The encouragement of greater energy use is an essential component of development. In the short-term, it requires mechanisms to enable the rapid increase in energy/capita, while in the long-term it may require the use of energy efficiency without environmental and safety concerns. Such programmes should as far as possible be based on renewable energy resources.
Large-scale, conventional, power plant such as hydropower has an important part to play in development although it does not provide a complete solution. There is however an important complementary role for the greater use of small-scale, rural based power plants. Such plants can be employed to assist development since they can be made locally. Renewable resources are particularly suitable for providing the energy for such equipment and its use is also compatible with the long-term aims.
However, utilisation of wind power and the conversion of gas-fired CHP plants to biomass would significantly reduce the dependence on imported fossil fuels. Although a lack of generating capacity is forecasted in the long-term, utilisation of the existing renewable energy potential and the huge possibilities for increasing energy efficiency are sufficient to meet future energy demands in the short-term [11].
A total shift towards a sustainable energy system is a complex and long process, but is one that can be achieved within a period of about 20 years. A vision that used methodologies and calculations based on computer modelling can utilised:
• Data from existing governmental programmes.
• Potential renewable energy sources and energy efficiency improvements.
• Assumptions for future economy growth.
• Information from studies and surveys on the recent situation in the energy sector.
The increased availability of reliable and efficient energy services stimulates new development alternatives. This communication discusses the potential for such integrated systems in the stationary and portable power market in response to the critical need for a cleaner energy technology. Anticipated patterns of future energy use and consequent environmental impacts (acid precipitation, ozone depletion and the greenhouse effect or global warming) are comprehensively discussed in this chapter. Throughout the theme several issues relating to renewable energies, environment, and sustainable development are examined from both current and future perspectives. It is concluded that green energies like wind, solar, ground-source heat pumps, and biomass must be promoted, implemented, and demonstrated from the economic and/or environmental point view. The key factors to reducing and controlling CO2, which is the major contributor to global warming, are the use of alternative approaches to energy generation and the exploration of how these alternatives are used today and may be used in the future as green energy sources. Even with modest assumptions about the availability of land, comprehensive fuel-wood farming programmes offer significant energy, economic and environmental benefits. These benefits would be dispersed in rural areas where they are greatly needed and can serve as linkages for further rural economic development. There is strong scientific evidence that the average temperature of the earth’s surface is rising. This was a result of the increased concentration of carbon dioxide (CO2), and other greenhouse gases (GHGs) in the atmosphere as released by burning fossil fuels. This global warming will eventually lead to substantial changes in the world’s climate, which will, in turn, have a major impact on human life and the environment. Energy use reductions can be achieved by minimising the energy demand, by rational energy use, by recovering heat and the use of more green energies. This study was a step towards achieving this goal. The adoption of green or sustainable approaches to the way in which society is run is seen as an important strategy in finding a solution to the energy problem.
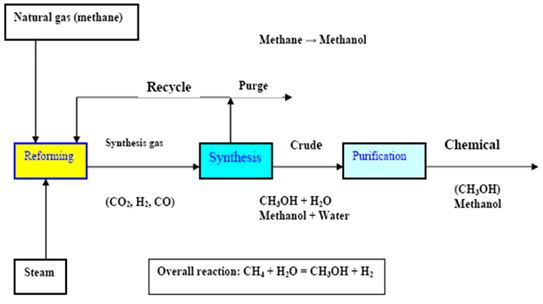
Figure 2 shows methanol production.
In some countries, a wide range of economic incentives and other measures are already helping to protect the environment. These include:
• Taxes and user charges that reflect the costs of using the environment, e.g., pollution taxes and waste disposal charges.
• Subsidies, credits and grants that encourage environmental protection.
• Deposit-refund systems that prevent pollution on resource misuse and promote product reuse or recycling.
• Financial enforcement incentives, e.g., fines for non-compliance with environmental regulations.
• Tradable permits for activities that harm the environment.
The district Heating (DH), also known as community heating can be a key factor to achieve energy savings, reduce CO2 emissions and at the same time provide consumers with a high quality heat supply at a competitive price. The DH should generally only be considered for areas where the heat density is sufficiently high to make DH economical. In countries like Denmark DH may today be economical even to new developments with lower density areas due to the high level of taxation on oil and gas fuels combined with the efficient production of the DH. To improve the opportunity for the DH local councils can adapt the following plan:
• Analyse the options for heat supply during local planning stage.
• In areas where DH is the least cost solution it should be made part of the infrastructure just like for instance water and sewage
connecting all existing and new buildings.
• Where possible all public buildings should be connected to the DH.
• The government provides low interest loans or funding to minimise conversion costs for its citizens.
• Use other powers, for instance national legislation to ensure the most economical development of the heat supply and enable an
obligation to connect buildings to a DH scheme.
Denmark has broadly seen three scales of the CHP which where largely implemented in the following order [11]:
• Large-scale CHP in cities (>50 MWe).
• Small (5 kWe – 5 MWe) and medium-scale (5-50 MWe).
• Industrial and small-scale CHP.
Most of the heat is produced by large CHP plants (gas-fired combined cycle plants using natural gas, biomass, waste or biogas). The DH is energy efficient because of the way the heat is produced and the required temperature level is an important factor. Buildings can be heated to temperature of 21 oC and domestic hot water can be supplied with a temperature of 55 oC using energy sources that are most efficient when producing low temperature levels (<95 oC) for the DH water. Most of these heat sources are CO2 neutral or emit low levels. Only a few of these sources are available to small individual systems at a reasonably cost, whereas DH schemes because of the plant’s size and location can have access to most of the heat sources and at a low cost. Low temperature DH, with return temperatures of around 30-40 oC can utilise the following heat sources:
• Efficient use of the CHP by extracting heat at low calorific value.
• Efficient use of biomass or gas boilers by condensing heat in economisers (Table 8).
• Efficient utilisation of geothermal energy.
• Direct utilisation of excess low temperature heat from industrial processes.
• Efficient use of large-scale solar heating plants.
Heat tariffs may include a number of components such as: a connection charge, a fixed charge and a variable energy charge. Also, consumers may be incentivised to lower the return temperature. Hence, it is difficult to generalise but the heat practice for any DH company no matter what the ownership structure can be highlighted as follows:
• To develop and maintain a development plan for the connection of new consumers.
• To evaluate the options for least cost production of heat.
• To implement the most competitive solutions by signing agreements with other companies or by implementing own investment
projects.
• To monitor all internal costs and with the help of benchmarking, improve the efficiency of the company.
• To maintain a good relationship with the consumer and deliver heat supply services at a sufficient quality.
Installing DH should be pursued to meet the objectives for improving the environment through the improvement of energy efficiency in the heating sector. At the same time DH can serve the consumer with a reasonable quality of heat at the lowest possible cost. The variety of possible solutions combined with the collaboration between individual companies, the DH association, the suppliers and consultants can, as it has been in Denmark, be the way forward for developing DH in the United Kingdom [11].
Sustainable energy is energy that, in its production or consumption, has minimal negative impacts on human health and the healthy functioning of vital ecological systems, including the global environment. It is an accepted fact that renewable energy is a sustainable form of energy, which has attracted more attention during recent years. A great amount of renewable energy potential, environmental interest, as well as economic consideration of fossil fuel consumption and high emphasis of sustainable development for the future will be needed.
Explanations for the use of inefficient agricultural-environmental polices include the high cost of information required to measure benefits on a site-specific basis, information asymmetries between government agencies and farm decision makers that result in high implementation costs, distribution effects and political considerations [14]. Achieving the aim of agric-environment schemes through:
• Sustain the beauty and diversity of the landscape.
• Improve and extend wildlife habitats.
• Conserve archaeological sites and historic features.
• Improve opportunities for countryside enjoyment.
• Restore neglected land or features, and
• Create new habitats and landscapes.
The data required to perform the trade-off analysis simulation can be classified according to the divisions given in Table 9: the overall system or individual plants, and the existing situation or future development. The effective economic utilisations of these resources are shown in Table 10, but their use is hindered by many problems such as those related to harvesting, collection, and transportation, besides the sanitary control regulations. Biomass energy is experiencing a surge in an interest stemming from a combination of factors, e.g., greater recognition of its current role and future potential contribution as a modern fuel, global environmental benefits, its development and entrepreneurial opportunities, etc. Possible routes of biomass energy development are shown in Table 11.
The key to successful future appears to lie with successful marketing of the treatment by products. There is also potential for using solid residue in the construction industry as a filling agent for concrete. Research suggests that the composition of the residue locks metals within the material, thus preventing their escape and any subsequent negative effect on the environment [15]. The use of biomass through direct combustion has long been, and still is, the most common mode of biomass utilisation as shown in Tables (9, 10 and 11).
Examples for dry (thermo-chemical) conversion processes are charcoal making from wood (slow pyrolysis), gasification of forest and agricultural residues (fast pyrolysis – this is still in demonstration phase), and of course, direct combustion in stoves, furnaces, etc.
Globally, buildings are responsible for approximately 40% of the total world annual energy consumption. Most of this energy is for the provision of lighting, heating, cooling, and air conditioning. Increasing awareness of the environmental impact of CO2, NOX and CFCs emissions triggered a renewed interest in environmentally friendly cooling, and heating technologies. Under the 1997 Montreal Protocol, governments agreed to phase out chemicals used as refrigerants that have the potential to destroy stratospheric ozone. It was therefore considered desirable to reduce energy consumption and decrease the rate of depletion of world energy reserves and pollution of the environment. One way of reducing building energy consumption is to design buildings, which are more economical in their use of energy for heating, lighting, cooling, ventilation and hot water supply. Passive measures, particularly natural or hybrid ventilation rather than air-conditioning, can dramatically reduce primary energy consumption.
However, exploitation of renewable energy in buildings and agricultural greenhouses can, also, significantly contribute towards reducing dependency on fossil fuels. Therefore, promoting innovative renewable applications and reinforcing the renewable energy technologies market will contribute to preservation of the ecosystem by reducing emissions at local and global levels. This will also contribute to the amelioration of environmental conditions by replacing conventional fuels with renewable energies that produce no air pollution or greenhouse gases.
Wet processes require substantial amount of water to be mixed with the biomass. Biomass technologies include:
• Briquetting.
• Improved stoves.
• Biogas.
• Improved charcoal.
• Carbonisation.
• Gasification.
The increased demand for gas and petroleum, food crops, fish and large sources of vegetative matter mean that the global harvesting of carbon has in turn intensified. It could be said that mankind is mining nearly everything except its waste piles. It is simply a matter of time until the significant carbon stream present in municipal solid waste is fully captured. In the meantime, the waste industry needs to continue on the pathway to increased awareness and better-optimised biowaste resources.
Optimisation of waste carbon may require widespread regulatory drivers (including strict limits on the landfilling of organic materials), public acceptance of the benefits of waste carbon products for soil improvements/crop enhancements and more investment in capital facilities [16].
In short, a significant effort will be required in order to capture a greater portion of the carbon stream and put it to beneficial use.
From the standpoint of waste practitioners, further research and pilot programmes are necessary before the available carbon in the waste stream can be extracted in sufficient quality and quantities to create the desired end products.
Other details need to be ironed out too, including measurement methods, diversion calculations, sequestration values and determination of acceptance contamination thresholds [17]. Therefore, effort has to be made to reduce fossil energy use and to promote green energies, particularly in the building sector. Energy use reductions can be achieved by minimising the energy demand, by rational energy use, by recovering heat and the use of more green energies. This study was a step towards achieving that goal.
Charcoal stoves are very familiar to African society. As for the stove technology, the present charcoal stove can be used, and can be improved upon for better efficiency. This energy term will be of particular interest to both urban and rural households and all the income groups due to the simplicity, convenience, and lower air polluting characteristics. However, the market price of the fuel together with that of its end-use technology may not enhance its early high market penetration especially in the urban low income and rural households.
Briquetting is the formation of a charcoal (an energy-dense solid fuel source) from otherwise wasted agricultural and forestry residues. One of the disadvantages of wood fuel is that it is bulky with a low energy density and is therefore enquire to transport. Briquette formation allows for a more energy-dense fuel to be delivered, thus reducing the transportation cost and making the resource more competitive. It also adds some uniformity, which makes the fuel more compatible with systems that are sensitive to the specific fuel input [18].
Traditional wood stoves can be classified into four types: three stone, metal cylindrical shaped, metal tripod and clay type. Another area in which rural energy availability could be secured where woody fuels have become scarce, are the improvements of traditional cookers and ovens to raise the efficiency of fuel saving. Also, to provide a constant fuel supply by planting fast growing trees. The rural development is essential and economically important since it will eventually lead to better standards of living, people’s settlement, and self sufficient in the following:
• Food and water supplies.
• Better services in education and health care.
• Good communication modes.
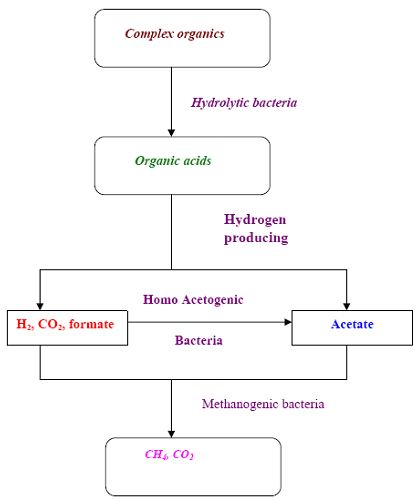
Biogas is a generic term for gases generated from the decomposition of organic material. As the material breaks down, methane (CH4) is produced as shown in Figure 3.
Sources that generate biogas are numerous and varied. These include landfill sites, wastewater treatment plants and anaerobic digesters. Landfills and wastewater treatment plants emit biogas from decaying waste. To date, the waste industry has focused on controlling these emissions to our environment and in some cases, tapping this potential source of fuel to power gas turbines, and thus generating electricity. The primary components of landfill gas are methane (CH4), carbon dioxide (CO2), and nitrogen (N2). The average concentration of methane is ~45%, CO2 is ~36% and nitrogen is ~18%. Other components in the gas are oxygen (O2), water vapour and trace amounts of a wide range of non-methane organic compounds (NMOCs).
Biogas technology cannot only provide fuel, but is also important for comprehensive utilisation of biomass forestry, animal husbandry, fishery, agricultural economy, protecting the environment, and realising agricultural recycling, as well as improving the sanitary conditions, in rural areas. The introduction of biogas technology on wide scale has implications for macro planning such as the allocation of government investment and effects on the balance of payments. Factors that determine the rate of acceptance of biogas plants, such as credit facilities and technical backup services, are likely to have to be planned as part of general macro-policy, as do the allocation of research and development funds [20].
Direct burning of fuel-wood and crop residues constitute the main usage of biomass, as is the case with many developing countries. However, the direct burning of biomass in an inefficient manner causes economic loss and adversely affects human health. In order to address the problem of inefficiency, research centres around the world have investigated the viability of converting the resource to a more useful form, namely solid briquettes and fuel gas (Figure 4).
Biomass resources play a significant role in energy supply in all developing countries. Biomass resources should be divided into residues or dedicated resources, the latter including firewood and charcoal can also be produced from forest residues (Table 12). Implementing measures for energy efficiency will increase at the demand side and in the energy transformation sector.
The renewable energy resources are particularly suited for the provision of rural power supplies and a major advantage is that equipment such as flat plate solar driers, wind machines, etc., can be constructed using local resources and with the advantage resulting from the feasibility of local maintenance and the positive influence such local manufacturing has on small- scale rural based industry. This study gives some examples of small-scale energy converters, nevertheless it should be noted that small conventional, i.e., engines are currently the major source of power in rural areas and will continue to be so for a long time to come. There is a need for some further development to suit local conditions, to minimise spares holdings, to maximise the interchangeability of the engine parts and of the engine applications. Emphasis should be placed on full local manufacture.
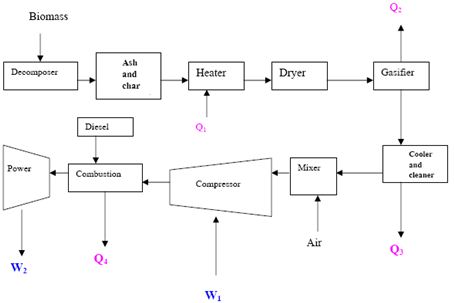
Gasification is based on the formation of a fuel gas (mostly CO and H2) by partially oxidising raw solid fuel at high temperatures in the presence of steam or air. The technology can use wood chips, groundnut shells, sugarcane bagasse, and other similar fuels to generate capacities from 3 kW to 100 kW [22]. Three types of gasifier designs have been developed to make use of the diversity of fuel inputs and to meet the requirements of the product gas output (degree of cleanliness, composition, heating value, etc.). The requirements of gas for various purposes, and a comparison between biogas and various commercial fuels in terms of calorific value, and thermal efficiency are presented in Table 13.
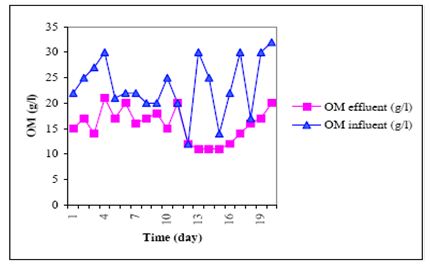
The organic matter was biodegradable to produce biogas and the variation show a normal methanogene bacteria activity and good working biological process as shown in Figures 5, 6 and 7.
The success of promoting any technology depends on careful planning, management, implementation, training and monitoring. Main features of gasification project are:
• Networking and institutional development/strengthening.
• Promotion and extension.
• Construction of demonstration projects.
• Research and development, and training and monitoring
Biomass is a raw material that has been utilised for a wide variety of tasks since the dawn of civilisation. Important as a supply of fuel in the third world, biomass was also the first raw material in the production of textiles.
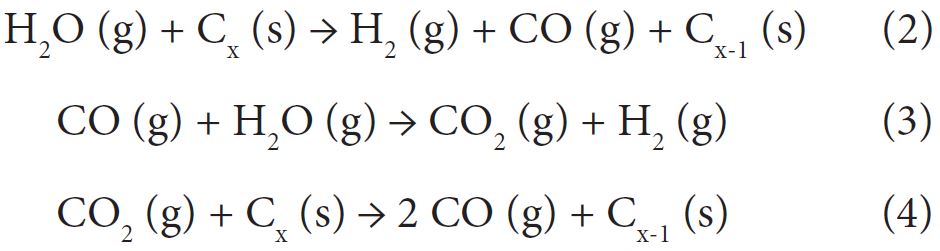
The gasification of the carbon char with steam can make a large difference to the surface area of the carbon as shown in equations (2-4). The corresponding stream gasification reactions are endothermic and demonstrate how the steam reacts with the carbon char [23].
The sources to alleviate the energy situation in the world are sufficient to supply all foreseeable needs. Conservation of energy and rationing in some form will however have to be practised by most countries, to reduce oil imports and redress balance of payments positions. Meanwhile development and application of nuclear power and some of the traditional solar, wind and water energy alternatives must be set in hand to supplement what remains of the fossil fuels.
The encouragement of greater energy use is an essential component of development. In the short-term it requires mechanisms to enable the rapid increase in energy/capita, and in the long-term we should be working towards a way of life, which makes use of energy efficiency and without the impairment of the environment or of causing safety problems. Such a programme should as far as possible be based on renewable energy resources.
For hot water and heating, renewables contributions come from biomass power and heat, geothermal direct heat, ground source heat pumps, and rooftop solar hot water and space heating systems. Solar assisted cooling makes a very small but growing contribution. When it comes to the installation of large amounts of the PV, the cities have several important factors in common.
These factors include:
• A strong local political commitment to the environment and sustainability.
• The presence of municipal departments or offices dedicated to the environment, and sustainability or renewable energy.
• Information provision about the possibilities of renewables.
• Obligations that some or all buildings include renewable energy.
Bioenergy is a growing source of power that is playing an ever-increasing role in the provision of electricity. The potential contribution of the waste industry to bioenergy is huge and has the ability to account for a source of large amount of total bioenergy production. Woody biomass is usually converted into power through combustion or gasification. Biomass can be specially grown in the case of energy crops. Waste wood makes up a significant proportion of a variety of municipal, commercial and industrial waste streams.
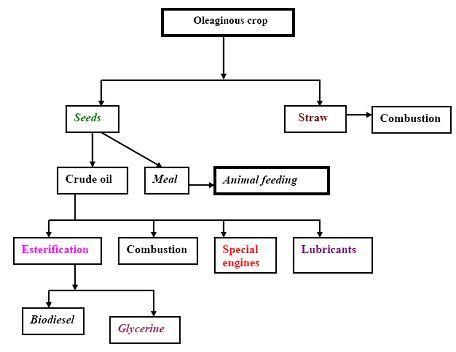
It is common practice to dispose of this waste wood in landfill where it slowly degraded and takes up valuable void space. This wood is a good source of energy and is an alternative to energy crops. The biomass directly produced by cultivation can be transformed by different processes into gaseous, liquid or solid fuels (Table 14). The whole process of production of methyl or ethyl esters (biodiesel) is summarised in Figures 8 and 9.
In terms of solid waste management policy, many NGOs have changed drastically in the past ten years from a mass production and mass consumption society to ‘material-cycle society’. In addition to national legislation, municipalities are legally obliged to develop a plan for handling the municipal solid waste generated in administrative areas.
Such plans contain:
• Estimates of future waste volume.
• Measures to reduce waste.
• Measures to encourage source separation.
• A framework for solid waste disposal and the construction and management of solid waste management facilities.
Landfilling is in the least referred tier of the hierarchy of waste management options: waste minimisation, reuse and recycling, incineration with energy recovery, and optimised final disposal.
The key elements are as follows: construction impacts, atmospheric emissions, noise, water quality, landscape, visual impacts, socio economics, ecological impacts, traffic, solid waste disposal and cultural heritage [24].
• Reduction of dependence on import of energy and related products.
• Reduction of environmental impact of energy production (greenhouse effect, air pollution, and waste degradation).
• Substitution of food crops and reduction of food surpluses and of related economic burdens.
• Utilisation of marginal lands and of set aside lands and reduction of related socio-economic and environmental problems (soil er sion, urbanisation, landscape deterioration, etc.).
• Development of new know-how and production of technological innovation.
A study individuated on the basis of botanical, genetical, physiological, biochemical, agronomical and technological knowledge reported in literature some 150 species potentially exploitable divided as reported in Table 15 [23].
Turning to chemical engineering and the experience of the chemical process industry represents a wakening up but does not lead to an immediate solution to the problems. The traditional techniques are not very kind to biological products, which are controlled by difficulty and unique physico-chemical properties such as low mechanical, thermal and chemical stabilities. There is the question of selectivity. By the standards of the process streams in chemical industry, fermenter is highly impure and extremely dilutes aqueous systems (Table 16).
The disadvantages of the fermentation media are as the following: mechanically fragile, temperature sensitive, rapidly deteriorating quality, harmful if escaping into the environment, corrosive (acids, chlorides, etc.), and troublesome (solids, theological, etc.), and expensive. Thus, pilot plants for scale-up work must be flexible. In general, they should contain suitably interconnected equipment for fermentation, primary separation, cell disruption fractionalises and clarifications, purification by mean of high-resolution techniques and concentration and dry.
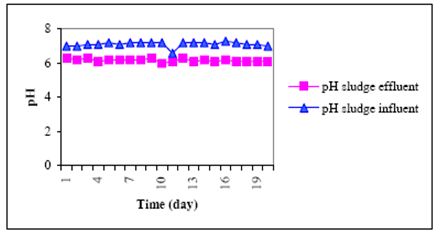
An important consideration for operators of wastewater treatment plants is how to handle the disposal of the residual sludge in a reliable, sustainable, legal and economical way. The benefits of drying sludge can be seen in two main treatment options:
• Use of the dewatered sludge as a fertiliser or in fertiliser blends.
• Incineration with energy recovery.
Use as a fertiliser takes advantage of the high organic content 40%-70% of the dewatered sludge and its high levels of phosphorous and other nutrients. However, there are a number of concerns about this route including:
• The chemical composition of the sludge (e.g., heavy metals, hormones and other pharmaceutical residues).
• Pathogen risk (e.g., Salmonella, Escherichia coli, prionic proteins, etc.).
• Potential accumulation of heavy metals and other chemicals in the soil.
Sludge can be applied as a fertiliser in three forms: liquid sludge, wet cake blended into compost, and dried granules. The advantages of energy recovery sludge include:
• The use of dewatered sludge is a ‘sink’ for pollutants such as heavy metals, toxic organic compounds and pharmaceutical residues.
Thus, offering a potential disposal route for these substances provided the combustion plant has adequate flue gas cleaning.
• The potential, under certain circumstances, to utilise the inorganic residue from sludge incineration (incinerator ash), such as in
cement or gravel.
• The high calorific value (similar to lignite) of dewatered sludge.
• The use of dewatered sludge as a carbon dioxide neutral substitute for primary fuels such as oil, gas and coal.
Energy efficiency is the most cost-effective way of cutting carbon dioxide emissions and improvements to households and businesses. It can also have many other additional social, economic and health benefits, such as warmer and healthier homes, lower fuel bills and company running costs and, indirectly, jobs. Britain wastes 20 per cent of its fossil fuel and electricity use in transportation. This implies that it would be cost-effective to cut £10 billion a year off the collective fuel bill and reduce CO2 emissions by some 120 million tones CO2. Yet, due to lack of good information and advice on energy saving, along with the capital to finance energy efficiency improvements, this huge potential for reducing energy demand is not being realised. Traditionally, energy utilities have been essentially fuel providers and the industry has pursued profits from increased volume of sales. Institutional and market arrangements have favoured energy consumption rather than conservation. However, energy is at the centre of the sustainable development paradigm as few activities affect the environment as much as the continually increasing use of energy. Most of the used energy depends on finite resources, such as coal, oil, gas and uranium. In addition, more than three quarters of the world’s consumption of these fuels is used, often inefficiently, by only one quarter of the world’s population. Without even addressing these inequities or the precious, finite nature of these resources, the scale of environmental damage will force the reduction of the usage of these fuels long before they run out [26].
Throughout the energy generation process there are impacts on the environment on local, national and international levels, from opencast mining and oil exploration to emissions of the potent greenhouse gas carbon dioxide in ever increasing concentration. Recently, the world’s leading climate scientists reached an agreement that human activities, such as burning fossil fuels for energy and transport, are causing the world’s temperature to rise. The Intergovernmental Panel on Climate Change has concluded that ‘‘the balance of evidence suggests a discernible human influence on global climate’’. It predicts a rate of warming greater than any one seen in the last 10,000 years, in other words, throughout human history. The exact impact of climate change is difficult to predict and will vary regionally. It could, however, include sea level rise, disrupted agriculture and food supplies and the possibility of more freak weather events such as hurricanes and droughts. Indeed, people already are waking up to the financial and social, as well as the environmental, risks of unsustainable energy generation methods that represent the costs of the impacts of climate change, acid rain and oil spills. The insurance industry, for example, concerned about the billion dollar costs of hurricanes and floods, has joined sides with environmentalists to lobby for greenhouse gas emissions reduction. Friends of the earth are campaigning for a more sustainable energy policy, guided by the principal of environmental protection and with the objectives of sound natural resource management and long-term energy security. The key priorities of such an energy policy must be to reduce fossil fuel use, move away from nuclear power, improve the efficiency with which energy is used and increase the amount of energy obtainable from sustainable and renewable sources. Efficient energy use has never been more crucial than it is today, particularly with the prospect of the imminent introduction of the climate change levy (CCL). Establishing an energy use action plan is the essential foundation to the elimination of energy waste. A logical starting point is to carry out an energy audit that enables the assessment of the energy use and determine what actions to take [27].
The actions are best categorised by splitting measures into the following three general groups:
High priority/low cost:
These are normally measures, which require minimal investment and can be implemented quickly. The followings are some examples of such measures:
• Good housekeeping, monitoring energy use and targeting waste-fuel practices.
• Adjusting controls to match requirements.
• Improved greenhouse space utilisation.
• Small capital item time switches, thermostats, etc.
• Carrying out minor maintenance and repairs.
• Staff education and training.
Medium priority/medium cost:
Measures, which, although involve little or no design, involve greater expenditure and can take longer to implement. Examples of such measures are listed below:
• New or replacement controls.
• Greenhouse component alteration, e.g., insulation, sealing glass joints, etc.
• Alternative equipment components, e.g., energy efficient lamps in light fittings, etc.
Long term/high cost:
These measures require detailed study and design. They can be best represented by the followings:
• Replacing or upgrading of plant and equipment.
• Fundamental redesign of systems, e.g., combined heat and power (CHP) installations.
This process can often be a complex experience and therefore the most cost-effective approach is to employ an energy specialist to help.
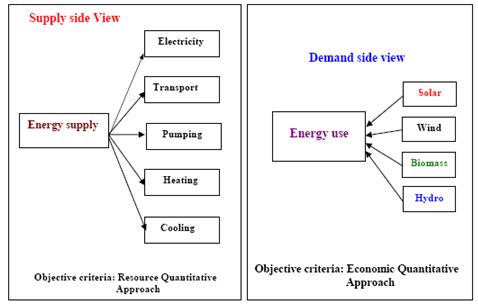
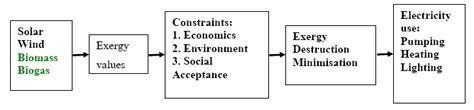
Sustainability is regarded as a major consideration for both urban and rural development. People have been exploiting the natural resources with no consideration to the effects, both short-term (environmental) and long-term (resources crunch). It is also felt that knowledge and technology have not been used effectively in utilising energy resources. Energy is the vital input for economic and social development of any country. Its sustainability is an important factor to be considered. The urban areas depend, to a large extent, on commercial energy sources. The rural areas use non-commercial sources like firewood and agricultural wastes. With the present day trends for improving the quality of life and sustenance of mankind, environmental issues are considered highly important. In this context, the term energy loss has no significant technical meaning. Instead, the exergy loss has to be considered, as destruction of exergy is possible. Hence, exergy loss minimisation will help in sustainability. In the process of developing, there are two options to manage energy resources: (1) End use matching/demand side management, which focuses on the utilities. The mode of obtaining this is decided based on economic terms. It is, therefore, a quantitative approach. (2) Supply side management, which focuses on the renewable energy resource and methods of utilising it. This is decided based on thermodynamic consideration having the resource-user temperature or exergy destruction as the objective criteria. It is, therefore, a qualitative approach. The two options are explained schematically in Figure 10. The exergy-based energy, developed with supply side perspective is shown in Figure 11. The following policy measures had been identified:
• Clear environmental and social objectives for energy market liberalisation, including a commitment to energy efficiency and
renewables.
• Economic, institutional and regulatory frameworks, which encourage the transition to total energy services.
• Economic measures to encourage utility investment in energy efficiency (e.g., levies on fuel bills).
• Incentives for demand side management, including grants for low-income households, expert advice and training, standards for
appliances and buildings and tax incentives.
• Research and development funding for renewable energy technologies not yet commercially viable.
• Continued institutional support for new renewables (such as standard cost-reflective payments and obligation on utilities to buy).
• Ecological tax reform to internalise external environmental and social costs within energy prices.
• Planning for sensitive development and public acceptability for renewable energy.
Energy resources are needed for societal development. Their sustainable development requires a supply of energy resources that are sustainably available at a reasonable cost and can cause no negative societal impacts. Energy resources such as fossil fuels are finite and lack sustainability, while renewable energy sources are sustainable over a relatively longer term. Environmental concerns are also a major factor in sustainable development, as activities, which degrade the environment, are not sustainable. Hence, as much as environmental impact is associated with energy, sustainable development requires the use of energy resources, which cause as little environmental impact as possible. One way to reduce the resource depletion associated with cycling is to reduce the losses that accompany the transfer of exergy to consume resources by increasing the efficiency of exergy transfer between resources, i.e., increasing the fraction of exergy removed from one resource that is transferred to another [28].
As explained above, energy efficiency may be thought of as a more accurate measure of energy efficiency that accounts for quantity and quality aspects of energy flows. Improved exergy efficiency leads to reduced exergy losses. Most efficiency improvements produce direct environmental benefits in two ways. First, operating energy input requirements are reduced per unit output, and pollutants generated are correspondingly reduced. Second, consideration of the entire life cycle for energy resources and technologies suggests that improved efficiency reduces environmental impact during most stages of the life cycle.
Quite often, the main concept of sustainability, which often inspires local and national authorities to incorporate environmental consideration into setting up energy programmes have different meanings in different contexts though it usually embodies a long-term perspective. Future energy systems will largely be shaped by broad and powerful trends that have their roots in basic human needs. Combined with increasing world population, the need will become more apparent for successful implementation of sustainable development [29].
Heat has a lower exergy, or quality of energy, compared with work. Therefore, heat cannot be converted into work by 100% efficiency as shown in equations (5-6). Some examples of the difference between energy and exergy are shown in Table 17.
Carnot Quality Factor (CQF) = (1-To/Ts) (5),
Exergy = Energy (transferred) x CQF (6)
Where To is the environment temperature (K) and Ts is the temperature of the stream (K).
The terms used in Table 17 have the following meanings:
Various parameters are essential to achieving sustainable development in a society. Some of them are as follows:
• Public awareness.
• Information.
• Environmental education and training.
• Innovative energy strategies.
• Renewable energy sources and cleaner technologies.
• Financing.
• Monitoring and evaluation tools
Improving access for rural and urban low-income areas in developing countries must be through energy efficiency and renewable energies. Sustainable energy is a prerequisite for development. Energy-based living standards in developing countries, however, are clearly below standards in developed countries. Low levels of access to affordable and environmentally sound energy in both rural and urban low-income areas are therefore a predominant issue in developing countries. In recent years many programmes for development aid or technical assistance have been focusing on improving access to sustainable energy, many of them with impressive results [12].
Apart from success stories, however, experience also shows that positive appraisals of many projects evaporate after completion and vanishing of the implementation expert team. Altogether, the diffusion of sustainable technologies such as energy efficiency and renewable energies for cooking, heating, lighting, electrical appliances and building insulation in developing countries has been slow. Energy efficiency and renewable energy programmes could be more sustainable and pilot studies more effective and pulse releasing if the entire policy and implementation process was considered and redesigned from the outset.
New financing and implementation processes are needed which allow reallocating financial resources and thus enabling countries themselves to achieve a sustainable energy infrastructure. The links between the energy policy framework, financing and implementation of renewable energy and energy efficiency projects have to be strengthened and capacity building efforts are required.
Alternatively energy sources can potentially help fulfill the acute energy demand and sustain economic growth in many regions of the world. Bioenergy is beginning to gain importance in the global fight to prevent climate change. The scope for exploiting organic waste as a source of energy is not limited to direct incineration or burning refuse-derived fuels. Biogas, biofuels and woody biomass are other forms of energy sources that can be derived from organic waste materials. These biomass energy sources have significant potential in the fight against climate change. Recently, there are many studies on modern biomass Energy technology systems published [30].
Vegetation and in particular forests, can be managed to sequester carbon. Management options have been identified to conserve and sequester up to 90 Pg C in the forest sector in the next century, through global afforestation [31,32]. For efficient use of bioenergy resources, it is essential to take account of the intrinsic energy potential. Despite the availability of basic statistics, many differences have been observed between the previous assessments of bioenergy potential [26,33].
On some climate change issues (such as global warming), there is no disagreement among the scientists. The greenhouse effect is unquestionably real; it is essential for life on earth. Water vapour is the most important GHG; followed by carbon dioxide (CO2). Without a natural greenhouse effect, scientists estimate that the earth’s average temperature would be –18 oC instead of its present 14 oC [27]. There is also no scientific debate over the fact that human activity has increased the concentration of the GHGs in the atmosphere (especially CO2 from combustion of coal, oil and gas). The greenhouse effect is also being amplified by increased concentrations of other gases, such as methane, nitrous oxide, and Chlorofluoro carbons (CFCs) as a result of human emissions. Most scientists predict that rising global temperatures will raise the sea level and increase the frequency of intense rain or snowstorms [34].
Globally, buildings are responsible for approximately 40% of the total world annual energy consumption. Most of this energy is for the provision of lighting, heating, cooling, and air conditioning. Increasing awareness of the environmental impact of CO2, NOX and CFCs emissions triggered a renewed interest in environmentally friendly cooling, and heating technologies. Under the 1997 Montreal Protocol, governments agreed to phase out chemicals used as refrigerants that have the potential to destroy stratospheric ozone. It was therefore considered desirable to reduce energy consumption and decrease the rate of depletion of world energy reserves and pollution of the environment. One way of reducing building energy consumption is to design buildings, which are more economical in their use of energy for heating, lighting, cooling, ventilation and hot water supply. Passive measures, particularly natural or hybrid ventilation rather than air-conditioning, can dramatically reduce primary energy consumption. However, exploitation of renewable energy in buildings and agricultural greenhouses can, also, significantly contribute towards reducing dependency on fossil fuels. Therefore, promoting innovative renewable applications and reinforcing the renewable energy market will contribute to preservation of the ecosystem by reducing emissions at local and global levels [35].
Even with modest assumptions about the availability of land, comprehensive fuel-wood farming programmes offer significant energy, economic and environmental benefits. These benefits would be dispersed in rural areas where they are greatly needed and can serve as linkages for further rural economic development. The nations, as a whole would benefit from savings in foreign exchange, improved energy security, and socio-economic improvements. With a nine-fold increase in forest – plantation cover, the nation’s resource base would be greatly improved. The international community would benefit from pollution reduction, climate mitigation, and the increased trading opportunities that arise from new income sources. Furthermore, investigating the potential is needed to make use of more and more of its waste. Household waste, vegetable market waste, and waste from the cotton stalks, leather, and pulp; and paper industries can be used to produce useful energy either by direct incineration, gasification, digestion (biogas production), fermentation, or cogeneration. Therefore, effort has to be made to reduce fossil energy use and to promote green energies, particularly in the building sector. Energy use reductions can be achieved by minimising the energy demand, by rational energy use, by recovering heat and the use of more green energies. This study was a step towards achieving that goal. The adoption of green or sustainable approaches to the way in which society is run is seen as an important strategy in finding a solution to the energy problem. The key factors to reducing and controlling CO2, which is the major contributor to global warming, are the use of alternative approaches to energy generation and the exploration of how these alternatives are used today and may be used in the future as green energy sources. Even with modest assumptions about the availability of land, comprehensive fuel-wood farming programmes offer significant energy, economic and environmental benefits. These benefits would be dispersed in rural areas where they are greatly needed and can serve as linkages for further rural economic development. The nations as a whole would benefit from savings in foreign exchange, improved energy security, and socio-economic improvements. With a nine-fold increase in forest - plantation cover, a nation’s resource base would be greatly improved. The international community would benefit from pollution reduction, climate mitigation, and the increased trading opportunities that arise from new income sources.
It is a pleasure to acknowledge, with gratitude, all those who, at different times and in different ways, have supported Cleaner and Greener Energy Technologies, Sustainable Development and Environment. This article would not have been possible without the contributions of several people. Also, I acknowledge the International Journal of Extensive Energy Research Institute (ERI), to all of them; I wish to express my gratitude.
Thanks to my wife Kawthar Abdelhai Ali for her warmth and love. Her unwavering faith in me, her intelligence, humour, spontaneity, curiosity and wisdom added to this book and to my life.