Evidence for the Immune-Toxicity of Green Tea Polyphenols: A Computational Study
Adverse drug reactions (ADR) triggered by a drug or its metabolites is an essential aspect of the post-clinical phase in the drug discovery pipeline. The pathophysiology of ADRs has been described in two ways; expected and idiosyncratic. In the current study, we deployed valid computational tools to predict the ability of eight green tea polyphenols to favourably interact with HLA-B*57:01 and mediate idiosyncratic ADRs. First, we deployed molecular docking to understand the free energy profiles before and during peptide presentation scenarios. To better understand the significance of docking, we resolved the chemistry of interactions, similarity coefficients and pharmacophore parameter with which we used to filter four compounds that could be potentially ADR-liable. Our results and inferences were guided by a validation set which contained known HLA-B*57:01 ADR-mediators and a random set of non-ADR mediators. Overall, we show the potential of GTPs in activating T-cell receptors via HLA-B*57:01 which is a timely information for pharmaceutical companies that are testing these compounds in clinical trials.
Adverse Drug Reactions (ADRs) are unpleasant offshoots of therapeutic interventions which are actually life threatening. With the help of Genome Wide Association Studies (GWAS), pharmacogenomics and molecular dynamics studies, the intricate interplay between some immuno-toxic drugs, HLA-B*57:01 and idiosyncratic ADRs have been resolved [1,2]. Sequel to this, several open access reporting systems have been established nationally, continent-wide and globally to monitor ADRs and keep us abreast of emerging drug toxicity.
In 2015 alone, the US FDA Adverse Event Reporting System (FAERS) recorded more than 400,000 ADR reports while the Uppsala Medical Centre in Sweden (on behalf of WHO) has received more than 3,000,000 adverse event reports since its inception in 1971 [3,4]. Consequently more than 578 drugs have been contra-indicated and withdrawn from commercial use due to eventualities of ADR [5]. Also, in the light of the current study, a survey of Vigi Access (the WHO database for adverse events), returned 181 adverse drug events due to ‘catechin [6].
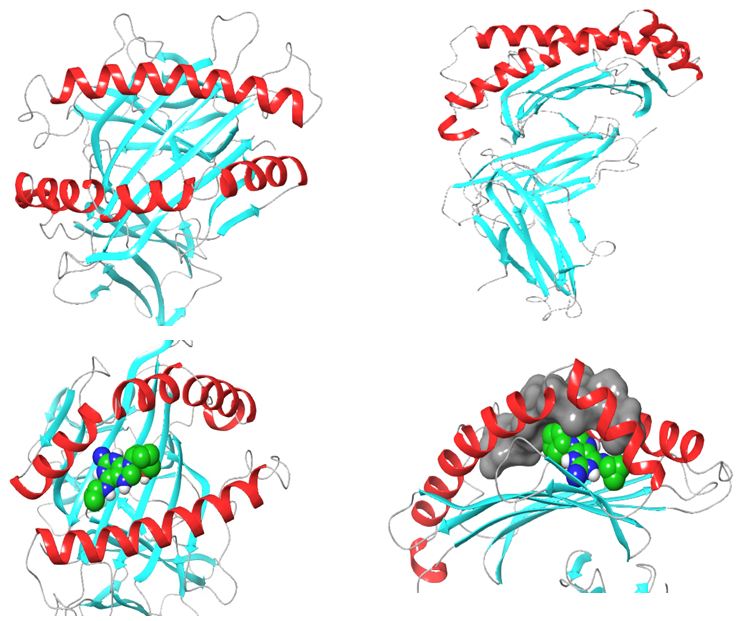
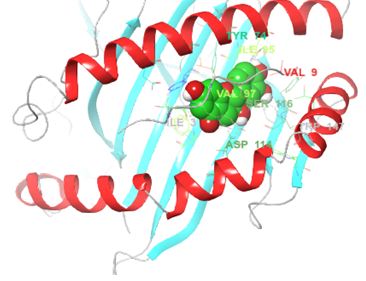
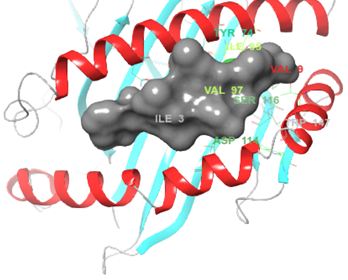
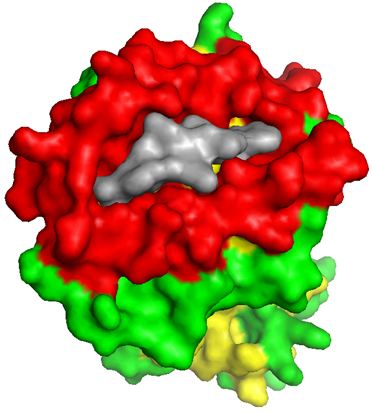
Structurally, class I HLAs are beautiful complexes of (i) two polypeptides that form the antigen binding cleft (ABC), (ii) β-2 microglobulin (required for stabilizing HLA to cell surface) and (iii) an epitope, usually a short self-binding peptide (8-10 AA) [5,7]. To present antigens, HLAs undergo several discrete but transient dynamics occur, which ultimately lead to the loading of the self-binding peptide. However, in all pre-peptide presentation scenarios, there is an initially open β-pleated sheet surrounded by 2 outwardly bending alpha helices (α1 and α2) which forms a large surfaced convex trap that is capable of capturing pathogen-derived antigens. In the case of ADRs, the drug favourably interacts with the orthosteric residues after which an appropriate epitope is loaded and presented as a non-self-molecule; a decisive signalling step in the activation of T-cell receptor (TCR) [5-8] (Figure 1).
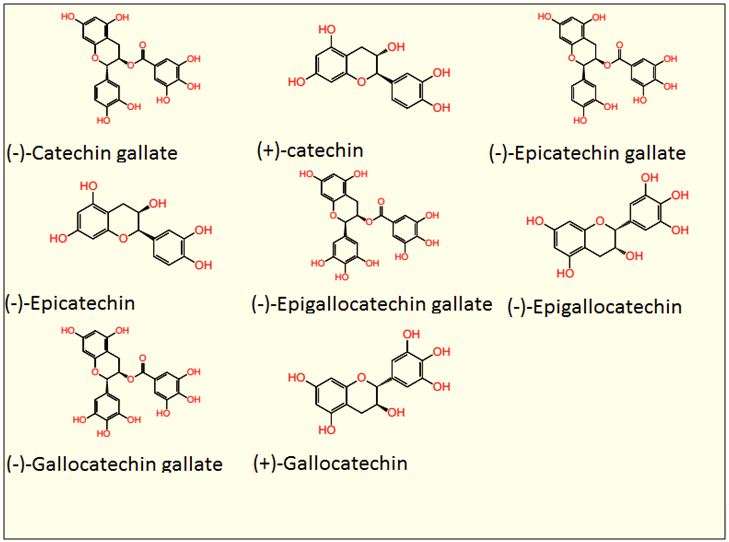
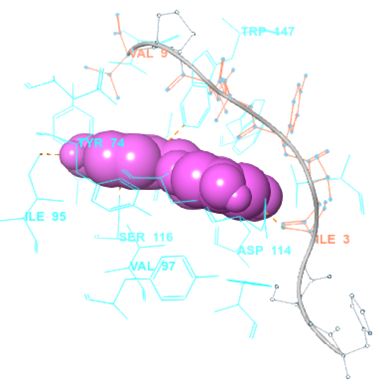
Tea (Camellia sinensis) is an evergreen shrub that is indigenous to East Asia. It is fast becoming a pharmaceutical bioresource for drug development [9-11]. This functional change is now well known to be an offshoot of an octad of green tea polyphenols (GTPs) which include: (-)- Catechin gallate (CG), (+)-catechin (C), (-)-Epicatechingallate (ECG), (-)-Epicatechin (EC), (-)-Epigallocatechingallate (ECGC), (-)-Epigallocatechin (EGC), (-)-Gallocatechin gallate (GCG) and (+)-Gallocatechin (GC) [9-12]. Because of their highly revered bioactivities, (antioxidant, anti-diabetic, anti-cancer, anti-microbial, and nerve-stimulating properties) pharmaceutical companies are already recruiting volunteers for their clinical trials (See PubChem Drug and Medication Information for each compound) [9-12]. However, we show in this report that, despite all these goodies, it is pertinent to know that, immunity-wise, this poly-pharmacological behaviour could be potentially harmful (Figure 2).
In this study, our focus is on the HLA-B*57:01 allelic variant which has been implicated in several ADRs and 8 of the polyphenols found in green tea. Our choice of these 8 polyphenols is as a result of their drug-likeness and their promiscuous interactions with numerous but ontologically discrete human and murine proteins [13-15]. And as it has always been, an ugly side of poly-pharmacology is the likelihood to unfavourably interact with unwanted targets [16]. It is therefore highly suggestive, that GTPs may also elicit unwanted side effects. One of such probable unwanted off-targets is HLA-B*57:01.
Therefore, in the current study, we conducted a low throughput but explicit docking study of the pre-and peptide presentation scenarios to adjudge the promiscuous potencies of GTPs. As control datasets, we docked 7 confirmed ADR liable drugs (positive control) and 5 non-ADR liable drugs to demonstrate the validity of our methods and observations. Secondly, 3-D geometric and electrostatic behaviours of these polyphenols were obtained with respect to the receptor (HLA-B*57:01) and compared with the validation set. In summary, we document potential HLA binding promiscuity of tea polyphenols which is clearly suggestive of their idiosyncratic immune-toxicity (Table 1a).
PDB coordinate file (PDB ID: 3UPR) containing crystallographic data for HLA-B*57:01 (co-crystallized with abacavir) was retrieved from the protein data bank (https://www.rcsb.org/structure/3UPR) [17]. The compounds from validation set were retrieved from the Allele Frequency database and there 2D structures were retrieved from NCBI PubChem (http://pubchem.ncbi.nlm.nih.gov/) [18,19]. 2D structure of the eight green tea polyphenols was also obtained from the NCBI PubChem database. 2D to 3D structure generation was performed using OpenBabel [20]. Protein and ligands were prepared to fully minimize outrageous energy constraints. A receptor grid box, which defines, under physiological condition, the most probable site for orthosteric ligand interaction was generated within 22.5Å of the ligand centre (x=50, y=5.13, z=-14.43) using the Pymol Molecular Graphics System [21]. Cognate ligand docking into active site was performed using Autodock Vina [22]. 3D-optimized Ligands were docked using Autodock Vina following the same active site parameter.
The order, nature and scope of non-covalent bond types (Hydrogen bond, π-π stacking, hydrophobic bonds and salt-bridges) that existed between ligand and receptor was profiled for using Protein Ligand Interaction Profiler (PLIP) [23]. Step-wise snapshots of the distinct ligand interactions during the pre-peptide and peptide presentation steps were taken in 3D with the Pymol Molecular Graphic System [21].
The Open Babel module for computing the MACCS key for structure fingerprint was used. In brief, 2D conformers of all 15 compounds (8 study set and 7 validation set) were submitted for MACCS fingerprinting and pairwise MACCS similarity was calculated based on the Tanimoto distancing [20-25]. As previously described, the Tanimoto coefficient (Tc) is:
Tc = NA&B / NA + NB – NA&B [25].
WhereNA/NB is the number of bits on structures A and B respectively, and NA&B is the number of bits common to both.
Also, Maximum Common Substructure (MCS) and pairwise Tanimoto distancing was calculated using the Chemmine similarity workbench to determine discrete electronic identities across board [26,27].
Our validation set which contains compounds with reported HLA-B*57:01 liability were used to generate 3D-ligand based pharmacophore models using PharmaGist [28-30]. Post-docking optimized 3D-conformers of the validation set were submitted to reveal insights into valid geometric and electrostatic criteria required for ligand activity. The scoring method here is based on the multiple alignment module of PharmaGist which superimposes flexible target molecules around a rigid pivot molecule. In this case Scoring/ranking in this case, is a function the best multiple alignment of K number of flexible target (validation set) molecules, say K1….Kn, around a rigid pivot ligand.
In a recent proof of concept study, molecular docking was justified as a valid stand-alone tool in predicting HLA-drug interactions. However, we include more supporting information to authenticate this claim [8].
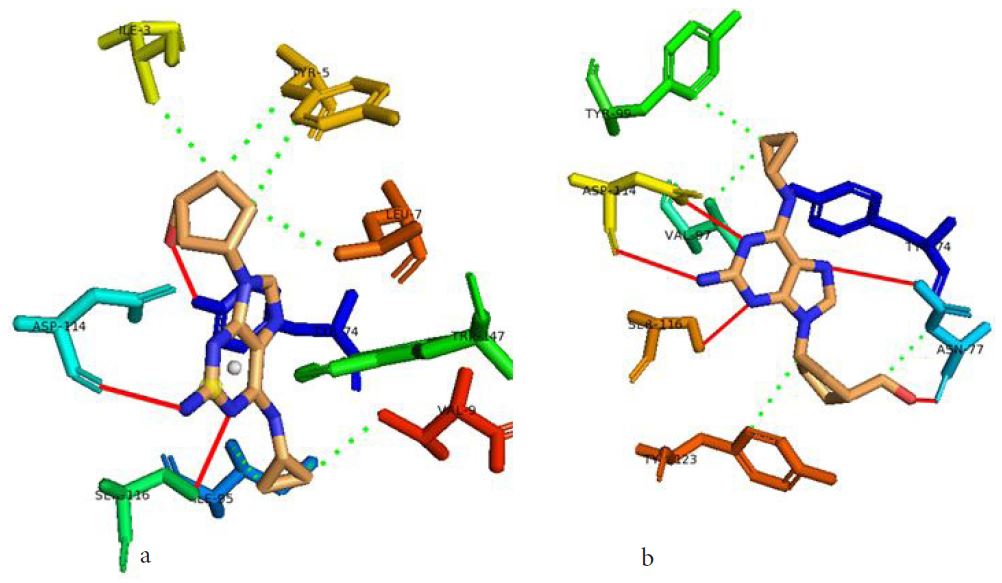
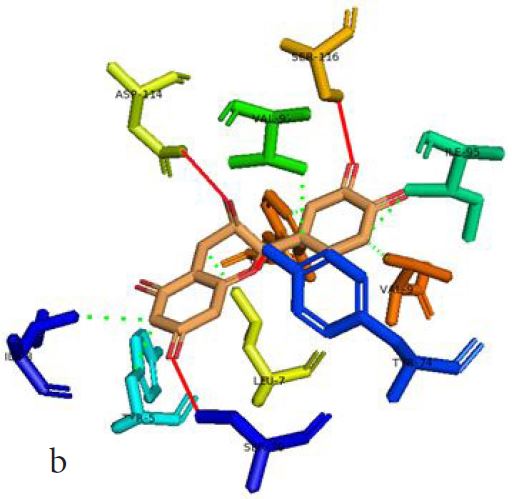
In our case, we first docked abacavir, a widely reported HLA-B*57:01 liable drug and observed the chemical dialogue in the pre-peptide presentation scenario. Indeed, the docking of abacavir (ΔG = -8.8 Kcal/mol) returned a physiologically relevant docking score but this is not enough. Therefore, we further studied the order of interacting atom/residue pair using PLIP in light of their biological significances (Figure 3a) [23]. Of specific interest was a noticeable adjacent hydrogen pair exchange between proteins derived Ser116/Asp114 and abacavir. Congruently, this has been previously reported that signal transduction leading to HLA-B*57:01-mediated ADRs is largely determined by a hydrogen trade-off from these two adjacent residues (Ser116 and Asp114) with the interacting residue [17]. Putatively, we guess that the ability of A2, A4, A6 and A8 to rotate along C3, makes their –OH groups available within an optimal hydrogen bonding distance. Furthermore, a combo of five other (3 hydrophobic and 2 hydrogen) respective contacts between abacavir and protein derived Tyr74, Asn77, Val97, Tyr99 and Tyr123 (found in many other HLA variants) were observed in accordance with previous studies (Figure 3b) [17,28]. The hydrophobic patches generated by Tyr74, Asn77 and Val97 are allele-independent and a similar trend in the chemistry of HLA-signal transduction. Thus, we set abacavir’s docking score and the protein-drug interactome as a benchmark for predicting ADR liable polyphenols from our study set. Additionally, the validation set which comprised of seven known HLA liable drugs (including abacavir) were screened and they equally showed toxicity-implying binding affinities (Table 1b).
Up next, all eight polyphenols were docked into the HLA-B*57:01 active site to screen for their binding affinities in a pre-peptide binding scenario. Although sadly interesting, all eight polyphenols docked even better into the open binding pocket (Table 1c).
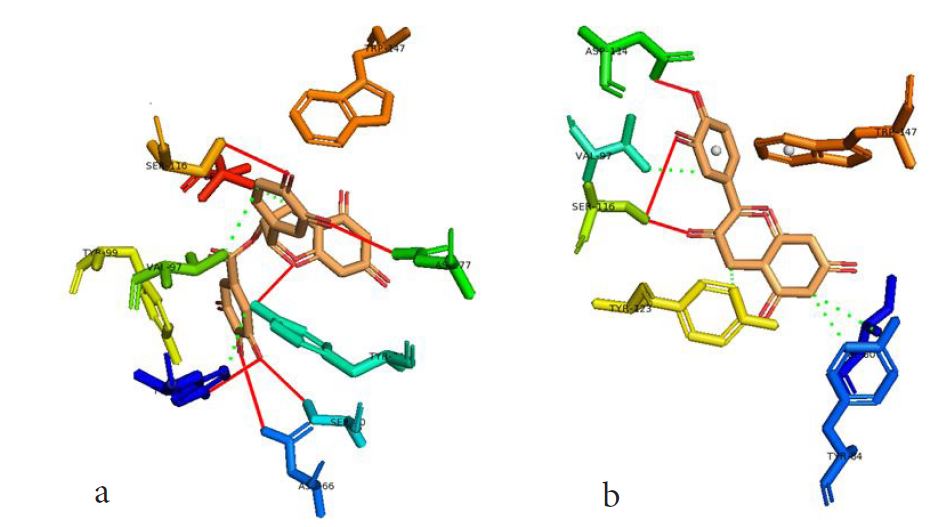
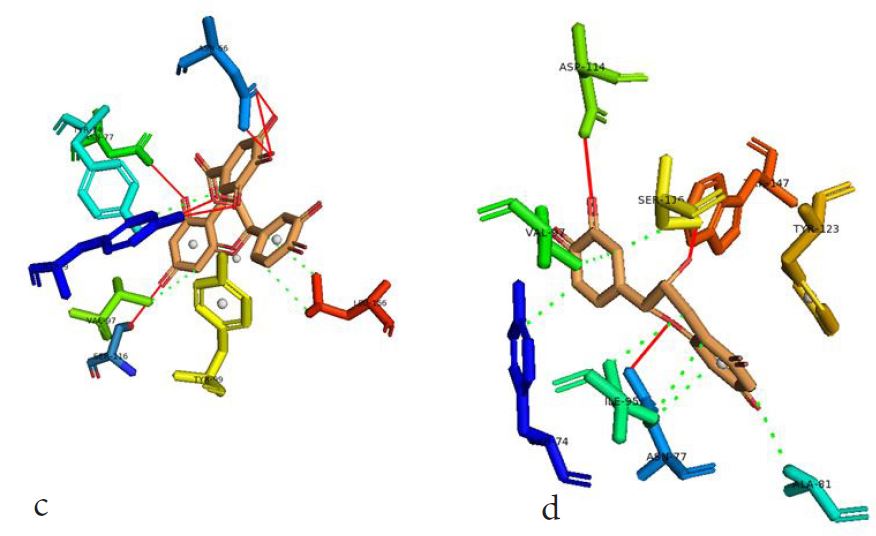
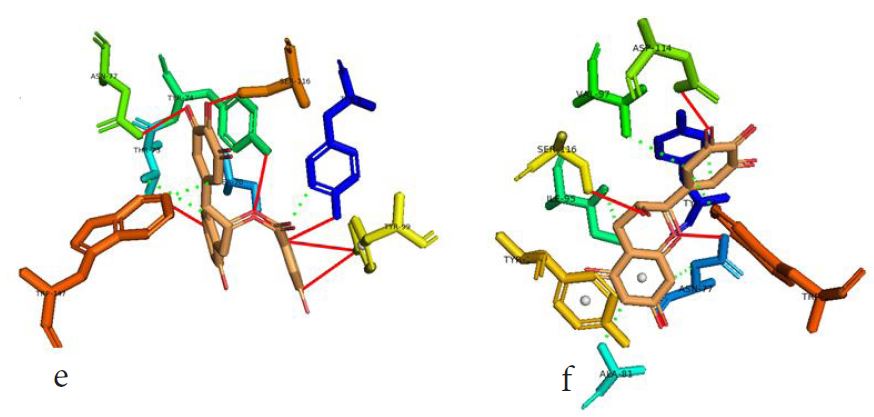
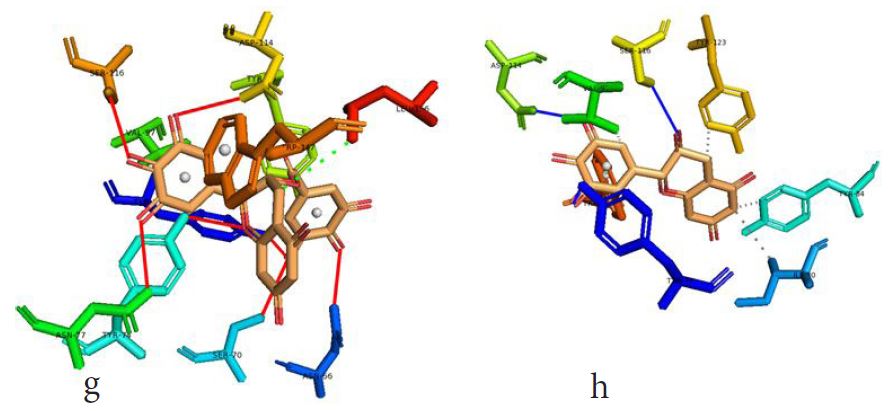
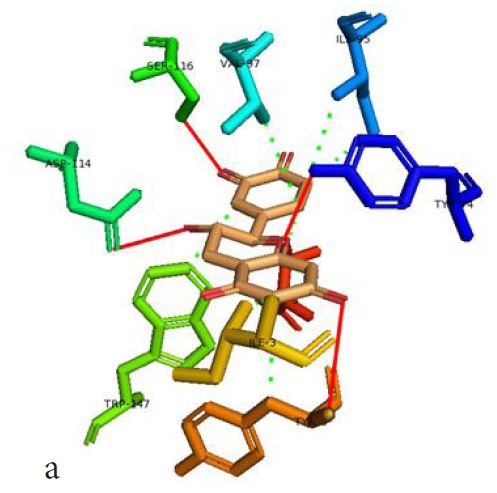
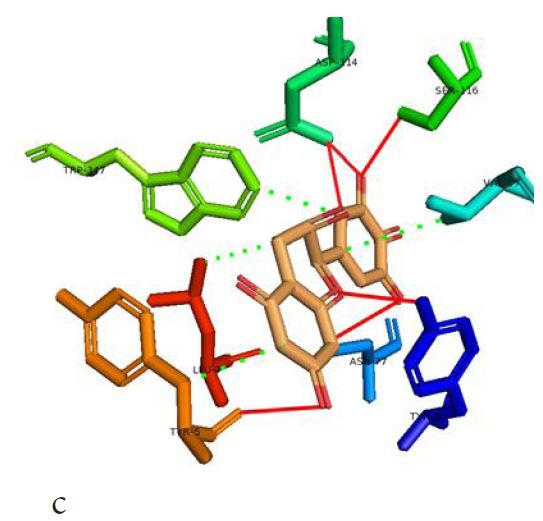
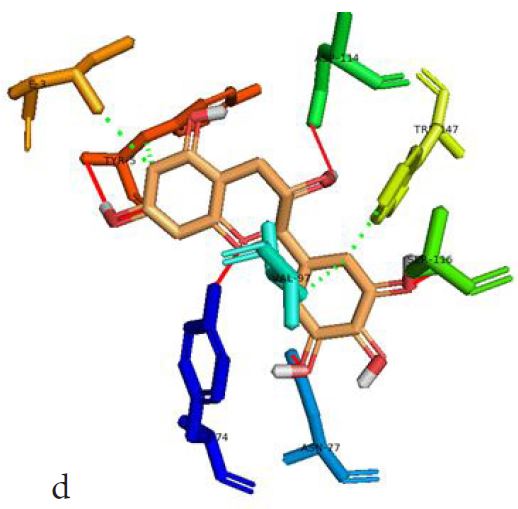
However, not all the submitted compounds (ECG, EGCG, GCG and CG) interacted well with the ADR-sensitive residues; Ser116 and Asp 114 (Figure a-h). Thus, our filtering scheme was defined by the inability to interact with Ser116 and Asp114. The poorly interacting compounds were pruned and the residual compounds (C, EC, EGC and GC) were docked inside the peptide presentation sandwich. Nevertheless, we docked the pruned subset were later docked as a proof of concept. As theory dictates, the compounds should not interact with HLA alone but also with the self-peptide if stability were to be maintained. Indeed, we observed these in all the four residual compounds in addition to their biologically implicating docking score. Remarkably, the earlier pruned subset did not dock well in the epitope sandwich. Rotation, which is well accounted for by the Autodock scoring function was observed in the –OH group attached to C3 which rotates well about its axis in search of an hydrogen exchange pair. The binding interactions of abacavir inside with HLA’s orthosteric residues after sealing with an epitope have already been reported [17,28]. PLIP analysis of bound abacavir was also used to authenticate our result and also to explore the bond orders of the bond (Figures 5a-d). Of course, the adjacent Ser116 and Asp114 hydrogen bonding pair were maintained in abacavir [16, 26] and filtered study subset. Additionally, hydrogen bonding between protein derived Ile124 were consistent with previous reports [17,28]. Hydrophobic pockets were maintained with Tyr74, Val97. Much more surprising PLIP correctly guessed the alienation of water molecules from the Ile3 and Val9 residues [17,28]. An explicit study of catechin (C) is shown in Figure 6.
Based on the docking scores and the binding interactions, it is evident that these four compounds could well raise significant HLA toxicity concerns. Another probable insight is that an open rotatable -OH on C-3 of the catechin substructure may be sufficient for favourable non-covalent binding. Howbeit, It is also noteworthy that the selection of better and longer epitopes (k-mers where k>= 11) from a large repertoire of epitopes may still not completely acquit the earlier pruned compounds [17,28,29].
We conducted a pairwise Tanimoto similarity search between the study polyphenol compounds and our study set in search of compound similarity based on the MACCS keys for chemical fingerprinting. Also, it is known that substructure similarity greatly effects similar biological behaviour [24,26]. However, this may not be the case for HLA-B*57:01 as we did not retrieve any significant similarity coefficient or similar substructure in all between the two study sets. All compounds in the validation set were sufficiently different chemical scaffolds/substructure, yet they evoked HLA-liability in nature (Table 2). More surprisingly, pairwise comparison of the most widely reported HLA-liable drugs abacavir (Aba), ciprofloxacin (Cip), carbamazepine (Car), Flucoxacillin (Flu) and Pazopanib (Paz) yielded a maximum score of 0.479 (Cip and Aba). Moreover, our search for maximum chemical substructures (MCS) produced disparate C-3 and C-4-chemical scaffolds (data not shown).
This is clearly indicative of the manifold binding potency of HLAs in general. From this, we guess that structure similarity may not be a single significant criterion for evoking bioactivity, HLA-B*57:01-wise. In fact, an initial similarity filter of the ZINC database for abacavir-like drugs yielded 153 drugs of which only one (acyclovir) could induce a poorly significant (statistically) HLA-B*57:01 hypersensitivity in-vivo [30]. Nevertheless, we propose that the ability of drugs to spatially organize its atoms in a way that facilitates non-covalent interactions with selected orthosteric residues in HLA-B*57:01 sounds logical.
Next, we sought to model the minimum ligand pharmacophore requirement in 3D space. Based on the 3-D structures of docked molecules in the validation set, we report pharmacophore parameters which can offer valuable insights into a combo of steric and electrostatic features required for optimal ligand interaction between the HLA-B*57:01 trap and subsequent epitope sandwich which is required for T-cell activation [31]. Here, we used the 7 compounds of the validation set. Of the 7 compounds, the seven compounds with 4 pharmacophore parameters (1 aromatic ring, 2 hydrogen bond acceptor (HBA), and 1 hydrophobe) aligned well and were rankedF highest. Obviously, this model maximises steric consensus in 3D and it agrees with the earlier discussed bond interactions of the pruned study set. EC, C, GC and EGC had the same geometric (aromatic ring) and electrostatic (HBA and hydrophobe) within the HLA-B*57:01-epitope sandwich. In all the four pruned subset, there was at least, a hydrogen bond acceptance from either Ser116 or Asn114 (the crucial residues), coupled with the presence of a hydrophobically interacting pocket along the Tyr74 and Val97 epicentres [32].
By and large, we have scientifically documented the potential immune-promiscuity of tea polyphenols using molecular docking, pharmacophore modelling and the Tanimoto pairwise based similarity search. In a way, we were initially sceptical with the authenticity of our claim. This made us query the Vigibase, with which we retrieved 181 reports on adverse drug events. This we believe is high enough to raise public health concern regarding the safety of catechins. As earlier stated, our aim is not to decry previous works on GTPs but to help ensure drug safety immunity-wise during drug development. However, some questions pertaining to the flexibility and choice of epitopes still remain unanswered. In light of this study an urgent need for in-vivo validation of this claim. Also, future research should to be directed toward investigating the molecular drama that influences epitope selection using Molecular Dynamics Simulation and Quantum Mechanics.