Evolution and Controlling of the Plykin - Newhouse Attractor by the Pyragas Method
In the present contribution consideration is being given to an autonomous physical system which is characterized by the presence of the attractor of a hyperbolic type. We study the possibility of controlling and stabilizing the Plykin - Newhouse attractor of this type by the Pyragas method. The choice of the method of control. As such it is possible to use an external signal or the introduction of additional delayed feedback. (Both methods can be realized primarily during the schematic simulation, then in a real experiment). It might also be interesting to think about the realization of a more complicated scheme of control of the type suggested in the work for the stabilization of unstable periodic orbits belonging to the attractor.
Keywords: Nanophysics; Chaotic Systems
Hyperbolicity is a fundamental feature of chaotic systems. It is as follows: a tangent space Σ of such systems is a combination of three subspaces; stable Es, unstable Eu and neutral E0. Close trajectories which correspond to Es converge exponentially to each other when t→+∞, and those which correspond to Eu - when t→−∞. In the subspace E0 the vectors contract and expand more slowly than the exponential velocity. When the degree of contraction and expansion in the subspaces Es and Eu changes from point to point along the trajectory, such systems are called non- uniformly hyperbolic. Dynamic systems with uniform hyperbolicity of all the trajectories are called Anosov systems.
The set Λ is called a hyperbolic attractor of a dynamic system if Λ- is a closed topologic transitive hyperbolic set and there exists such a vicinity  that
that  . Smale - Williams' solenoid and Plykin's attractor are well- known hyperbolic attractors [1]. Plykin's sphere is obtained by the transformation of the disc domain T = S2 into itself where S2 - a unitary disc in R2; then
  ,
,  where k>2 determines the compression "by thickness", sets the disc as a subset
  .
.
Let there be a smooth family of non - linear controlled systems of ordinary differential equations 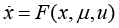 ,
, depending on the vector of controlling parameters u. Suppose that it is necessary to stabilize unstable limiting cycle
  of the period T , which is the solution of the family when u=0 and
  . Let the system have a regular attractor when the parameters are of the same value u=0 and . Then the stabilization of the cycle is carried out by means of the feedback with the delay being in the form of
 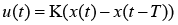 , where K - is the matrix of coefficients. Therewith the initial conditional x(0) is chosen in a sufficiently small vicinity of the cycle. Then the solution x(t) of the system
 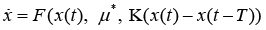 with the feedback with can converge to the sought - for unstable cycle
  [2].
[2].
To construct a system with the Plykin - Newhouse attractor let us start with a map of a unit sphere defined as a sequence of four periodically repeating stages of continuous transformations. Duration of each stage is taken to be equal to a unit time interval. The holes will correspond to neighborhoods of four points A, B, C, and D on the spere. Thepicture illustrates the transformations geometrically, and differential equations for all the stages are written down.
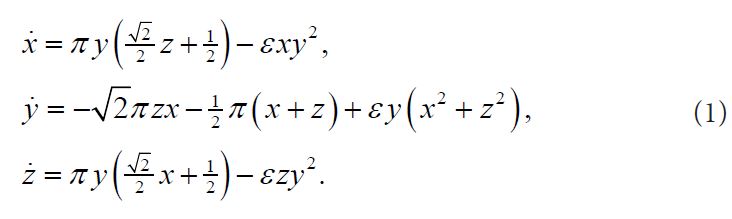
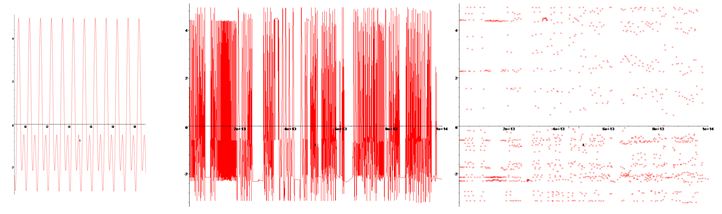
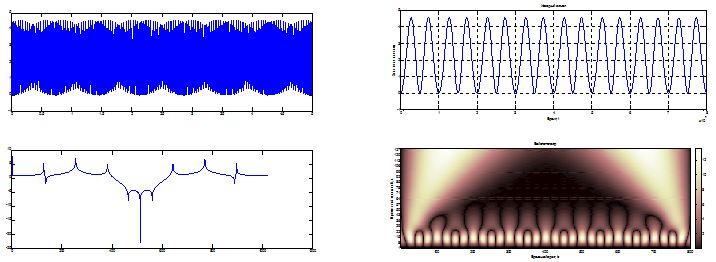
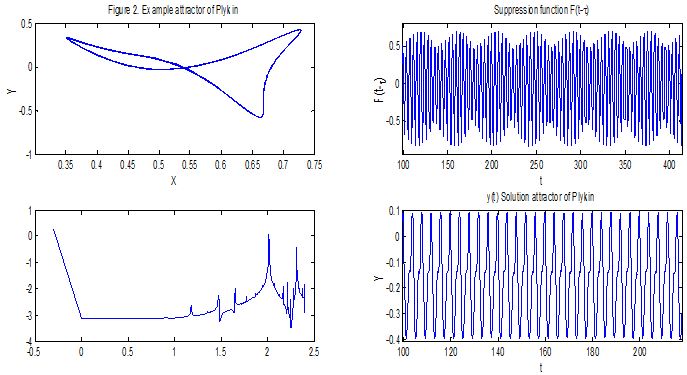
Figure 1 shows the temporal dynamics of y(t) of hyperbolic Plykin - Newhouse attractor on a spherical surface if ε = 0.72.Figure 2 left shows temporal dynamics of y(t) and the Fourier spectrum on the right presents the temporal dynamics of y(t) and wavelet transform hyperbolic Plykin - Newhouse attractor on a spherical surface if ε = 0.72. Hyperbolic Plykin - Newhouse attractor on a spherical surface in Figure1 and Figure 2 show the bifurcation and chaotic.
For control and synchronization of hyperbolic Plykin - Newhouse attractor on a spherical surface we apply the method of Pyragas.
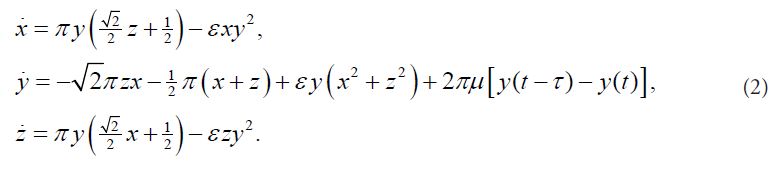
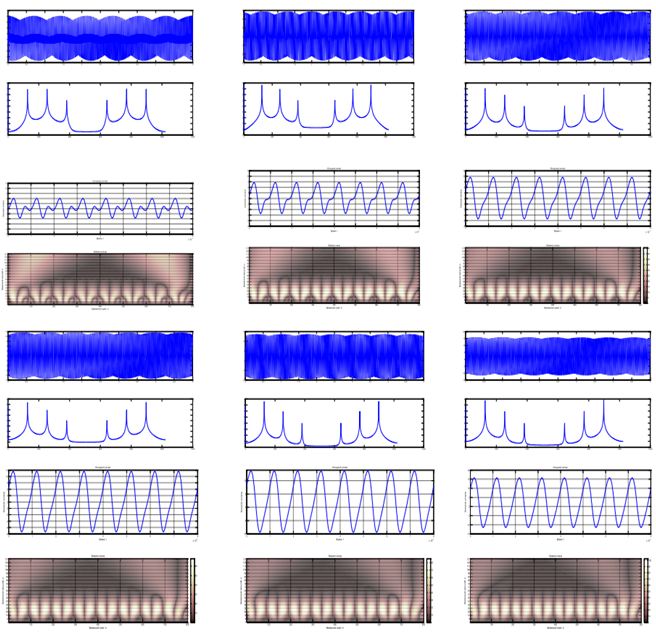
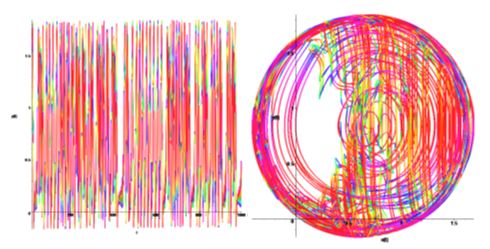
Figure 3 shows the dynamics and evolution of the attractor Plykin - Newhouse method of Pyragas. In the range μ=1, τ = 0.000025 there is a regular dynamic mode that is observed in the timeline y(t), the Fourier spectrum and wavelet transform.
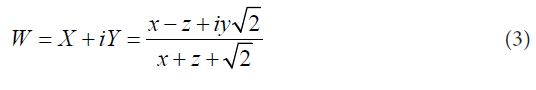
From representation on the sphere one can pass to the plane by means of the stereographic projection, with the variable change.
As to the attractor of the flow system, it is disposed in the extended phase space (X, Y, and t).
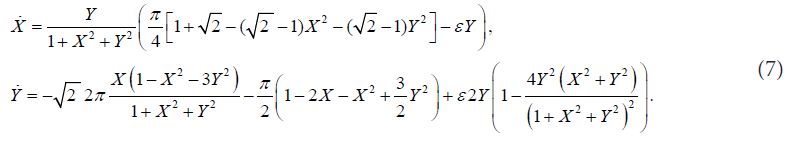
Let us take into consideration the system of the type [3].
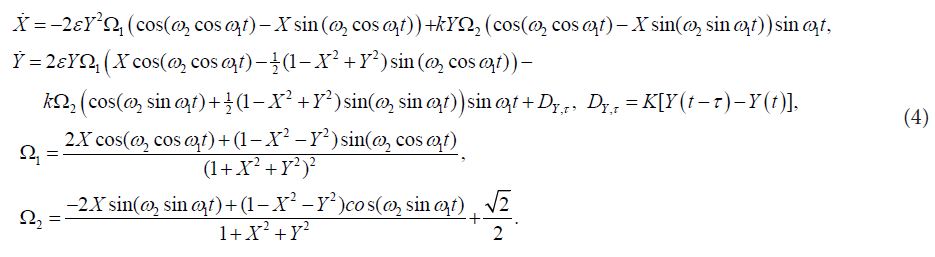
Here X, Y - dynamic variables, ε & k - coefficient of connection, - 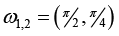 inherent frequency oscillations. The phase portraits and Fourier spectrums presented demonstrate the behavior of the Plykin - Newhouse system. K=0 corresponds to the chaos Figure 4; Figure 5 corresponds to the stable state when K=1.8 and τ=1.8.
For transformation of flat system back to the spherical model we use the system of equations (5).
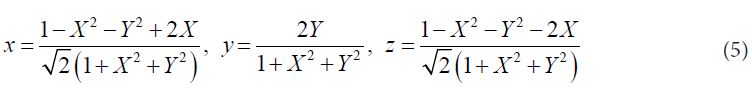
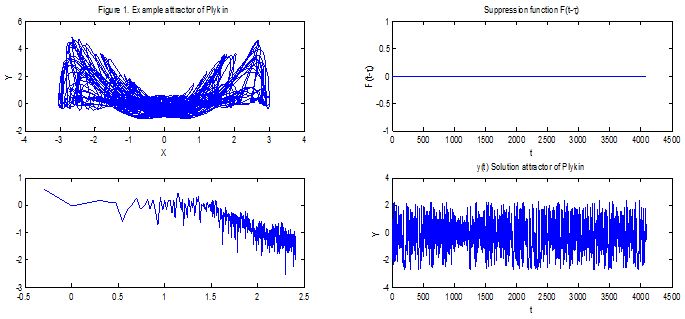
Figure 6 shows on the left the temporal scale amplitude y(t), to the right of the phase portrait of y(x), in the absence of external influence on the attractor. It is easy to see that, at these parameter values the attractor has strong chaotic properties.
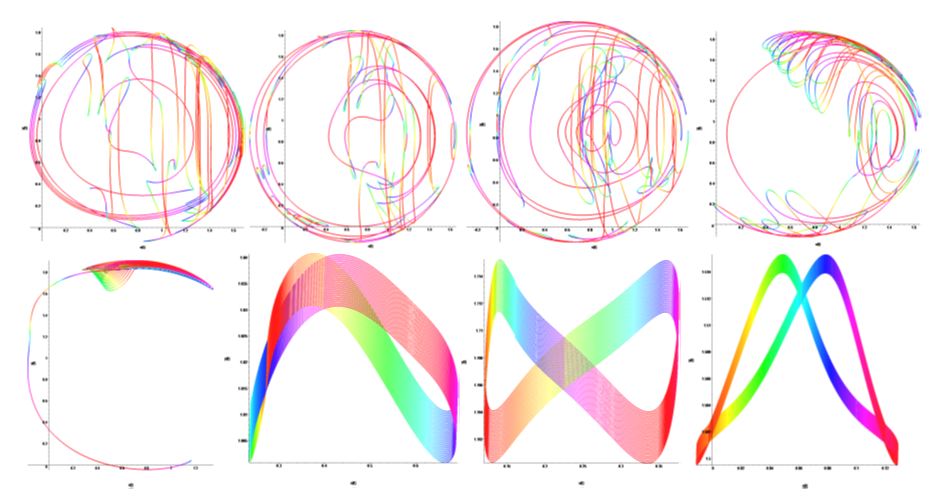
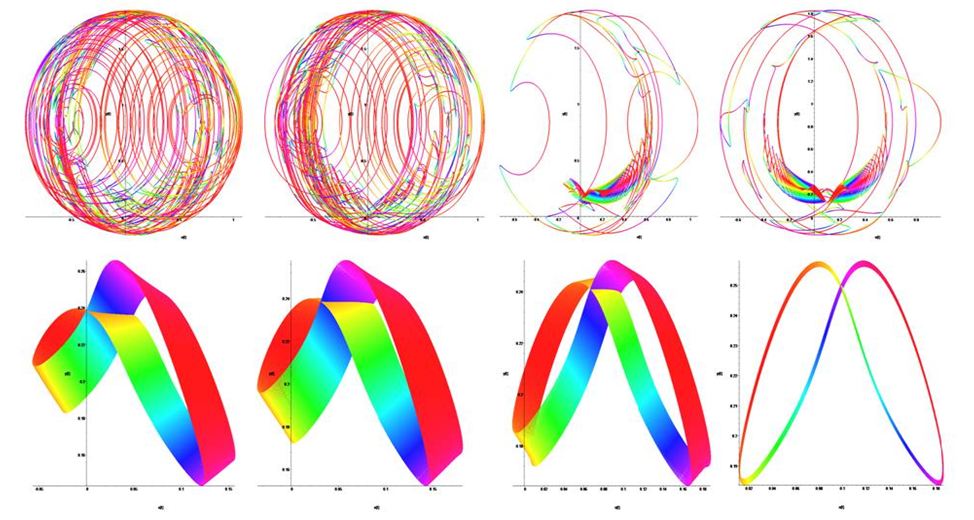
When using the method of Pyragas  is observed evolutionary dynamics of phase portraits of the system shown in Figure 7.
A positive impact on the attractor the attractor translates the pole on the positive sector of the equator. Attractor points A, B, C and D closer together forming a stable periodic attractor.
The stereographic projection is a particular mapping that allows us to project a sphere onto a plane. The original projection is defined on the entire sphere, but we use in this study a version restricted to the hemisphere. This mapping is bijective and preserves the angles: a Cartesian grid on the plane corresponds to a Cartesian grid on the surface of the sphere. However, this particular mapping is neither isometric nor area-preserving: the distances and the areas are not preserved. In Cartesian coordinates, if one denotes the coordinates on the sphere by (x, y, and z) and the coordinates on the plane by (X, Y), the projection and its inverse are given by the formula (6) [4]:
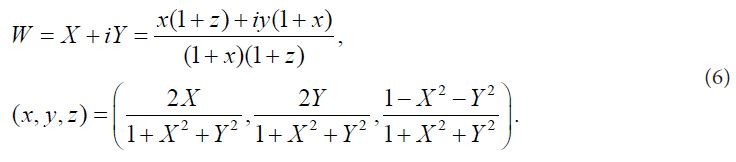
The radius of the sphere is equal to one in these formulas and in the sequel. Stereographic projection: N and S denote respectively the north and south poles, the points (A, B, D) on the sphere is projected on C on the plane.
As to the attractor of the flow system, it is disposed in the extended phase space (X, Y, and t) (Figure 8).
For transformation of flat system back to the spherical model we use the system of equations (6).
Figure 9 shows on the left the temporal scale amplitude y(t), to the right of the phase portrait of y(x), in the absence of external influence on the attractor. It is easy to see that, at these parameter values the attractor has strong chaotic properties.
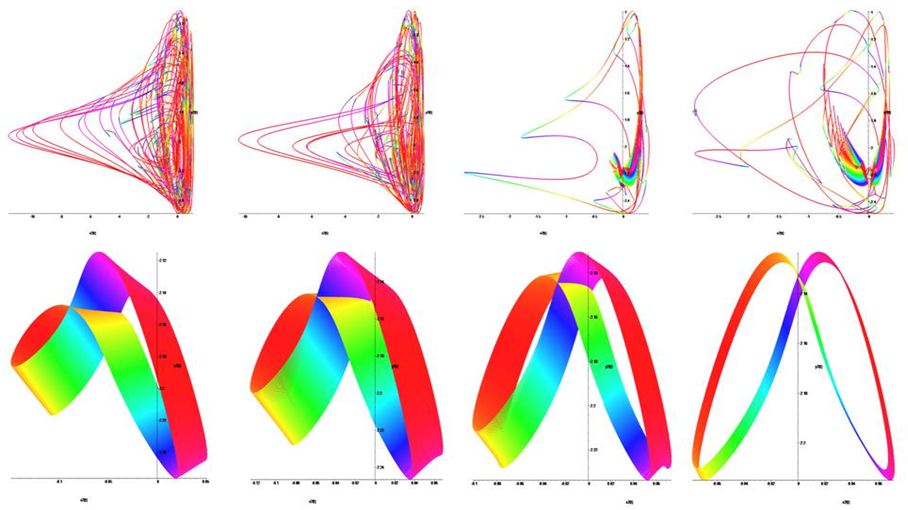
When using the method of Pyragas  is observed evolutionary dynamics of phase portraits of the system shown in Figure 9.
And the hyperbolic attractor degenerates into the limiting cycle, and the continuous spectrum corresponding to chaotic oscillations changes into an equidistant one with the frequencies corresponding to the basic frequency and its harmonics. Thus, the application of the method of Pyragas at a constant time delay, gives the opportunity to observe the evolutionary dynamics of systems of hyperbolic Plykin - Newhouse attractor.