Excitation Temperature Measurements on a New Atmospheric Microwave Plasma Torch
In this work, we present the results of a new approach of atmospheric microwave plasma torch (MPT), measuring the excitation temperature of the plasma. The new system consists of a cylindrical resonant cavity and a microwave source, a magnetron operating at a frequency of 2.45 GHz and power of 880 W, which is used to generate plasma inside a quartz tube, mounted coaxially along the cavity, with a diameter of 7 mm. The cylindrical cavity excites a dominant electric transverse mode TE111, in which surface waves transporting energy reach up to levels of 100 W/m3sr. The magnetron generator converts the input energy into plasma, in which the absorbed power is the result of the balance between the incident power and reflected power, but it depends on source losses in the cavity, the connection of the cavity, and the existence of other microwave harmonics. We use the optical emission spectroscopy to measure the excitation temperature, determined by Boltzmann plot method, based on the detection of several plasma emission lines, resulting in an excitation temperature of (3400 ±500)K.
Keywords: Atomic Emission Spectroscopy; Atmospheric- Pressure Plasma; Electron Excitation Temperature; Microwave Plasma
The development of the microwave plasma torch-MPT plasma technique has been allowed the built of devices for application to industrial, medical, and scientific fields [1,2].
At atmospheric pressure, the plasma is very near of the partial pLTE justifying the use of equilibrium equations of the Boltzmann equation for the those populations of excited states for ionization [3,4]. The justification consists of the fact that they have a high degree of ionization and the processes are dominated by electrons-ions collisions. Plasmas produced by microwaves are generally obtained from magnetron valves and have higher energies than those obtained in DC or RF plasmas, so the process is intensified [5,6].
The design of the resonant cavity determines standing microwaves resonating generated by the magnetron following a dispersion relation [7]:
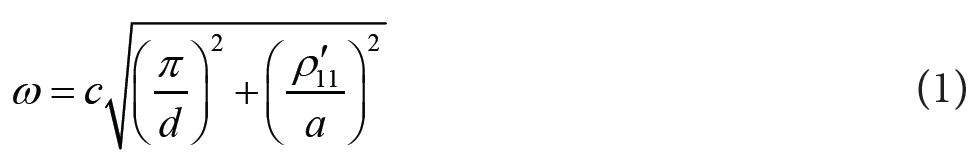
where a and d are the radius and the length of the cavity respectively, c is the speed of light, and ρ'11 is the zero of the first derivative of the Bessel function.
The power of MPT can be driven by absorption of the order of the tube radius described by the collision skin depth δ[8],
where c is the speed of light, ωpe is the electron frequency radians per seconds, v is the momentum collision frequency in Hertz and ω is microwave frequency in radians per seconds [8].
The Boltzmann distribution is an efficient technique for determination of the excitation temperature Texc in partial pLTE states. The intensity I1 of the emitted radiation yields from integration of the corresponding emission coefficient εc over the spectral profile of line,
where h is the Planck constant; A21 is the Einstein transition probability of spontaneous emission between levels 2 and 1; g2 is the Degeneracy of level 2; na is the Atom density; Ua is a Partition function of atom; E2 Energy of atom level 2; kB is the Boltzmann constant. This intensity has units of energy per unit volume per unit time.
In this technique, one quartz tube is mounted coaxially along the cavity, with a low flow of argon gas at atmospheric pressure. The cylindrical cavity excites a dominant electric transverse mode TE111, in which surface waves can transport energy reaching up level of 100 W/cm3 in partial -local thermodynamic equilibrium-pLTE states [9]. The excitation temperature is determined by the line-to-continuum intensity ratio method according to the Boltzmann distribution equation. The resonance point of the cavity was adjusted through distance between two covers.
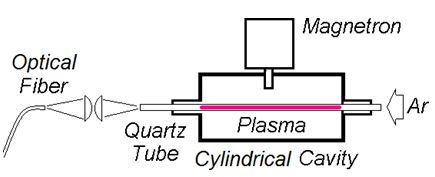
A simplified design of a resonant cavity is illustrated in Figure 1. The system consists of a cylindrical stainless-steel tube with an internal diameter of 100 mm and length of 210 mm. The cavity is set to house a magnetron, the same used in conventional microwave ovens, in the center of the cylinder. Discharge forms in a quartz tube with an internal diameter of 7 mm and length of 250 mm. The quartz tube is aligned with the magnetron to allow plasma formation throughout its length. The experiment was carried out to study the emission spectrum of argon in a resonant cavity, and plasma was generated inside a quartz tube by microwaves (Figure 1). For the formation of the plasma at the exit of the quartz tube, an argon flow of 1 L/min is required.
The formation of plasma starts with a small Hertz spark on the tip of a rod, which is put in front of the exit quartz tube. One optical fiber conducts radiation from the microwave plasma at the top end in front of the quartz tube and is viewed along the parallel direction of the tube. The optical fiber with a core diameter of 0.8 mm is connected to an optical spectrometer, which has an adjustable slit and is mounted with a CCD detector array, intensified by 3648 elements, to obtain a spectral resolution of 0.1–10 nm, an integration time between 3.8 ms and 10 s, and focus distance of 42 mm at the entrance. This spectrometer was calibrated by radiation emission from a Mercury Emission - DK-U spectrophotometer lamp.
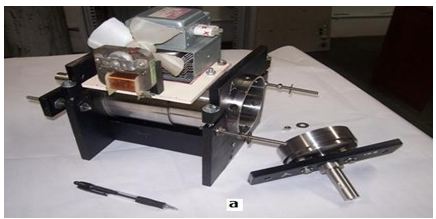
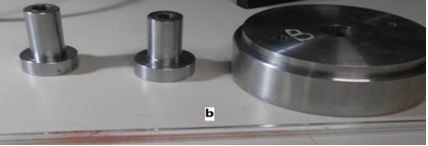
Figure 2a shows the finished cavity, made of stainless steel. Figure 2b shows the detail of the side covers together with appropriate support for the quartz tube, with an internal diameter of 7 mm, used in the experiment. The equipment allows other combinations of quartz tubes with different diameters.
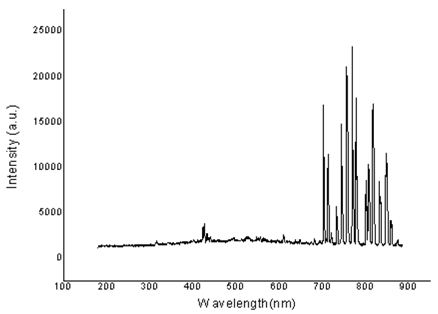
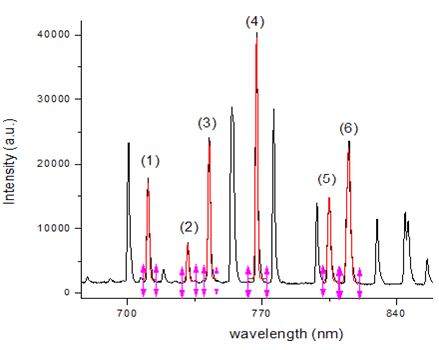
The spectrum of Figure 3 refers to measurements performed axially by the optical fiber of the spectrometer near the quartz tube, as previously described. To ensure that the emission lines refer exclusively to Ar I, an exhaustive analysis was performed to ensure the values sought
With the spectrum of Figure 3, it is possible to determine the wavelength accurately in addition to the other parameters [10,12], where it is necessary to use the equations presented in the theory in addition to the data according to Ref. [11]. For this analysis, the software Origin 8 was used, as shown in Figure 4.
Through this software, the spectrum was enlarged from a Gaussian distribution to accurately calculate the wavelengths of each peak. Table 1 presents some peaks that were used for the Boltzmann plot. The data of columns 2 and 3 of Table 1, A21-g2 and E2, respectively, were obtained by reference NIST [11].
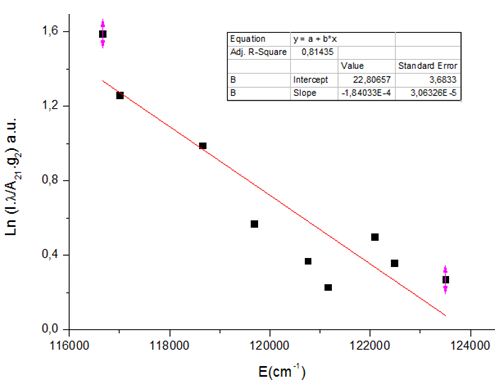
With the data in Table 1, it was possible to construct a Boltzmann plot to obtain the excitation temperature. In order to obtain the values related to the y-axis of the graph, the relation Ln [(Iλ/(g2. A21)] versus energy in cm–1 was used from expression (3) [12]. The slope for a straight line fitted to these points can be obtained,
where m = -(2,07 ± 0,72) x 10-4 is the slope of the line allows to get the excitation temperature Texc in Kelvin, as Figure 5.
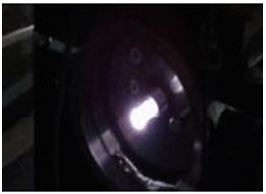
Substituting the values in the above relation gives the following values for the excitation temperature: Texc = (3400±500)K or 0.29 eV. Figure 6 shows the generation of plasma inside the quartz tube, leading to the full functioning of the resonant cavity, where the side covers are perfectly adjusted, in order to achieve the maximum resonance.
The result obtained in this study, an excitation temperature of about 3400 K, is similar to those of plasmas generated in the same conditions, i.e., atmospheric pressure, and same source of energy, (microwaves); in this case, it was not necessary to use a waveguide for its formation. The critical point in the construction of the resonant cavity is the distance between the side covers, which, being movable, allows its precise adjustment in the determination of the exact length in order to activate the plasma, as a variation of tenths of millimeters enables the adjustment of resonance. Another relevant point is the simplicity of the construction of the chamber, which consists of a metal cylinder with movable covers. Another important point in the formation of the plasma torch is the argon flux, at about 1 L/min. The quartz tube, responsible for conducting the gas, can also be combined in different diameters because, in the side cover, there is a pre-support responsible for fixing the tube and is adjustable for different diameters, allowing for other applications and studies. Again, with respect to the excitation temperature, the experiment proves effective in the yield of energy, as the magnetron of 800 W allows high temperatures.
The production of plasma at atmospheric pressure usually requires significant energy. Through the results presented, where the excitation temperature of the plasma of (3400±500) K was possible with the resonant cavity without any other coupled energy sources or vacuum system. In addition, this experiment can allow others researches to do the production of new materials using new simple and attractive design mounted inside the cavity increasing the potential applications where electrodeless are important.
The research has received funding from the CNPq, Fapesp and Capes. We are thankful to the University of São Paulo and Fatec/SP for the infrastructure provided to the project.