Exclusive Radiotherapy for Pineal Parenchymal Tumor of Intermediate Differentiation: Case Report
Background and objectives: Pineal parenchymal tumor of intermediate differentiation (PPTID) are rare. treatment is mainly surgery but the real place of radiotherapy has not been established yet. The goal of this observation is to highlight the role of exclusive radiotherapy in management of these tumors.
The case: We report a case of a young woman diagnosed with PPTID after a biopsy following magnetic resonance imaging (MRI) showing the tumor after consultation for bilateral drop in visual acuity.
Results: An exclusive three dimensionnel conformal radiotherapy (3DCRT) was indicated because the tumor was unresectable. The follow up showed a clinical and radiological remission.
Conclusion: Although surgery is the main treatment for PPTID, radiotherapy could be a good alternative in the case of unresectable tumor or inoperable patient.
Keywords: Pineal Parenchymal Tumor; Intermediate Differentiation; Radiotherapy
Pineal parenchymal tumor (PPT) is a rare tumor of the central nervous system accounting for less than 1% of all primitive CNS tumors [1]. Pineal parenchymal tumor of intermediate differentiation (PPTID) is a tumor with limited aggressive potential standing between the pineocytoma and pineoblastoma. PPTID was introduced into the world health organization (WHO) classification in 2007 as an intermediate-grade malignancy (Grade II or III) and constitutes approximately 10% of all pineal parenchymal tumors (PPT) [1]. Survival rates are better for PPTIDs than for pineoblastomas and also grade III had a much more aggressive biologic behavior compared with grade II [2,3,4]. Currently there is no a randomized controlled trial or systematic reviews assessing the effectiveness of surgical and non-surgical treatment. The treatment of choice is complete surgical resection. Adjuvant radiotherapy is indicated in partial resection or grade III tumors. Prophylactic cranio-spinal irradiation is controversial; the role of chemotherapy is uncertain. We describe a case of an unresectable PPTID that presented a good response to three-dimensional conformal radiation therapy (3DCRT), without recurrence or any adverse effects after 24-months follow-up.
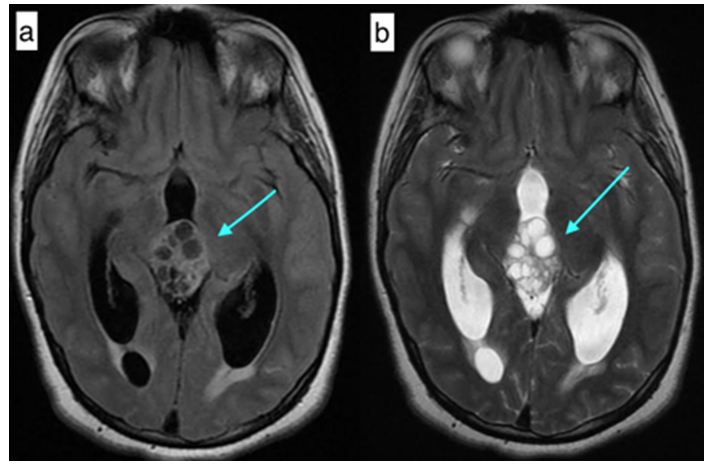
This is a 21 years old female patient, single, with no particular medical history. The symptoms started 6 months earlier with headaches and vomiting. She received symptomatic medication from a general practitioner but with no improvement. She started having a decrease in her visual acuity and an increase in previous symptoms and then was referred to a neurologist. An MRI was indicated which showed the presence at the pineal region of a mixed multicomponent heterogenous mass measuring 36 x23mm, hyposignal on T2 weighted sequence, without translation on the diffusion sequence and without the signs of lesional bleeding. This process is heterogeneously enhanced delimiting multiple cystic chambers and a fleshy part. It compresses the fourth ventricle and leads to a moderate tri-ventricular dilation with sign of trans-ependymary resorption. The medial structures are in place. Arterial and venous MR angiography shows no abnormality. There was normal appearance of basal ganglia (Figure 1). A CT scan showed the same tumor with hydrocephaly.
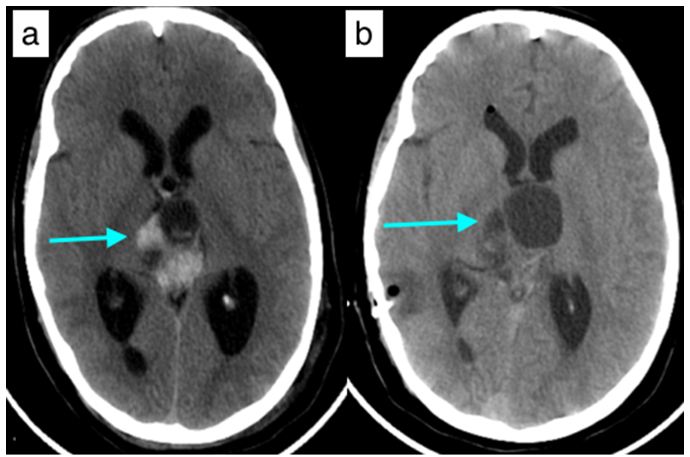
The visual acuity dropped rapidly to a complete blindness. The neurosurgery team proceeded first with a stereotactic biopsy. The pathology report showed a pineal tumor with positive anti-cytokeratin. The Ki67 is at 5 %. The number of mitoses is 5. The grade II or III couldn’t be specified. They concluded to a pineal parenchymal tumor of intermediate differenciation (PPTID) according to WHO classification. The patient had a ventriculocisternostomy to alleviate the hydrocephaly (Figure 2).
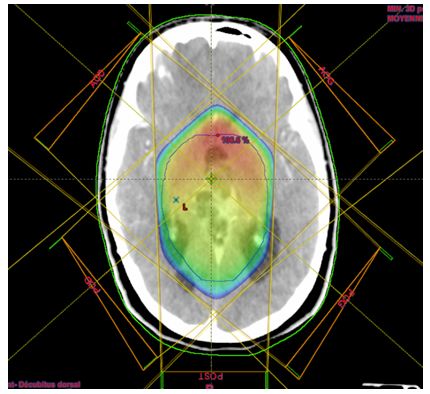
The tumor was not respectable according to the neurosurgery team given the size and localization and the big risk of bleeding. The patient had neither more headaches nor vomiting, but the blindness remained. Ophtalmological evaluation showed complete drop in visual acuity, absence of photomotor reflex with papillary edema (due to tumor compression). A cerebrospinal MRI was made to look for potential nevrax metastasis, and no other lesion was found. After discussion of the case, an exclusive radiotherapy was indicated. She was referred to our department. At that time the tumor increased in size 45x31x47 mm. After CT simulation, countouring was made on CT/MRI fusion and then dosimetry for a 3D conformal radiotherapy. The CTV (clinical target volume) was made by adding 1 cm to the GTV (gross tumor volume). The PTV (planning target volume) was made by adding 0,5 cm to the CTV. The TPS (treatment planning system) used was Eclipse and the machine was LINAC Varian. We used 5 coplanar beams with X18 energy : 4 obliques with wedge on each one and one posterior. Beam angulations were 50, 130, 180, 230 and 310. The patient received a total dose to the tumor of 50 Gy, 2 Gy per fraction, 25 fractions on five weeks. The D90 was 100% of PTV. The maximal doses to the organs at risk were as follow : optic nerves (Right : 48,3 Gy,left : 47,2 Gy), optic chiasm (53 Gy), brainstem (52 Gy) and retinas (Right : 25,5 Gy; Left : 26,8 Gy) (Figure 3).
Radiotherapy was well tolerated.
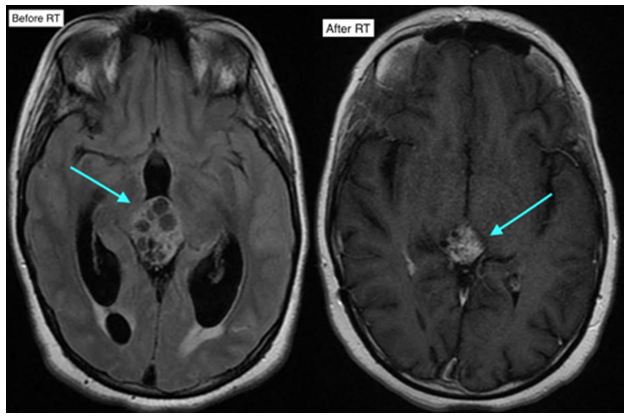
One month after radiation, the patient presented with the same initial symptomatology (headaches and vomiting). An MRI showed a moderate increase in tumor size with tri-ventricular hydrocephaly despite the ventriculocisternostomy. A ventriculo-peritoneal derivation was made and the patient was relieved. An MRI 4 months after radiation showed tumor size decrease by about 30 % (41x29x24 mm vs 47x45x31mm. The most recent MRI (after 20 months) showed a decrease by about 70 % (33x28x23 mm vs 47x45x31 mm (Figure 4).
During follow up, the patient got married and later she gave birth to a healthy baby boy. Despite the blindness, she keeps a good quality of life.
The follow up is 24 months with no signs of progression.
In 2007, WHO classified pineal parenchymal tumors in three types: grade I or pineocytoma, grade II/III or PPTID and grade IV or pineoblastoma [5]. PPTIDs constitute approximately 10% of all PPTs [6]. PPTID occurs at all ages, from childhood to adulthood, with a peak incidence in early adults (mean: 38 years) [7]. There is a sharp female preponderance of these tumors and they are more common in middle aged patients [8].
Symptoms at presentation vary according to the tumor aggressiveness and the most common are headache, vision abnormalities, nausea, vomiting. PPTIDs are usually heterogeneously hypointense on T1 weighted sequence and heterogeneously hyperintense on T2 weighted sequence, and show strong heterogeneous or uniform enhancement following gadolinium administration [9-11]. Histopathological confirmation is made either through stereotactic biopsy, endoscopic or open surgery. Jouvet, et al. proposed PPTIDs with less than six mitotic figures and presence of immunolabeling of neurofilament protein as grade II and more than six mitotic figures with loss of immunolabeling of neurofilament as grade III [1]. The surgery plays a pivotal role in relieving the local mass effect and providing a maximal tissue sample for histological analysis. Although gross total resection is associated with better local control, the correlation between the extent of resection and survival is not clear yet [12]. The good radiosensitivity of PPTs has already been reported [6,13]. Stereotactic radiosurgery is a valuable primary management modality for pinealocytoma; However, it may be used to boost therapy during multimodal therapy for malignant PPTs [14]. Local radiation may be preferred over craniospinal irradiation considering the toxicity associated. Though there is no consensus, a dose of 45–54Gy in conventional fractionation should be adequate. The association between radiation dose and survival outcome is also a matter of debate [15]. A study by Schild, et al. of 30 patients showed a link between the radiation dose and survival time in patients with pineal parenchymal tumours [16]. The higher rate of cerebro-spinal fluid (CSF) dissemination points toward importance of craniospinal radiation. Therefore, efforts should be made from clinical, pathological and genomic parameters to identify subgroup of patients at higher risk of leptomeningeal spread and intensify treatment accordingly [8]. In our case, the lumbar punction was not performed, but the cerebro-spinal MRI showed no evidence of leptomeningeal dissemination, therefore radiotherapy was limited to the tumor. Three dimensional conformal radiotherapy (3DRCT) or intensity modulated radiotherapy (IMRT) are good techniques for these cases. Given the prescribed doses around 50 Gy, the dose constraints to organs at risk such as optic nerves, optic chiasm and brainstem can be respected. The role of chemotherapy still remains an area of conflict. Chemotherapy cannot be routinely recommended in adjuvant setting in patients with PPTID. It may be tried in patients with recurrent disease or those with cerebro spinal fluid dissemination. Prognosis factors according to different reports points towards complete surgical resection, tumor grade, tumor volume and residual tumor size after initial therapy [17]. In our case, the patient was young, the tumor was 45 mm at the time of radiotherapy. The grade could not be specified (II or III).
PPTID appear to be radiosensitive tumors, though the treatment of choice remains maximum safe resection. 3DCRT or IMRT can make a good alternative to surgery in case of unresectable tumor or inoperable patient. Cranio-spinal irradiation (CSI) and subsequent chemotherapy could be recommanded to those with multiple lesions or CSF positivity. Given the rarity of this disease prospective multi-institutional studies should be arranged as soon as possible to establish the optimal PPTID management.
We acknowledge the pathology department (Pr Amarti) for her cooperation.