Fluconazole Resistance in Candida Species: Ten Years’ Experience at a Rural Tertiary Care Teaching Hospital in India
Although Candida albicans is considered as the most common cause of candidiasis, recent studies have documented increased isolation of non albicans Candida (NAC) species. Most of the published studies on candidiasis are focused towards a single clinical manifestation. Hence, the present study was designed at a rural tertiary care academic hospital of India with an aim to investigate the fluconazole resistance pattern in Candida spp. isolated from various clinical specimens. The average isolation rate of Candida spp. from clinical specimens was 12.7%. The isolation of NAC spp. from clinical specimen was significantly high (P value 0.0006). Fluconazole resistance was significantly high among NAC spp.compared to C. albicans (P value <0.0001). The incidence of fluconazole resistance was found to be increased every year. Fluconazole resistance was significantly high among Candida spp. isolated from disseminated infections in comparison to those obtained from mucocutaneous candidiasis (P value 0.03). Species identification once seldom performed in clinical microbiology services has now became important to de-escalate and focus the treatment effectively.
Keywords: Antifungal resistance; Candida albicans; Candidiasis; Fluconazole; Non albicans Candida
Infectious diseases are major problem in any health-care setup, taking its toll in the form of increased mortality and morbidity. The microbes have kept pace with strides made by science and are always a step ahead with emerging new species that are multi drug resistant and pose a threat worldwide. The spectrum of mycotic infections, once considered being restricted to cutaneous and mucocutaneous tissue has changed recently. Fungi have emerged as an important cause of life threatening opportunistic infections worldwide [1]. Opportunistic mycoses are considered as a major cause of morbidity and mortality in immunocompromised and terminally ill immunocompetent patients [2].
Among various fungal pathogens, Candida is the unique genus that can exist in either saprophytic or commensal or pathogenic state. As compared to other mycotic pathogens, clinical manifestations of Candida are very broad ranging from mucocutaneous overgrowth to disseminated infections [3].
In recent years, researchers from various parts of the world have reported increase in incidence of Candida infections. In the USA, Candida is number four leading cause of health-care associated blood stream infections and second leading cause of catheter-associated urinary tract infections (CAUTI) [4]. Candida is the third leading cause of blood stream infections (BSIs) in the intensive care unit (ICU) patients and number three cause of catheter related blood stream infections (CRBSI) [4].
Historically, although C. albicans is considered as most pathogenic member of the genus, recent studies have documented a shift towards non albicans Candida (NAC) spp [3]. These “cryptic” NAC spp. are closely related to “pervasive” C. albicans and cause similar clinical manifestations however, they differ from each other with respect to epidemiology, virulence factors and most importantly antifungal susceptibility profile [5].
NAC spp. often demonstrate intrinsic or acquired or both decreased susceptibility to fluconazole [5]. Resistance to fluconazole is of concern because it is the most common antifungal prescribed for treatment and prophylaxis of all clinical types of candidiasis [2,6]. Fluconazole possess most desirable pharmacologic properties like high bioavailability and water solubility, low degree of protein binding and wide volume of dissemination into body tissues and fluids [7]. This antifungal agent is available as a tablet, as an oral suspension, and as an intravenous formulation. As compared to other antifungals, fluconazole is more effective and better tolerated [7]. Hence, the present study was designed at a rural tertiary care academic hospital of India with an aim to investigate the fluconazole resistance pattern in Candida spp. isolated from various clinical specimens.
The present study was conducted in Department of Microbiology, Rural Medical College and Hospital of Pravara Institute of Medical Sciences, India. Pravara Rural Hospital is a 1275 bedded super specialty hospital which provides finest and expert health care services to rural population.
The study design was descriptive cross-sectional. The protocol of the study was approved by Institutional Ethics Committee (PIMS/PhD/24). Candida species isolated from various clinical specimens in a span of 10 years 2007 to 2016 were included. The following were inclusion and exclusion criteria.
Inclusion criteria: Candida isolates from all clinical specimens and isolates from pure cultures. Exclusion criteria: Repeat isolate from same clinical specimen of same patient and isolates from mix cultures.
As Candida spp. is a commensal of oral cavity and vagina, both criteria that included demonstration in direct smear and isolation in culture was used for establishing the diagnosis of oropharyngeal and vulvovaginal candidiasis. Colony counts of > 105cfu/ml was considered as significant candiduria in patients without indwelling catheters whereas, >104cfu/ml indicated significant candiduria in patients with indwelling catheters. Single isolation was considered significant from sterile body fluids like blood, peritoneal fluid, pleural fluid and cerebrospinal fluid (CSF).
Candida isolates were identified upto species level as per standard mycological protocol, which included germ tube production, carbohydrate assimilation, colony morphology and pigment production on HiChrom Candida agar (Himedia Labortories Pvt Ltd Mumbai, India). HiCandida identification kit (Himedia Labortories Pvt. Ltd Mumbai, India) supplemented identification of Candida isolates.
Fluconazole sensitivity pattern of Candida isolates was screened by Kirby-Bauer disc diffusion method on Mueller Hinton agar supplemented with 0.2% glucose and 0.5 μg/ml methylene blue agar (MH-GMB). Fluconazole (25 μg) was procured Himedia Labortories Pvt Ltd Mumbai.
Inoculum was prepared by picking five distinct colonies from 24 h old culture grown on Sabouraud dextrose agar (SDA). Colonies were suspended in 5 ml of sterile 0.85% saline. The inoculum was spread on entire surface of MH-GMB with help of sterile cotton swab. The fluconazole disc was placed on to the surface of media by using forcep. The plates were incubated at 37 ºC for 24 h. If insufficient growth was observed after 24h the plates were reincubated and read after 48 h. The results of fluconazole susceptibility testing were interpreted as per the approved Clinical and Laboratory Standard Institute (CLSI) guidelines [8]. C. albicans (ATCC 90028), C. parapsilosis (ATCC 22019) and C. krusei (ATCC 6258) were used as control strains.
Fluconazole resistance was confirmed by CLSI broth microdilution (BMD) method. CLSI BMD testing was performed exactly as outlined in document M27-A3 [9]. Fluconazole reference powder was dissolved in dimethyl sulfoxide (DMSO) for preparation of stock solution and tested in two-fold serial dilution.
Rosewell Park Memorial Institute (RPMI) 1640 medium with L-glutamine phenol red and 0.2% glucose without sodium bicarbonate and buffered to pH 7.0 with 0.165 mol morpholinepropanesulphonic acid (MOPS) was used for inoculum preparation. Aliquots of 0.1 ml of fluconazole at a concentration two times the targeted final concentration were dispensed in wells of flat bottom 96-well microtiter plates.
The drug containing microtiter plates were inoculated with 0.1 ml of yeast suspension containing 0.5 to 2.5x10³ CFU/ml. This inoculated plate was incubated at 35 ºC. Drug-free and yeast free controls were also included in the test. Results were interpreted visually with reading mirror after 24 hours of incubation.
Minimum inhibitory concentration (MIC) values were determined as the lowest concentration of drug that caused a significant diminution (≥50% inhibition) of growth relative to that of growth control. Quality control was performed as recommended in CLSI document M27-A3 using C. krusei ATCC 6258 and C. parapsilosis ATCC 22019.
Clinical interpretive breakpoints (CBPs) were used evaluate susceptibilities of isolates against fluconazole. Isolates showing MIC ≤ 8.0 μg/mL were considered as sensitive, 16-32 μg/mL as susceptible dose dependent (SDD) and ≥64 μg/mL as resistant.
Statistical analysis was done using statistical packages SPSS 19.0 (SPSS Inc. Chicago, IL, USA). Fisher’s exact test and Student’s t test were applied wherever appropriate. A P value < 0.05 was considered to be significant. Pictorial presentations of key results were made using appropriate statistical graph.
During the study period, a total of 33481 clinical specimens were received in the Department of Microbiology from various wards, out patients departments and critical care units of the hospital. Out of these 8866 (26.5%) were culture positive. Bacteria were isolated from 7326 (82.6%) specimens whereas, a total of 1540 (17.4%) clinical specimens showed growth of fungi. In the present study, Candida spp. ranked 7th among the pathogens isolated from various clinical specimens.
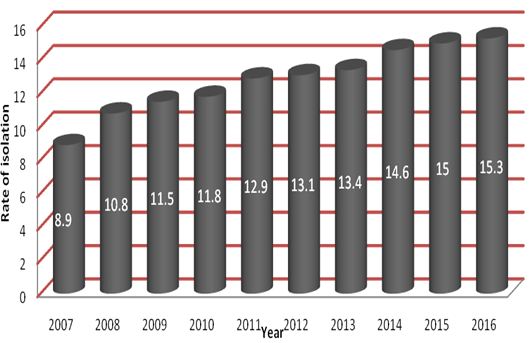
Among fungal pathogens, a total of 1131 (73.4%) were Candida species. The year wise distribution of Candida spp. is shown in Figure 1. The isolation rate of Candida spp. was increased year on year. The average isolation rate of Candida spp. from clinical specimens was 12.7%.
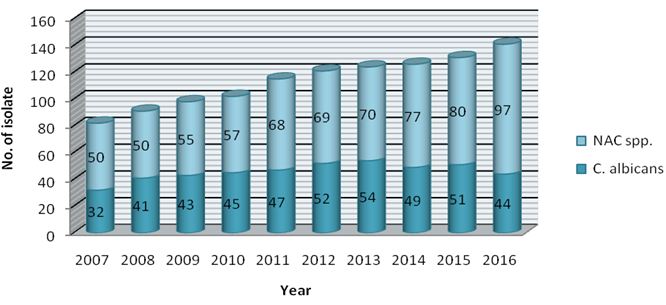
Of the 1131 Candida isolates, 458 (40.5%) were C. albicans while 673 (59.5%) belonged to NAC group. The year wise distribution of C. albicans and NAC spp. is shown in Figure 2.
The average isolation rates of C. albicans and NAC spp. were 45.8% and 67.3% respectively. The isolation of NAC spp. from clinical specimen was significantly high (Student’s t-test P value 0.0006).
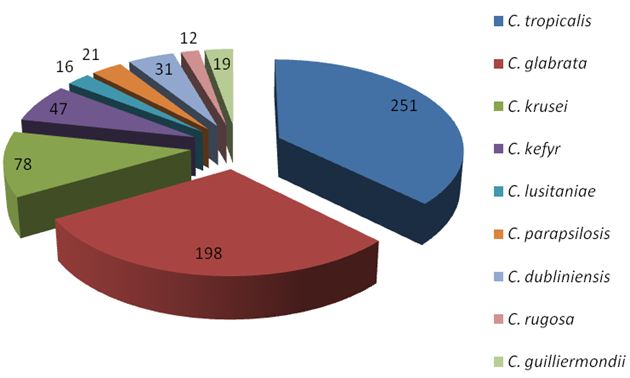
Among NAC spp., C. tropicalis (n =251, 37.3%) followed by C. glabrata (n =198, 29.4%) and C. krusei (n = 78, 11.6%) were predominant isolates (Figure 3).
As shown Table 1, majority of isolates were obtained from urine samples followed by vaginal swabs and oropharyngeal swabs. Candiduria was more common in females and patients belonging to advanced age group. Indwelling Foley’s catheter, diabetes and antibiotic therapy were major risk factors associated with candiduria.
Pregnancy followed by diabetes and antibiotic therapy were common risk factors for vuvovaginal candidiasis (VVC). HIV, diabetes and use of oral dentures were major risk factors associated with oropharyngeal candidiasis (OPC). C. dubliniensis was isolated only from cases of OPC and VVC. This NAC spp. was also isolated from HIV non-infected women with VVC.
A total of 80 Candida isolates were from obtained from blood cultures. Majority of Candida isolates (n=90, 91.8%) from blood cultures were from patients admitted to ICU. C. rugosa was isolated only from blood cultures. A total of 8 C. rugosa were isolated from burn patients. C. guilliermondii was isolated from 6 blood cultures (Table 1).
Fluconazole prophylaxis/ treatment was significant risk factor for candidiasis due to NAC spp. (Fisher’s Exact test P value 0.002 ).
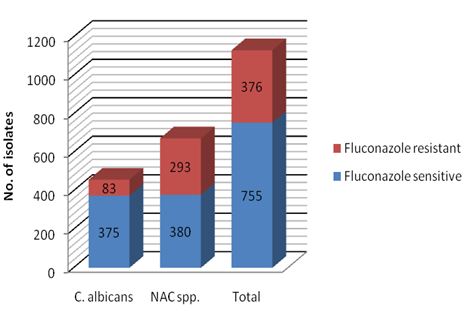
Figure 4 shows fluconazole susceptibility pattern of Candida spp by disc diffusion method. A total of 376 (33.2%) Candida spp. were resistant to fluconazole. Fluconazole resistance was significantly high among NAC spp (Fisher’s Exact test, P value <0.0001).
Among NAC spp., fluconazole resistance was high in C. krusei (97.3%) followed by C. glabrata (49.5%), C. tropicalis (34.3%) and C. rugosa (33.3%) (Table 2).
Fluconazole resistance was significantly high among Candida spp. isolated from disseminated infections compared to those from mucocutaneous candidiasis (Fisher exact test, P value 0.03).
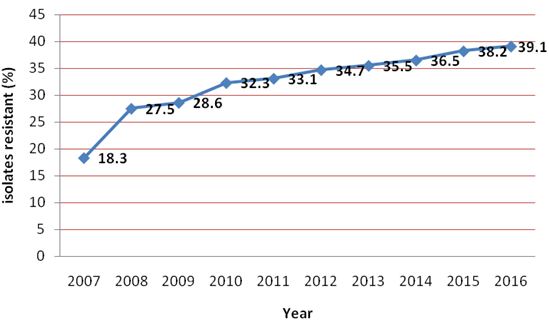
The year wise distribution of fluconazole resistance in Candida spp. is shown in Figure 5. The incidence of fluconazole resistance was found to be increased every year.The average rate of fluconazole resistance was 32.4%.
CLSI BMD method confirmed resistance in 285 Candida isolates whereas, remaining 8 isolates were found to be susceptible dose dependent (S-DD). These included 2 isolates each of C. glabrata, C. tropicalis and C. dubliniensis and a single isolate of C. krusei and C. kefyr.
The incidence and severity of mycotic infections especially candidiasis has significantly increased in recent years. Similar observation was noted in the present study, where isolation rate of Candida spp. from clinical specimens was increased year on year. Numerous factors like advent of HIV/AIDS, increased and widespread use of immunosuppressive drugs and broad spectrum antibiotics and invasive surgical interventions are implicated in the increased occurrence of candidiasis [10].
As most of studies on Candida are directed towards a single clinical manifestation, there is dearth of information regarding isolation rate of Candida spp. from different clinical specimens. To best of our knowledge, the present study is first of its kind to report compiled data on isolation rate of Candida spp isolated from different clinical specimens over a period of ten years. The average isolation rate of Candida spp. from clinical specimens was 12.7%.
In this study, the predominance of NAC spp. over C. albicans was noted. The perceivable increased emergence of NAC spp. can be attributed to various factors, but improved identification methods like use of chromogenic media and commercially available kits appears to be more important [11].
C. tropicalis followed by C. glabrata and C. krusei were predominant NAC spp. This observation is in accordance to other researchers like Kobayashi et al. and Gonzalez Gravina et al. [12,13]. In recent years, C. tropicalis alone, or in association with C. albicans or other NAC spp. is increasingly implicated in human infections [14]. The isolation of C. glabrata from clinical specimen is of concern because compared to other species; mortality rate associated with this pathogen is the highest [15]. C. glabrata, the only known haploid species of the genus Candida can be directly or indirectly acquired from contaminated environmental surfaces [11].
In the present study, majority of Candida spp. were isolated from urine samples. Candiduria usually puts physicians and microbiologists in dilemma as to whether the isolation of Candida spp. from urine specimens should be ignored as a mere contaminant or colonizers or, consider it has an indicative of urinary tract infection (UTI) including ascending pyelonephritis and renal candidiasis with sepsis [16]. Isolation of Candida spp. from urine may be sometimes the only and often the first indication of systemic candidiasis [17].
As many clinical microbiology laboratories do not perform species identification of Candida isolates from urine specimens, the change in trends of Candida isolates causing UTI is difficult to assess. In this study, candiduria due to C. albicans was noted in 42.8% of cases, whereas 57.2% of isolates from candiduria cases were NAC spp. The composition and pH of urine is known to selectively support the growth of NAC spp. As compared to C. albicans, NAC spp. are not only better adapted but also difficult to eradicate from urinary tract [10].
UTI due to Candida spp. is relatively a rare finding in structurally normal urinary tract, and in healthy individuals [16]. It is usually associated with underlying illness and some predisposing factors. In the present study, indwelling Foley’s catheter, diabetes and antibiotic therapy were major risk factors associated with candiduria.Urinary catheters serve as a portal of entry for Candida spp. into the urinary tract where they colonize if left in place for longer duration [16]. Diabetes promotes Candida colonization by three ways. First, it enhances growth of Candida in the presence of glycosuria . Second, it impairs host defense mechanism and promotes Candida invasion. Third, it promotes stasis of urine neurogenic bladder, thus increase the chances of Candida colonization [16].
VVC is an extremely common mucosal fungal infection in women of child bearing age [10]. In the current study, 58.8% of isolates from VVC belonged to NAC spp. This observation was similar to other studies [18]. C. glabrata was the predominant NAC spp. isolated from VVC cases. Similar findings were reported by Mohanty, et al. [19] and Jindal, et al. [20]. VVC due to C. glabrata represents a complicated form of the disease. C. dubliniensis was isolated from 8 HIV non-infected cases with VVC. Our observation confirms the possibility of infection due to this NAC spp. in population other than HIV infected.
OPC is an opportunistic mucosal mycoses caused by an overgrowth of Candida spp. Although this infection is not associated with mortality, it significantly contributes to morbidity. In the present study, a total of 209 Candida spp. were isolated from oropharyngeal swabs. NAC spp. were major cause of OPC (56.8%). HIV, diabetes and use of oral dentures were major risk factors associated with oropharyngeal candidiasis. At many times OPC may be the 1st visible sign of HIV infection and the patient’s only chief complaint [21]. Therefore, it can be rightly said, “Candida, the opportunistic mycotic pathogen is a better physician, as it detects abnormalities in person’s immune system sooner, than we with our diagnostic modalities”.
Candida spp. are the most common cause of invasive fungal infections and produces a broad range of manifestations requiring equally varied diagnostic and therapeutic strategies. In the present study, a total of 98 Candida spp. was isolated from cases of BSI. Candida BSI although not as prevalent as bacteremia, is associated with high morbidity and mortality in both immunocompromised and terminally ill immunocompetent patients [6]. In the present study, NAC spp. were predominant cause of candidemia. Recent national and international studies have reported similar findings. C. tropicalis was the most abundant NAC spp. even surpassing C. albicans. Epidemiological studies from India have reported C. tropicalis in as many as 67-90% cases of candidemia [22]. C. rugosa was isolated from 12 blood cultures. Out of these, 8 were from burn patients. C. rugosa is a relatively less common cause of BSIs. C. rugosa has been implicated as a cause of nosocomial BSI in burn and critically ill patients [2].
C. guilliermondii was isolated from 6 (6.1%) cases of candidemia. It is considered as a rare cause of disseminated candidiasis. As this study was confined to a single health-care setup, our observation highlights the need of multicentric studies to know whether the emergence of this NAC spp. is restricted to our hospital or it also holds true for other health-care setups in India.
The emergence of ‘cryptic’ NAC spp. and its meteoric rise in last few decades has underscored importance of identifying them and initiate control measures. As NAC spp. significantly vary in their prevalence as per country and health care setups within the country, species identification plays a significant role in selection of antifungal agent for empirical therapy and formulation of local therapeutic guidelines.
As NAC spp. exhibit varying degree of resistance to commonly used antifungal drugs, their emergence has emphasized the importance of antifungal susceptibility testing. Although in vitro antifungal susceptibility testing is now standardized and used on routine basis in developed countries, it still remains largely underutilized in developing countries.
In general, amphotericin B based preparations, the azoles, and the echinocandins are widely used as antifungal arsenals against Candida infections [7]. While amphotericin B and the echinocandins have a broad spectrum of activity against NAC spp, the azoles especially fluconazole are relatively inexpensive and have both oral and parenteral formulations [7]. Susceptibility testing for fluconazole resistance can be effectively used to guide the management of Candida infections. Demonstrated susceptibility may aid to de-escalate therapy from a parenteral agent of any class of antifungals to oral fluconazole.
In the present study, fluconazole susceptibility of Candida isolates was screened by disc diffusion technique whereas CLSI BMD was used for confirmation of resistance. Disc diffusion method is similar to the routinely used Kirby-Bauer method utilized for antibiotic susceptibility testing [23]. It is comparatively economic and convenient and therefore can be readily used in routine laboratories. Fluconazole resistance was significantly high among NAC spp like C. krusei, C. glabrata and C. tropicalis. Various national and international studies have reported total fluconazole resistant C. krusei isolates. In general, C. krusei is primarily resistant to fluconazole [24]. C. glabrata may be innately resistant to fluconazole in addition about 20% of strains develop resistance during fluconazole treatment and prophylaxis [24]. C. tropicalis was initially regarded as fluconazole susceptible species; however the scenario has changed over the period of last few years. The increasing rate of fluconazole resistance in C. tropicalis is of concern because it is one of the most commonly isolated NAC spp. As reason for rapid emergence of fluconazole resistance in C. tropicalis is unclear, the need of further studies is underscored.
In this study, the incidence of fluconazole resistance was found to be increased every year. This could be related to increased isolation of NAC spp. NAC spp. often demonstrate varying degree of resistance to fluconazole. Some species like C. krusei are naturally resistant to fluconazole; few strains of C. glabrata often demonstrate intrinsic reduced susceptibility to fluconazole while few may acquire resistance during course of therapy [23]. C. dubliniensis is primarily susceptible to fluconazole but may demonstrate secondary resistance during treatment.
CLSI BMD method confirmed resistance in 285 Candida isolates, whereas 2 isolates each of C. glabrata, C. tropicalis and C. dubliniensis and a single isolate of C. krusei and C. kefyr were found to be S-DD. The novel category “susceptible dose/deliver dependent” (S-DD) indicates that maximization of dosage and bioavailability are critical to successful therapy [23].
To best of our knowledge, the present study is first to report the compiled ten years data of Candida spp. isolated from various clinical specimens and their fluconazole susceptibility pattern from rural part of India. The shift from “pervasive” C. albicans towards “cryptic” non albicans Candida spp. along with increasing resistance to fluconazole was noted. Species identification along with antifungal susceptibility testing of Candida spp. should be emphasized in order to de-escalate and focus the treatment effectively.
The authors are grateful to the management of Rural Medical College and Pravara Rural Hospital of Pravara Institute of Medical Sciences (Deemed University), Loni, Maharashtra, India, for their support and encouragement throughout the study. They also thank the technical staff of Department of Microbiology for their assistance in the study.