Frequency of Migraine, Presence of Neuropsychiatric Symptoms and Attachment Style: Comparative Study
Introduction: In assessing the associations between pain frequency and neurotic behavior, in addition to psychiatric comorbidities, a difference in attachment style was observed in which individuals with chronic and episodic migraines. This study investigated associations between migraine and neurotic traits or symptoms by comparing the personality profiles in attachment style of patients with episodic and chronic migraines.
Patients and Methods: In a retrospective descriptive analysis of different classes of chronic daily headache, this study focused on a group of 120 adult migraine patients consecutively referred by a neurologist to a headache outpatient clinic. Participants were assessed using the Factorial Neuroticism Scale and were assigned to two groups according to the frequency of pain.
Results: Of the 80 patients with chronic (age: 43.9 ± 13.7 years) and 40 subjects with episodic migraines (age: 37.15 ± 13 years), most (86.7%) were women and almost 90% presented neurotic symptoms. More chronic migraine patients had two (p=0.039) or more psychological disorders (p<0.0001) than subjects with episodic migraines. Dependent personality disorder (p<0.0001), anxiety, and impaired concentration and production (p=0.0008), depression, apathy and mood swings (p<0.0001), suicidal ideation (p=0.0007) and hopelessness (p<0.0001) predominated in chronic migraine. Episodic migraine patients mainly suffered from excessive independence and avoidant personality disorder (p=0.0001), reduced self-criticism, motivation, attention, perception and problem-solving attitudes in unexpected situations (p <0.0001).
Conclusion: In association with the frequency of pain, the results showed opposite tendencies between episodic and chronic migraine patients in their perceptual, relational and coping strategies. Subjects with episodic migraine were affectively detached, individualistic, cold and elusive, more typical of the insecure-avoidant, self-centered attachment style. Chronic migraine subjects, on the other hand, in addition to a greater number of comorbidities, showed an expectative anxious dependent, victimized and depressed, with hopelessness and suicidal inclination, more typical of the insecure anxious-ambivalent attachment style.
Keywords: Migraine Disorders; Psychological Symptoms; Relationship style; Attachment models; stress
Migraine, a primary, unilateral and throbbing headache, associated with nausea and/or vomiting, photo and phonophobia, defined as chronic when it occurs at least eight days a month for more than three months with a minimum duration of four hours [1-3], has been described as a chronic disease with sporadic and progressive manifestations in some people [4,2]. It is estimated that 3% of patients with episodic migraine (EM) evolve to chronic migraine (CM) [2].
Since 1937, in studies associating crises with situations of tension, exhaustion, or emotional conflicts [5], correlations have been investigated between headaches and psychological factors [6-9], including relational factors. A greater sensitivity to stress and secondary neuroticism was found in subjects with CM [10,11]. CM patients have higher scores for neuroticism, which groups negative personality traits, than healthy populations or other patients even those with other types of pain. The neuroticism score is positively associated with the severity and frequency of pain. The presence of psychiatric disorders worsens the course of migraine, thereby increasing the frequency, severity and/or responsiveness to treatment [8,11].
The style of socialization of headache patients has also been investigated. A 2005 study showed an association between headache in adults and insecure attachment style compared to a healthy control group [12]. However, the authors did not specify the modalities of insecure attachment and headache. Furthermore, in 2012 a study found a correlation of migraine, psychological symptoms and attachment style in children and adolescents [13].
The attachment style in adults is regulated by the attachment system, an innate behavior that aims to ensure protection and survival [14-17]. Managed by the central nervous system of the baby and caregiver, it involves strategies and goals of evolutionary and adaptive behavioral-motivational control [15,17,18]. Coupled with the security and confidence developed in childhood, attachment works as a support base that is useful when starting to explore the world alone [19,20]. It is a property of psychosocial relationships in which a weaker, less able person relies on the protection of another more competent, powerful person in situations of stress, even during adulthood [21].
Continuous or frequent stress can affect socialization and interest depending on whether the attachment style is secure or vulnerable. The more the attachment figure is perceived as available and the environment as calm, the greater the sense of security, improving functioning and the competence outside the relationship. Thus, secure attachments are more associated to job success and satisfaction, to less concern with performance or with the evaluation of others [19,20,22]. The insecure adult perceives little availability of the other, does not trust others, is uncomfortable with closeness and intimacy, and presents low cognitive-emotional flexibility for alternations between caring and being cared for. However, while the avoidant insecure person does not create expectations or feel afraid about being abandoned (hypoactivation of the attachment system), the insecure anxious-ambivalent individual feels much need for closeness and fear of separation (hyperactivation of the attachment system). Their relationships are asymmetrical and rigid, caring for or being cared for almost compulsively [19,20,22]. The avoidant insecure personality is more associated with a compulsive posture and working alone and the anxious insecure personality tends to keep close to caregivers by being effective, to get attention and the approval of the other [22,23]. There are studies showing the association of insecure attachment with greater adaptive capacity and greater risk for clinical problems [24]. Brumariu & kerns found greater vulnerability to clinical symptoms in anxious insecure attachments [25].
Internalized models of attachment are dynamic, subject to changes as circumstances and forms of relationship vary [26], adapting to new internal or external demands [27-30]. Although the secure attachment model presents moderate stability, there are studies about the incidence of events that can change the style of attachment throughout life [19,20,28].
Pain, a factor associated with threat, affects the quality of life [11]. Neurotic comorbidities of migraine, the chronification process of which remains unknown, may be indicative that a similar pathophysiological mechanism explains the two clinical forms, either as a casual, causal or shared-risk relationship [6,23]. A previous study about the association between headache and attachment style in adults showed that sufferers presented an insecure attachment style and concluded that this relational style is a possible risk factor for developing headaches. Who knows whether the stress of pain may be among the triggers of neurotic disorders, or among the mechanisms that alter adult attachment style?
The objective of this study was to evaluate associations between the frequency of migraine and neurotic traits or symptoms by comparing patients with EM and CM and describing possible personality profiles from the point of view of neuroticism and attachment styles.
This retrospective descriptive analysis of different classes of chronic daily headache enrolled male and female over 18-year-old subjects with a diagnosis of migraine who were being treated in the Headache Clinic of Hospital de Base in São José do Rio Preto. From a larger population, the present study focused on 120 patients referred by a neurologist with a diagnosis of migraine. The study eligibility criteria, apart from age>18 years, were the ability to provide informed consent and to complete the study inventories. The exclusion criterion was to present other chronic organic diseases.
Over two and a half years, participants were allocated to two groups depending on the frequency of pain. After consulting with the neurologist and giving their formal consent to participate in the research, patients were interviewed by a psychologist who verified demographic variables and applied the Neuroticism Factorial Scale (NFS) [29]. Data were analyzed using Fisher’s exact test with differences between groups being considered significant when the p-value was <0.05.
The NFS is a self-report objective scale, based on the five great personality factors of the Diagnostic and Statistical Manual of Mental Disorders, 4th Edition. It quickly and objectively evaluates characteristics of emotional instability and adjustment [29-31]. This test was developed within the model of the Big Five Personality Factors, which conceives human personality from five big dimensions: Neuroticism, Extraversion, Agreeableness, Conscientiousness, and Openness. The Neuroticism factor is composed of subdimensions which group symptoms and predispositions such as impulsiveness, hostility, depression, anxiety, vulnerability. (McCrae & John, 1992). This scale is validated in comparison with the Neuroticism Scale of the Eysenck Personality Questionnaire, Beck’s Anxiety Inventory (BAI), Beck Depression Inventory (BDI), Subjective Well-Being and Rosenberg’s Self-Esteem Scale [32]. The instrument, validated in a Brazilian population with an appropriate internal consistency (Cronbach’s Alpha = 0.94), consists of 82 items and four subfactors: vulnerability, psychosocial maladjustment, anxiety and depression [32]. The results may indicate neurotic personality traits such as dependent, avoidant, and antisocial or borderline personality disorder, depression, anxiety, difficulty in perceiving problems and organizing oneself to face problems, low capacity for concentration and production, suicidal ideation and hopelessness [29].
The project was approved by the Research Ethics Committee of FAMERP (number 6629/2007).
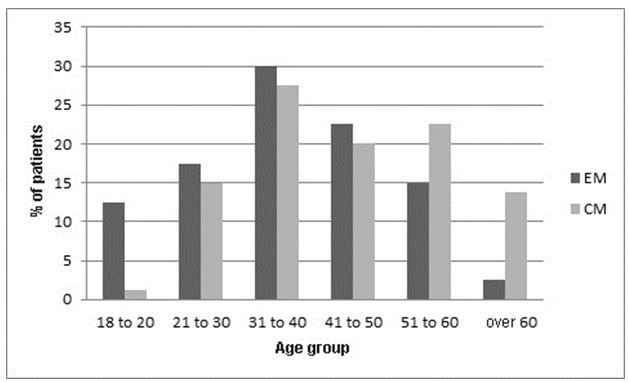
Table 1 shows the sociodemographic characteristics of the population with CM and EM. Of the total sample, 86.7% patients were female, 80 suffered from CM (mean age: 43.9 ± 13.7 years) and 40 from EM (mean age: 37.15 ± 13 years). The majority of patients in both groups were married, however, while 62.5% of those with EM worked only 46.2% of those with CM had jobs. Furthermore, a higher level of schooling was also observed among patients with EM. Although patients of the two groups were not matched, there were no significant differences between groups except for schooling (p-value = 0.001). Figure 1 shows the percentage distribution of patients with CM and EM stratified by age group.
Almost all the patients had symptoms of neuroticism, with a higher proportion among those with CM. The results by item of the NFS scale are shown in Table 2.
The association between headache and insecure attachment model agrees with previous research. However, there is a great difference in the style with which patients with episodic or chronic pain behave to cope with their problems and in their attachment to others. The behavior and the expectations of migraine patients regarding the environment and relationships proved to be opposing. Patients with EM presented perceptual detachment from their problems and their expectations of others with reduced motivation and attention to new and unexpected situations, characterized by an excessively low level of anxiety (p-value<0.0001). On the other hand, patients with CM showed impulsivity, irritability, panic and mood swings, resulting in less concentration and decreased productivity, characterized by an excessively high level of anxiety (p-value = 0.0008), including in respect to their expectations of others.
The mean age of the subjects with EM was lower than those with CM; this result supports studies that state EM transforms to CM with age. On considering the opposing psychological tendencies observed in these patients, the detachment presented by subjects with EM and the exacerbated involvement of those with CM, this transformation involves important changes that may be associated with the increased frequency of pain. It is as if the person, initially absorbed in trying to deal with the migraine, finally feels impotent and debilitated by successive failures of their internal resources to cope with the growing pain and they give in thereby becoming dependent on help from others.
Behavioral inclinations and expectations of migraine sufferers characterize patterns of insecure attachments in relationships in both groups. In the light of insecure neurotic attachment styles, the difference between the behavioral characteristics of the groups configures a transfer from one to another mode of attachment [22-24]. The tendency of people with EM to become detached from themselves and others, indifferent to problems (p-value = 0.0001), inattentive and distanced from the opinion and expectations of others, evolves to an extreme in some patients thus configuring an avoidant personality disorder (p-value = 0.0005). This condition seems to be directed against the subject’s pain, with nothing or nobody mattering, as a strategic attempt to cope with or adapt to the condition. Their stance is consistent with the insecure avoidant attachment style. In CM, on the other hand, the patient shows the opposite position with an anxious search (p-value = 0.0008) dependent on others (p-value <0.0001), a disorganized and irritable mood with little control, an irritated and depressive apathy (p-value <0.0001), loss of hope (p-value <0.0001) and suicidal ideation (p-value =0.0008). This is as if efforts to manage the stress of pain had collapsed and they had succumbed. Their attachment profile to the environment and attachment figures is more typical of the insecure anxious-ambivalent attachment style.
From the point of view of coping strategies, the detachment observed in EM can be seen as absorption necessary to cause an adaptation to a stressful situation associated with pain. With the increase in the frequency of the pain, this condition can become more and more demanding and, when it reaches the frequency of chronic pain, it can enter the phase of exhaustion [33]. In this case, anxious insecure attachment would be an adaptive style of behavior adopted to guarantee the ever-increasing care the patient needs from those around. Pleasing others so as not to be abandoned can become critical when one recognizes an increasing difficulty in dealing with one’s own demands.
However, this hypothesis requires further study before arriving at any conclusion. Who knows, whether it can be concluded that people with anxious insecure attachments tend to develop CM, and people with insecure avoidant attachments tend to have EM that does not increase in frequency.
There was also a difference in depression, which was more pronounced in the CM group (p-value <0.0001), thereby confirming results from other studies. Even isolated symptoms, such as suicidal ideation, although present in 2.5% of the episodic population, was ten times higher in CM with 26.2% presenting this symptom (p-value = 0.0008). This symptom was even more notable among the women evaluated in the CM group (p-value = 0.047). Hopelessness was more pronounced among CM patients (p-value <0.0001), as if, convinced of their impotence, they give up trying. These results corroborate the literature that development of suicidal ideation is more closely related to pain chronicity and certain psychosocial factors than how severe or physically incapacitating the pain is [34].
Also noteworthy are questions about the day-to-day life of the sufferer who lives continually trying to adapt to the progression of the pain. For how long can coping strategies be readapted to continuous stress when faced with frequent headaches? Until when are the patient’s own resources sufficient when faced with daily fatigue and when is it necessary to seek help? The role of attachment in coping strategies associated with requests for help have already been investigated [33]. We must ask in the case of migraine patients whether the pain is a modifying factor of the attachment style they adopt.
Even though successive adaptations seem to occur, increasing the threshold of tolerance to pain, a stage of exhaustion is reached as the mechanism of adaptation to stress is in continuous demand and there are increases in the frequency of pain. With coping strategies collapsing, patients tend to have a greater number of neurotic symptoms including hopelessness and suicidal ideation.
Although the present study did not investigate the level of stress, it seems to be in agreement with studies about the association of stress with the development and maintenance of chronic headaches, in which half of the patients presented levels of stress near to exhaustion [20]. It is possible that the chronification of migraines is associated with this change in coping strategies, configuring hopelessness and suicidal ideation and a greater number of combined disorders, as a collapse of the organism with successive attempts to adapt to the continuous exposure to pain, typical of the exhaustion phase caused by stress.
The prevalence of suicidal ideation, which is higher in CM even among patients who do not meet the criteria for depression, should be investigated and considered in the treatment of headaches [34].
The results also support previous studies about the association between vulnerability to clinical symptoms and the insecure-ambivalent attachment style evidenced here in CM patients [24]. Follow-up studies could be useful in mapping a possible transfer of attachment characteristics of the personality in parallel with increased frequencies of migraine, categorizing the transformation of headaches as an event that can change the attachment style during life.
The frequency of migraine progresses in parallel with the number of neurotic symptoms and a radical change in the insecure attachment style with which patients interact with others. Psychological profiles related to EM and CM present opposing tendencies in perceptual, relational and coping strategies, suggesting a move from an expectant inward-looking posture to the contrary outward-looking posture. While EM patients appear to detach themselves from problems and from interpersonal relationships, external opinions and expectations, becoming independent and tending to avoidant disorder, the CM patient seems to accentuate the relational expectation tending to show an anxious dependent personality profile, irritable and apathetic, depressive with notable hopelessness about the future and greater risk for suicidal ideation.
Both types have insecure attachment profiles. However, there is a shift from a typical attachment style of insecure avoidant attachment to an insecure anxious-worried-ambivalent attachment. The transformation of episodic headaches seems to be associated with the transformation of the attachment style during life. In addition, the attachment profile appears to be associated with a mechanism of adapting to stress. Follow-up studies could shed more light on whether increased frequencies of pain can be included among attachment-altering events in adults.