Henoch-SchÖlein Purpura Nephritis in Children: A Severe IgA Mediated Glomerulonephritis
Background: Henoch-SchÖlein purpura nephritis (HSPN) and IgA nephropathy (IgAN) are common in children and characterized by IgA deposits in glomeruli. HSPN shows more severe glomerular lesions than IgAN; however, a systematic approach to compare pathological features of both diseases is lacking. The objective of this study was to compare histological parameters, using those from “Oxford Classification of IgA Nephropathy” as well as from active glomerular lesions to distinguish these two entities.
Methods: Renal biopsies performed at the Children’s Hospital of Michigan during 2004-2010 with the diagnosis of HSPN and IgAN were reviewed. The “Oxford Classification of IgA nephropathy” was applied to measure mesangial cellularity, endocapillary proliferation, segmental glomerulosclerosis, and tubular atrophy/interstitial fibrosis. Measurements for active glomerular lesions, (i.e. the highest number of mesangial cells, percentage of glomeruli with endocapillary proliferation, cellular crescents and segmental necrosis) were also performed. Clinical presentations, including hypertension, protein/creatinine ratio, hematuria, and estimated glomerular filtration rate were compared between HSPN and IgAN patients. Findings in HSPN and IgAN were compared using student t-test
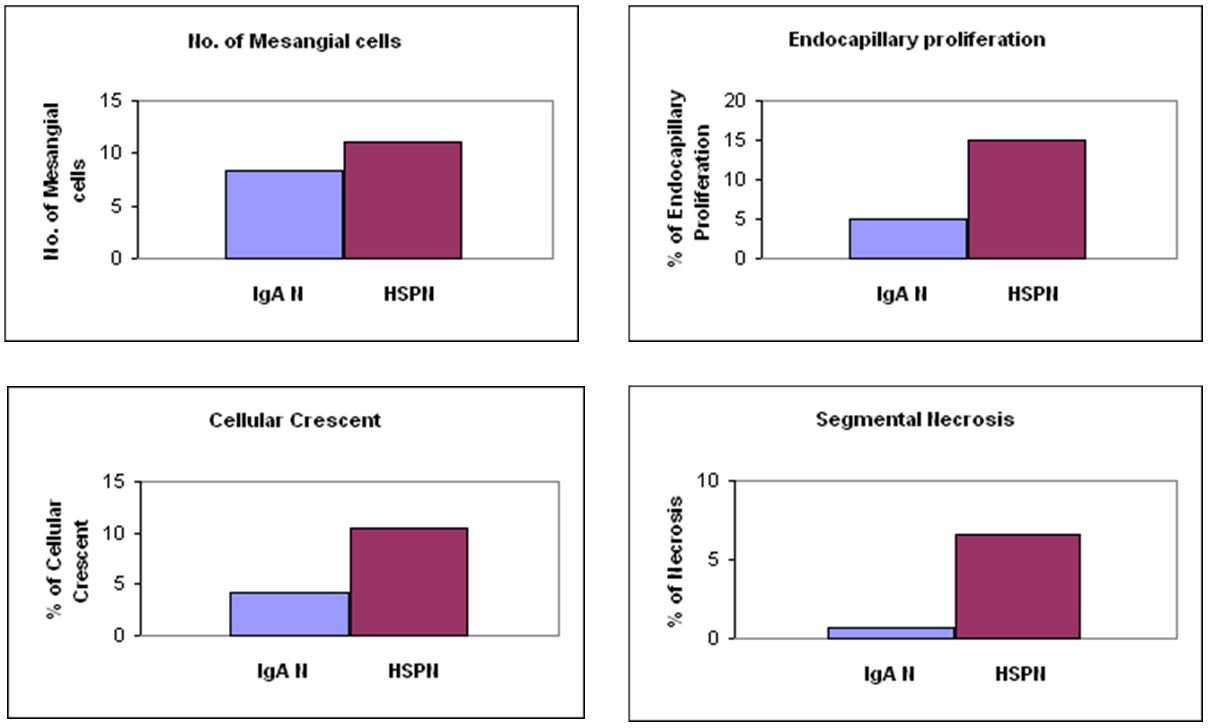
Results: A total of 23 HSPN and 26 IgAN patients were diagnosed during study period. HSPN patients were significantly younger than those with IgAN (7.8 ± 3.3 vs 12.4 ± 3.2, year-old, p<0.05). Patients with HSPN had more mesangial cells (11 ± 3.2 vs 8.3 ± 2.4), higher percentage of glomeruli with endocapillary proliferation (14.9 ± 2.2 vs 4.9 ± 8.2), cellular crescents (10.4 ± 1.2 vs 4.3 ± 2.8), and segmental necrosis (6.6 ± 1.3 vs 0.7 ± 1.1), all p<0.05). There was no significant difference between HSPN and IgAN in the Oxford Classification (p>0.05). There was a trend toward higher in protein/creatinine ratio in HSPN than IgAN that was not significant.
Conclusion: HSPN and IgAN share histopathological features of mesangial/endocapillary proliferation, but HSPN has more extensive mesangial/endocapillary proliferation and a higher percentage of glomeruli with cellular crescents and segmental necrosis, indicating more severe glomerular damage.
Keywords: Henoch-SchÖlein purpura nephritis; IgA nephropathy; Oxford Classification; Children; Immune Complex
Henoch-SchÖlein purpura (HSP) is a common systemic disease in children caused by the deposition of circulating IgA-mediated immune complexes along small vessels in multiple organs, including the kidneys [1-5]. Clinically, HSP nephritis (HSPN) presents with microscopic or gross hematuria with varying amounts of protein in the urine. Hypertension and acute renal failure may occur in severe cases [6-9]. IgA nephropathy (IgAN) is another renal disease that may occur in children, due to IgA deposition in glomeruli [5,10]. Children with IgAN usually have no systemic manifestations and generally present with hematuria, and the renal function remains normal. Some believes that HSPN and IgAN fall in a spectrum of the same disease process, in which IgAN is a localized form of HSPN. Both entities display mesangial IgA deposits in the glomeruli [1,11-13], specifically due to deposition of galactose-deficient IgA1 [12,14]. HSPN patients usually show more active glomerular lesions than those with IgAN in pathological reports [15-22].
The recently published “Oxford Classification of IgA nephropathy” by an international working group [23,24] provides a semi-quantitative approach to evaluate IgAN. By this classification, a set of six morphological parameters is initially applied to evaluate renal histology. These parameters include mesangial hypercellularity (M), endocapillary proliferation (E), segmental sclerosis (S), tubular atrophy/interstitial fibrosis (T), cellular crescents and segmental necrosis. The first four parameters composes MEST scheme and are recommended to be included in pathological reports for IgAN because of their value in predicting prognosis. M and E score represent the active glomerular lesions while S and T are histological predictors for long time clinical outcome [23,24]. This classification has been shown to be useful in pediatric IgAN as well [25].
Since there is no classification for pediatric HSPN, the main objective of the present study was to compare the histological parameters from Oxford Classification for IgAN and parameters for active glomerular lesions to distinguish HSPN from IgAN in pediatric patients.
For this retrospective study, renal biopsies in pediatric patients with HSPN and IgAN performed between January 2004 and December 2010 at Children’s Hospital of Michigan, Detroit, were reviewed. Included in the present study were 23 patients with HSPN and 26 patients with IgAN. Patients with glomerular IgA deposits due to other glomerular diseases, such as lupus nephritis or membranous proliferative glomerulonephritis were excluded. Also excluded were renal biopsies with inadequate renal cortical tissue that contained less than 10 glomeruli per histological section. This study was approved by the Wayne State University Human Investigation Committee.
The histological slides of renal biopsies were reviewed by the renal pathologists without knowledge of the clinical data. Morphological assessment of renal biopsies for both HSPN and IgAN was performed in accordance with the Oxford Classification of IgAN [23,24]. This was approached by evaluation of MEST score for mesangial hypercellularity (M), endocapillary hypercellularity (E), segmental glomerulosclerosis (S) and tubular atrophy/interstitial fibrosis (T). For MEST scoring, the M score (M0-3) measure the ratio of the glomeruli to the sum of mesangial cells. The E score is defined as presence (E1) or absence (E0) of proliferation within glomerular capillary lumens. S score refers to presence (S1) or absence (S0) of segmental sclerosis, and the T score (T0-2) defines the percentage of renal cortical area involved by tubular atrophy/interstitial fibrosis [23,24]. In addition to MEST scoring, measurements for active glomerular lesions, including glomeruli with the highest number of mesangial cells, and the percentage of glomeruli with endocapillary proliferation, cellular crescents and segmental necrosis were also calculated in both HSPN and IgAN [23].
Each patient’s medical record was reviewed by the clinicians for renal manifestations at the time of biopsy. The presence of hematuria (gross or microscopic), hypertension and the urine proteinuria/creatinine ratio and estimated glomerular filtration rate (eGFR) were documented.
Values are given as means ± SD. The student t-test was applied to compare the variables, i.e. M, S, E and T score, as well as active glomerular lesions described above. A p value less than 0.05 was considered to be significant difference.
The demographic details on HSPN and IgAN patients included in the present study are shown in Table 1. The majority of HSPN (77.0%) and IgAN (76.9%) patients were Caucasian. The age of IgAN patients at the time of biopsy was 12.4 ± 3.3 years-old, ranging from 6-16 years-old. The HSPN patients were significantly (p < 0.05) younger than IgAN patients, ranging 2-14 years-old with a mean age of 7.8 ± 3.3 year-old (Table 1).
At the time of renal biopsy, HSPN and IgAN patients presented with varying severity of proteinuria, with protein/creatinine ratio ranging from 0.05 to 14 for HSPN and from 0.37 to 20 for IgAN patients (Table 2). Hypertension was more frequent in IgAN patients (12.8%) than HSPN (4.3%). A majority of HSPN patients (95%) and all IgAN patients (100%) presented with microscopic hematuria. More IgAN patients (72.0%) presented with gross hematuria than HSPN (18.1%). The HSPN patients showed higher (5.3 ± 8.8), but not statistically significant difference, protein/creatinine ratio than IgAN (3.8 ± 5.6). There was no significant difference in eGFR between HSPN and IgAN (Table 2).
The “Oxford Classification of IgA nephropathy” suggests that a pathology report with the diagnosis of IgAN should include the MEST scheme with the following information to predict the prognosis: presence (M1)/absence (M0) of mesangial hypercellularity, presence (E1)/absence (E0) of endocapillary proliferation, presence (S1)/absence (S0) of segmental glomerulosclerosis, and the degree of tubular atrophy/interstitial fibrosis (T0-2) [23,24]. Comparison of MEST score by Oxford classification for IgAN and HSPN is shown in Table 3. By this approach, all HSPN and IgAN patients presented with mesangial proliferation (M1), with no significant difference (p>0.05) in M score. Endocapillary proliferation was identified in thirteen of twenty-three HSPN and nine of twenty-six IgAN patients. Overall, the Mean E score was 0.57 ± 0.51 for HSPN and 0.35 ± 0.49 for IgAN. HSPN patients showed higher Mean E score than IgAN, however, no significant difference (p>0.05) was found. Only one patient from HSPN and another from IgAN group showed segmental sclerosis. There is no significant difference in the S score for HSPN (0.04 ± 0.21) and IgAN (0.04 ± 0.20). Tubular atrophy/interstitial fibrosis were minimal in both HSPN and IgAN.
The “Oxford classification of IgA nephropathy” also provides reproductive measurements for IgA nephropathy. Following this classification, we evaluated the exact score of glomerular lesions in renal biopsies with HSPN and IgAN. The distribution of mesangial, endocapillary proliferation, segmental sclerosis and tubular atrophy/interstitial fibrosis scores is shown in Table 4. All renal biopsy from HSPN and IgAN patients were scored according to the classification for active glomerular lesions, i.e. mesangial hypercellular (M0-3), endocapillary proliferation (E0-1), and outcome predictors, i.e. segmental sclerosis (S0-1) and tubular atrophy/interstitial fibrosis (T0-2). As shown, the majority of HSPN and IgAN patients fell into the highest M score group (M3). The percentage of patients with endocapillary proliferation was higher in HSPN (56.5%) than IgAN (34.7%). In terms of long term outcome predictors, both S and T score were similar, with very low score for HSPN and IgAN, suggesting a good prognosis for both HSPN and IgAN. Thus, although HSPN patients exhibited more active glomerular lesions in mesangial and endocapillary proliferation, the scoring system suggested by classification was not sufficient to distinguish HSPN from IgAN.
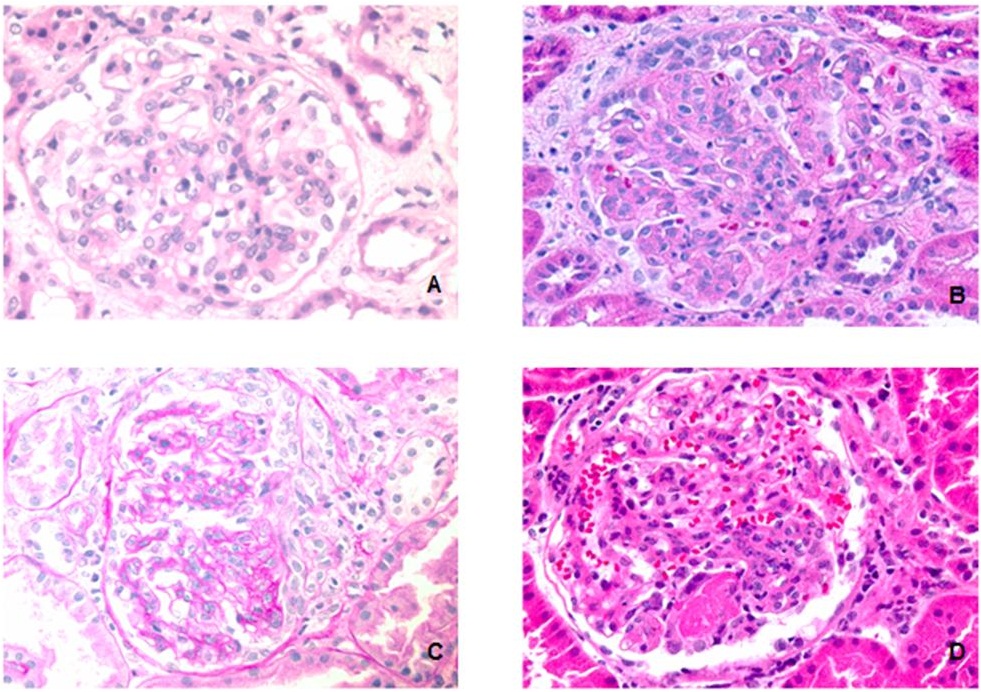
Previous studies have shown that IgAN presents with more mesangial proliferation in adult [26-30]. Because a majority of pediatric HSPN and IgAN patients belonged in the highest M score group in present study (Table 4), the M score defined by the Oxford Classification may underscore pediatric IgAN as well as HSPN. In order to distinguish HSPN from IgAN in pediatric patients, the measurement of mesangial cells needs to be redefined. To explore this, we alternatively applied another approach to access the mesangial proliferation by counting number of mesangial cells in all glomeruli and the glomerulus with highest number of mesangial cells was used to compare in biopsies from HSPN and IgAN patients (Figure 1A). Further, the percentage of glomeruli with endocapillary proliferation, rather than presence/absence of endocapillary proliferation were recorded (Figure 1B). Other measurements for active glomerular lesions, which were not included in scoring system in Oxford Classification of IgAN, such as the percentage of glomeruli with cellular crescents (Figure 1C) and segmental necrosis (Figure 1D), were also recorded and compared. A summary of these findings are shown in Table 5. HSPN had significantly more mesangial cells than IgAN, higher percentage of glomeruli with endocapillary proliferation, cellular crescents and segmental necrosis IgAN (Figure 2). These findings indicate that HSPN has more extensive mesangial/endocapillary proliferation and a higher percentage of glomeruli with cellular crescents and segmental necrosis, thus more severe glomerular damage than IgAN.
The clinical diagnosis of HSP is not difficult because of its presentation with a typical distribution of rash and abdominal pain. Kidney involvement in the majority of patients is not significant and may only present with microscopic hematuria and mild proteinuria. In those patients presenting with alteration of renal function and/or severe proteinuria, renal biopsy is ordered to confirm the diagnosis of HSPN to assess the severity of renal involvement, and to define the treatment strategy. However, a pathological classification of HSPN with good clinical and pathological correlation is lacking. Since both HSPN and IgAN share same diagnostic criterion in renal biopsies, we used the current Oxford Classification of IgAN to assess HSPN activity and correlated with their clinical presentations.
In the present study, the patients with IgAN were significantly older than those with HSPN, similar to the previous reports [6, 21,31-41]. No significant differences were seen in patient’s gender and race for both HSPN and IgAN. Clinical presentations of IgAN and HSPN showed varying severity in renal manifestations. A majority of patients with IgAN had gross hematuria (72%) as compared to HSPN (18%). Patients with HSPN had more significant proteinuria as compared to those with IgAN. Hypertension was more common in IgAN than HSPN. However, no significant differences were seen in the estimated GFR.
Several histological classifications of IgAN have been proposed [30,42,43]. The most recently published “Oxford Classification of IgA nephropathy” provided a systematic approach to identifying specific morphologic changes that could predict clinical outcomes of IgAN. Four active glomerular lesions are chosen initially (mesangial proliferation, endocapillary proliferation, cellular crescents and necrosis) and two chronic lesions (tubular atrophy/interstitial fibrosis, segmental and global glomerulosclerosis) [23]. After testing their reproducibility, the MEST scheme excluding cellular crescent and necrosis, was set up because of its independent value with active glomerular lesions and predicting clinical outcome [24]. In the present study, the MEST scheme was unable to distinguish HSPN from IgAN in terms of glomerular lesions (Table 3). Both HSPN and IgAN exhibited minimal segmental sclerosis and tubular atrophy/interstitial fibrosis, which are considered a good clinical outcome.
The reason for failure of the MEST scheme to differentiate activity of glomerular lesions in HSPN and IgAN may probably relate to the differences in the morphological findings between children and adult with IgAN [26-30]. Younger patients present with significantly more mesangial and endocapillary proliferation. As shown in Table 5, the fact that a majority of HSPN and IgAN patients fell in the M3 group indicates no significant difference detected in M score between HSPN and IgAN probably rests in the definition of classification. Similar issue is seen in the E score as the percentage of patients with endocapillary proliferation was higher in HSPN than IgAN but no significant difference was detected.
To further characterize the renal biopsy findings, a comparison between HSPN to IgAN was performed in present study by direct calculation of the number, rather than score, of the mesangial cells and percentage of glomeruli, rather than presence/absence with endocapillary proliferation. Following this approach, HSPN showed significantly higher mesangial and endocapillary proliferation (Table 4) (Figure 2). Two additional parameters for active glomerular lesions, cellular crescents and segmental necrosis, were also significantly higher in HSPN patients (Table 4) (Figure 2). This finding received support from recent report from the Katafuchi [44] group that cellular crescents should be included in the Oxford Classification of IgAN. Therefore, HSPN patients need alterative, more extended approaches to detect active glomerular lesions to distinguish from IgAN. These findings received support from the comparison of clinical presentations of HSPN and IgAN patients. The protein/creatinine ratio is usually higher in HSPN patients than IgAN, indicating more severe proteinuria, although this did not reach statistical significance in present study, which may be due to a wide range of proteinuria in HSPN patients. In addition, biopsies with the diagnosis of IgAN were more likely from selected patients, as nephrologists tend to order biopsies in those patients with severe clinical presentations. This might explain that gross hematuria was found in higher percentage of IgAN patients in present study. Despite these, both HSPN and IgAN exhibited minimal segmental sclerosis and tubular atrophy/interstitial fibrosis.
The major limitation in present study is that a relatively small number of patients was included. Kidney biopsy in pediatric patient is challenging, especially in young children, so kidney biopsy is usually avoided in those IgAN and HSPN patients with mild proteinuria and hematuria. The retrospective nature of the study represents an additional limitation.
In summary, the present study confirmed that both HSPN and IgAN in children share histopathological features of mesangial and endocapillary proliferation. HSPN exhibited severer glomerular damage, such as cellular crescents and segmental necrosis in children.