Hepatotoxicity Activity of Broad Spectrum Antibiotics (Amoxicillin and Ciprofloxacin) after Prolonged Administration in Wistar Albino Rats
This study evaluated the hepatotoxicity activity of two broad spectrum antibiotics, Amoxicillin and Ciprofloxacin both independently and synergistically in Wistar albino rats for twenty-one days administration. Doses of 7.14mg/kg and 14.28 mg/kg (equivalent to 500mg/70kg and 1000mg/70kg) were used for the experiment, and 7.14mg/kg each of both drugs were combined to evaluate synergistic effect. Group 1 received no administration (negative control), group 2 received 7.14mg/kg of Ciprofloxacin, group 3 received 7.14mg/k of Amoxicillin, group 4 received 14.28mg/kg of Ciprofloxacin, group 5 received 14.28mg/kg of Amoxicillin and group 6 received 7.14mg/kg each of both drugs. After the 21-day period, the animals were fasted and their blood and liver collected for biochemical and histopathology examination of the liver. The degree of hepatotoxicity was determined by measuring levels of biochemical markers; Alanine aminotransferase (ALT), Aspartate aminotransferase (AST), Alkaline phosphatase (ALP), Bilirubin and Total protein. The result of this study showed that the levels of ALT, AST, ALP and Total protein were significant difference (p<0.05) when compared with the control, the bilirubin level in the serum showed no significant difference (p>0.05). The histopathology examination showed normal hepatocytes for animals in groups 1 (control), 2, 3 and 5, but showed necrosis, mono-nuclear phagocytes and mild to severe infiltration of inflammatory cells in group 4 and 6. Both drugs at normal doses has little effect on the liver biomarkers, but showed more injury to hepatocytes at high dose for prolonged use. The synergistic effect showed severe injury to liver cells, with inflammatory and phagocytic infiltration.
Keywords: Hepatotoxicity; Broad Spectrum Antibiotic; Wistar Albino Rats; Amoxicillin Ciprofloxacin
The liver is the major organ of metabolism and excretion and possesses the function of detoxifying xenobiotic, environmental pollutants and chemotherapeutic agents; these substances alongside oxidative stress are responsible for the occurrence of liver injury (hepatotoxicity) which is a major clinical concern [1]. Liver toxicity is associated with cellular necrosis, increase in lipid peroxidation and depletion of glutathione levels. In addition, serum levels of many biochemical markers like aspartate aminotransferase (AST), alkaline phosphate (ALP), bilirubin and albumin are increased [2]. Conventionally, there are drugs chemotherapeutics that can be used to enhance and protect the liver as there are also substances that can cause this toxicity noted in the liver, substances that help protect the liver are generally referred to as hepato-protective drugs [3].
Conditions of toxicity to the liver no matter the cause render the liver which is the most important organ for detoxification of foreign substances unable to effectively carry out these activities and hence leading to several other problems [4]. More than 1000 drugs have been associated with hepatotoxicity and drug-induced liver injury (DILI). Moreover, drug-induced hepatotoxicity contributes to more than half of the cases of acute liver failure. In Sweden for instance, hepatic injury due to drugs occurred in 2.3% of patients hospitalized for jaundice, the case is not different but rather worse in Africa and Nigeria where drug abuse is basically unchecked as noted by the WHO in 2010 [5]. However, the real incidence of DILI remains unknown because of the difficulty in establishing diagnosis and the low reporting frequency to the pharmaco-vigilant authorities [6]. DILI represents a clinical challenge due to the large number of reported hepatotoxic drugs in current use, the broad spectrum of hepatic injuries by which it may manifest and the frequent absence of clinical findings that permit its diagnosis with certainty. Delay in the diagnosis of DILI may result in unnecessary extensive investigations and poor patient outcomes including acute liver failure and cirrhosis.
Broad spectrum antibiotics have received widespread acceptance since their entry in to clinical application due to their broad spectrum activity in the treatment of microbial infections [7]. The use of broad spectrum antibiotics across the globe is on the rise as well as the self-medication encountered in use of drugs and antibiotics especially in Nigeria and most parts of developing Africa where anybody can walk up to the counter and pick up a drug without a prescription, the use of these antibiotics has increased especially without prescriptions and so has cases of toxicity of various kinds and order [8]. The main aim of this study is to evaluate the extent of hepatotoxicity, if any, that is caused by a prolonged use of broad spectrum antibiotics Amoxicillin and Ciprofloxacin in albino rats [9].
Ciprofloxacin (CIPROTAB) and Amoxicillin (AMOXITAB-500) were obtained from Blessed Pharmacy, Umuahia, Abia state [10].
Twenty four males and females adult wistar albino rats (100g-160g) were obtained from the animal unit of the Department of Veterinary Physiology/Pharmacology/Biochemistry/Animal Health and Production, University of Nigeria, Nsukka. They were fed ad libitum with standard commercial pelleted grower feed (Vital feed, Nigeria) and had free access to clean drinking water. The animals were kept at normal room temperature and environment in accordance with the recommendations of the Guide for the Care and Use of Laboratory animals and allowed two weeks to acclimatize before the commencement of the experiment.
The rats were divided into six groups of four rats per group. The hepatotoxicity activities of both drugs were evaluated after twenty-one days. The groups received the drugs thus:
• Group I: (Negative control) received distilled water throughout the period of the experiment.
• Group II: (Normal-dose Ciprofloxacin) received 7.14mg/kg of Ciprofloxacin for 21 days
• Group III: (Normal-dose Amoxicillin) received 7.14mg/kg of Amoxicillin for 21 days
• Group IV: (High-dose Ciprofloxacin) received 14.28mg/kg of Ciprofloxacin for 21 days
• Group V: (High-dose Amoxicillin) received 14.28mg/kg of Amoxicillin for 21 days
• Group VI: (Combined dose) received 7.14 mg/kg each of both drugs for 21days
The hepato-toxicity activity of the drugs was evaluated biochemically. All rats were fasted for 24 hours after last administration and sacrificed. Blood samples were collected via ocular puncture and allowed to stand for 15 minutes before it was centrifuged at 3000 rpm for 10 minutes and serum collected for tests [11-14].
A representative of each group was dissected and the liver collected and preserved with formalin in plain sample bottles for histopathology examination
Alanine aminotransferase (ALT) was determined according to the method of Reitman and Frankel, 1957 using Randox commercial kits and following procedures outlined by the commercial kit producer, Randox Laboratories Limited, UK. Two test tubes were set up in a test tube rack and labelled blank and test and 0.1ml of the sample (test serum) was introduced into the test tube while 0.1ml of distilled water was pipetted into the blank test tube. 0.5ml of ALT reagent R1was then introduced into each of the tubes and mixed. The mixture was incubated for 30 minutes at 37 °C before the addition of 0.5ml of reagent R2to each of the tubes and also incubated at 20-25 °C for 20 minutes. 5ml of Sodium Hydroxide was added to each tube and allowed to stand for 5 minutes before absorbance was read against the reagent blank on a spectrophotometer (722N, Mindray, India) at 500nm. ALT activity in the serum was obtained by tracing the equivalent absorbance of the sample on the ALT absorbance chart and finding its corresponding ALT activity value in U/I.
Commercial kits were used and standard procedures prescribed by the producer Randox Laboratories Limited, U.K were adopted. A blank test tube containing 0.1ml of distilled water was set up. A second test tube labelled “test” was made to contain 0.1ml of the test sample. AST reagent R1(0.5ml) was added to each test tube, mixed and incubated at 37 °C for 30 minutes. After the incubation, 0.5ml of AST reagent R2 was added to each test tube and allowed to stand for 20 minutes at 20-25 °C before 5.0ml of 0.4mol/ Liter NaOH was added to each and also allowed to stand for 5 minutes before reading absorbance against the reagent blank on a spectrophotometer (722N, Mindray India) at wavelength 546nm. AST activity in the serum was then obtained by finding an equivalent value of absorbance on the standard chart and obtaining its corresponding activity value in U/L [15].
Alkaline phosphatase (ALP) Activity was determined according to the method of King and Kind, 1957 using ALP commercial kits and following standard procedures outlined by the producer Teco Diagnostic, U.S.A. Three test tubes were set up and labeled test, control and standard respectively into which 0.5ml of Alkaline phosphatase substrate was added. 0.05ml (50μl) of the standard, control and sample (test serum) were added to the corresponding test tubes while distilled water was used for the control. The test tubes were incubated for 10 minutes at 37 °C before adding 2.5ml of alkaline phosphate coloured developer at timed intervals. The mixtures were properly mixed before reading absorbance on a spectrophotometer at 590nm after zeroing with the reagent blank.
ALP value in IU/Liter will be calculated using the formula:
Colorimetric method based on that described by Jandrassik and Grof (1938). Direct (conjugated) bilirubin reacts with diazotized sulphanlic acid in alkaline medium to form a blue colored complex. Total bilirubin is determined by then reacting with diazotized sulphanlic acid.
Serum bilirubin content was estimated using commercial kits and following standard protocols prescribed by the producer Randox Laboratories Limited, U.K. Two test tubes were set up and labeled blank and sample. To the sample test tube, 200μl of Reagent 1 (0.17N hydrochloric acid), 50μl of Reagent 2 (38.5mmol/L of sodium Nitrite) and 1000nl of Reagent 3 (0.52mmol/L sodium benzoate) were added and mixed properly while only 200ml of Reagent 1 and 1000nl of reagent R3 were added to the blank test tube. The 2 test tubes were then incubated at 20-25 °C for 10 minutes, after which 100μl of reagent 4 (1.9N sodium Hydroxide) was added to both test tubes. The test tubes were incubated for a further 30 minutes at 25 °C before reading absorbance on a spectrophotometer at 560nm after zeroing with blank. To obtain total bilirubin concentration in mg/dl the formular below was used.
Total Bilurubin = 10.8 x Absorbance of Sample
Direct biuret method. Total serum protein was estimated using commercial kits and following standard protocols prescribed by the producer Randox Laboratories Limited, U.K. Two test tubes were set up and labeled blank and sample. To the sample test tube, 500ml of Reagent 1, 0.5ml of Reagent 2 were added and mixed properly while only 0.5ml and 0.01ml distilled water added to the blank test tube. The 2 test tubes were then incubated at 20-25 °C for 10 minutes. Then reading absorbance on a spectrophotometer at 560nm after zeroing with blank.
Total Protein conc. = 190 x sample
The surviving experimental animals were humanely sacrificed at the end of the study. Gross lesions were recorded as observed during the post mortem examination. Sections of the liver were collected for histopathological examination. They were fixed in 10% phosphate buffered formalin for a minimum of 48 hours. The tissues were subsequently trimmed, dehydrated in 4 grades of alcohol (70%, 80%, 90% and absolute alcohol), cleared in 3 grades of xylene and embedded in molten wax. On solidifying, the blocks were cut into 5μm thick tissue sections using a rotary microtome, floated in water bathe and incubated at 60 °C for 30 minutes. The 5μm thick sectioned tissues were subsequently cleared in 3 grades of xylene and rehydrated in 3 grades of alcohol (90%, 80% and 70%). The sections were then stained with Hematoxylin for 15 minutes. Blueing was done with ammonium chloride. Differentiation was done with 1% acid alcohol before counterstaining with Eosin. Permanent mounts were made on degreased glass slides using a mountant; DPX.
The prepared slides were examined with a Motic™ compound light microscope using x4, x10 and x40 objective lenses. The photomicrographs were taken using a Motic™ 9.0 megapixels microscope camera at x160 and x400 magnifications.
The data was expressed as mean ± SEM. The data were statistically analysed using one way analysis of variance (ANOVA). Data from the test groups were compared with their respective controls and differences were considered significant at p<0.05 (Table 1).
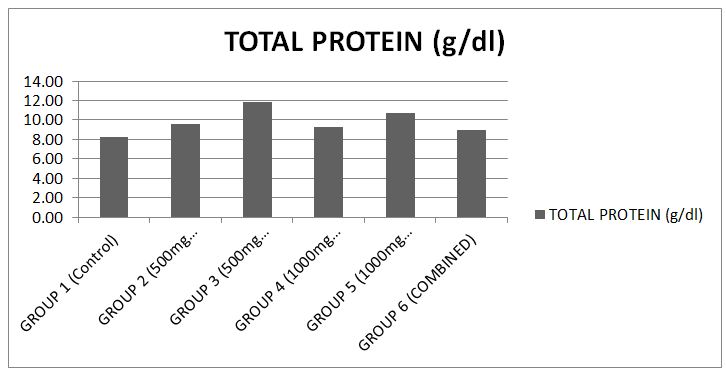
The results showed that there was significance difference (p<0.05) in the serum total protein level when compared to the control [17] (Chart 1).
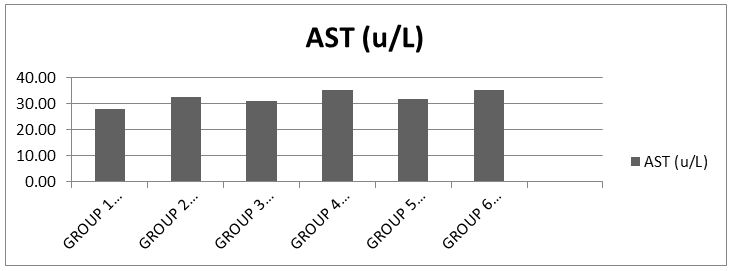
The results showed that there was significance difference (p<0.05) in the serum AST level when compared to the control [18] (Chart 2).
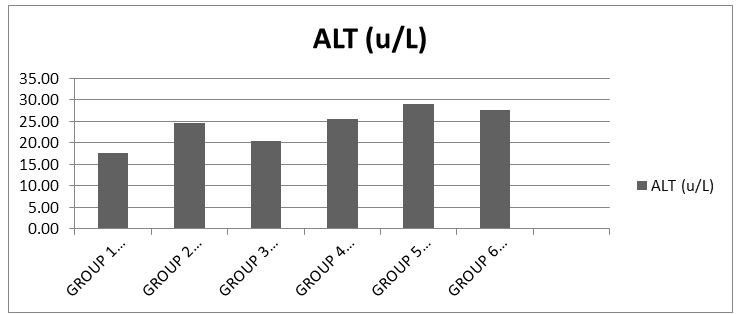
The results showed that there was significance difference (p<0.05) in the serum ALT level when compared to the control [19] (Chart 3).
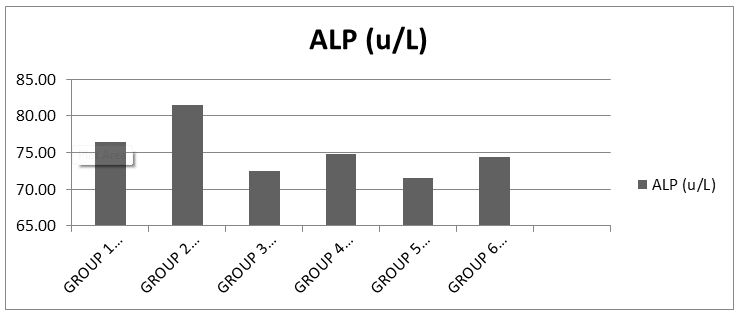
The results showed that there was no significant difference (p>0.05) in the serum ALP level when compared to the control (Chart 4).
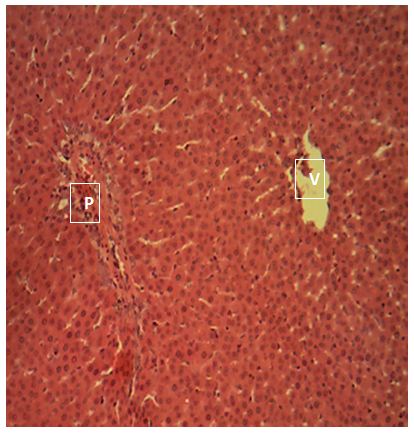
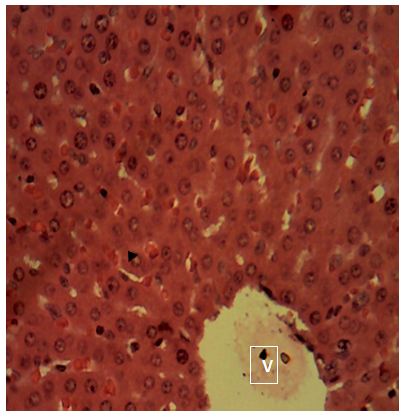
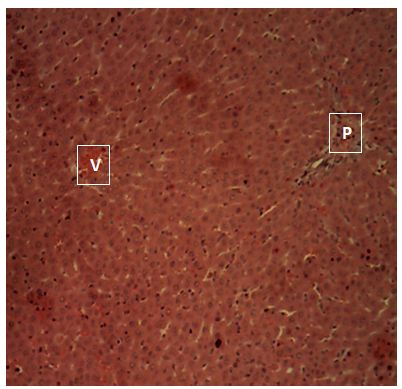
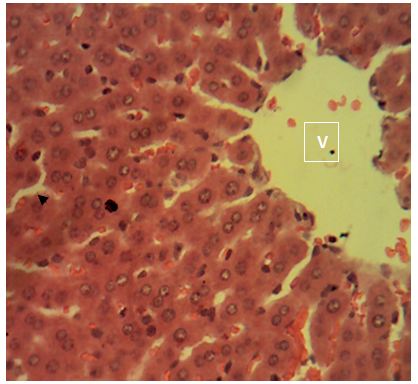
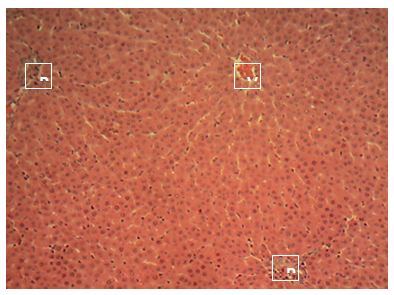
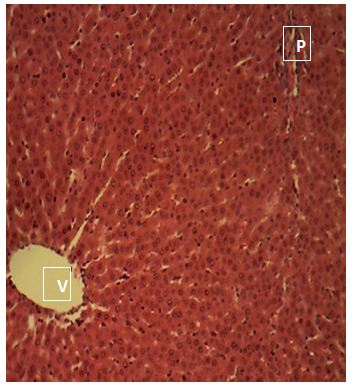
Sections of the liver collected from Groups 1, 3, 4 and 5 showed the normal features of the hepatic histomorphology for laboratory rats. Normal hepatic lobules, with normal hepatocytes arranged in interconnecting cords around the central veins were observed. The cords are separated from each other by the hepatic sinusoids and radiate towards the periphery of the hepatic lobules where they make contact with the components of the portal areas (Hepatic artery, Hepatic vein and Bile duct) suspended in connective tissue matrix (Figure 1,Figure 2,Figure 3,Figure 4,Figure 5,Figure 6,Figure 7,Figure 8,Figure 9,Figure 10,Figure 11 and Figure 12).
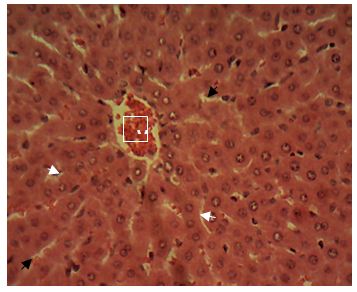
Central vein (V); Portal area (P); Hepatic cords (white arrow); Sinusoid (black arrow). H&E x 160; x400
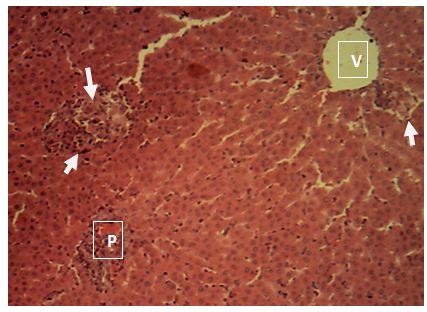
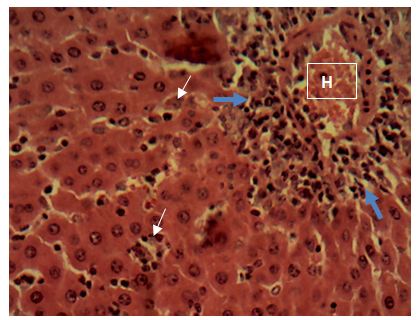
sinusoids. Sections of the liver collected from the experimental animals in Group 4 showed random multifocal areas of coagulative necrosis (white arrow) with infiltration of mononuclear phagocytes
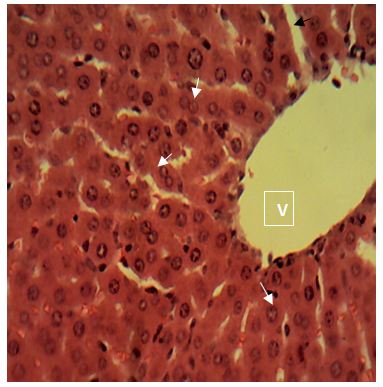
Central vein (V); Components of the Portal area [hepatic artery (HA); hepatic vein (HV0; bile duct (BD); Hepatic cords (black arrow). H&E x160; x400.
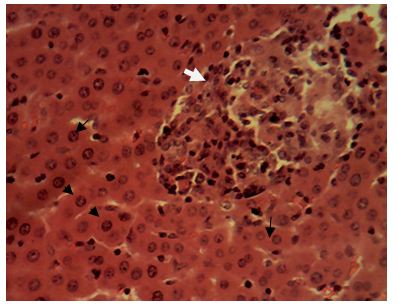
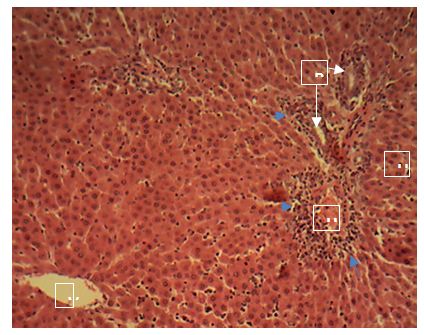
Sections of the liver collected from the experimental animals in Group 6 showed a widespread, random, individual hepato-cellular necrosis (white arrow). Also, a severe infiltration of inflammatory cells around the portal areas were observed (blue arrow)
Central vein (V); Portal area (P); Hepatic cords (black arrow). H&E x160; x400.
The present study evaluated the hepatotoxicity activity of broad spectrum antibiotics (Amoxicillin and Ciprofloxaxin) after prolonged use on laboratory albino rats for period of twenty-one (21) days as a measure of chronic toxicity. The broad spectrum antibiotics employed for this study were Ciprofloxacin 500mg, oral tablets and Amoxicillin 500mg capsules.
The hepatotoxic effect of ciprofloxacin as reported could be due to oxidative stress induced in the liver by ciprofloxacin through the generation of oxidative radicals leading to depletion of protein content in hepatocytes as a consequence of nucleic acids diminution and DNA damage that of amoxicillin and other b-lactams have not been fully studied but is believed to be for same reasons for their hepatotoxicity effect [20,21].
The total protein analysis carried out on the serum revealed some significant difference (P>0.05) in protein concentration between the test groups and the control. This suggests that the chemical constituents of the drug at the doses administered may not influence the rate of protein synthesis and degradation. This report is not different from that which has been presented by Douglas, et al, (2010) and Agbafor, et al. (2015) when the albino rats were treated with ofloxacin and ciprofloxacin antibiotic drugs.
The level of albumin, fibrinogen, globulin and other proteins that are synthesized by hepatocytes are usually decreased in extensive liver damage. In the total protein, when compared with the control, the animals in groups 2 and 3 showed relatively normal levels of the enzyme, indicative of no alteration to the liver cells. Also animals in all other groups showed slightly elevated levels of total protein which is still indicative of normal liver function.
The increase levels of liver enzymes ALT, AST, ALP are important indices for hepatic damage. Alanine aminotransferase activity is related to liver functioning and is measured by monitoring the concentration of pyruvate hydrozone formed with 2, 4-dinitrophenylhydrazine. The results obtained when compared with the control showed that groups 2 and 4 had much elevated levels of serum ALT and indication possible leakage of enzyme from the hepatocytes. While group 3 which received 500mg of amoxicillin showed considerable elevation against the control group. Group 5 which received 1000mg of amoxicillin and group 6 the synergy evaluation group showed highly elevated levels of ALT in serum, a marker of more severe leak.
AST is measured by monitoring the concentration of oxaloacetate formed with 2,4-dinitrophenylhydrazine. The results showed when compared with the control that groups 2 and 3 which received 500mg ciprofloxacin and amoxicillin respectively slightly elevated the serum activity of AST, showing that at normal dose, both drugs could cause same effect. The groups 4 and 5 which received 1000mg each of ciprofloxacin and amoxicillin respectively showed also mild to slightly severe elevation of activity of the enzyme in the serum, it can be deduced that the double dose of both drugs can cause this same effect. However, the synergy evaluation group 6 showed much higher elevation when compared with the control, it shows that in synergistic administration of both drugs at otherwise normal doses (500mg) mild to severe leakage of AST into the blood is observed, indicative of some sort of toxicity.
The results obtained from this analysis shows normal serum levels of ALP across all groups when compared with the control.
The level of bilirubin, a metabolic breakdown product of heme, is known to increase in hemolysis, disease of hepatocytes and obstruction to biliary excretion into duodenum. The results obtained showed normal levels across all groups when compared with the control group, indicative of no severe injury to the liver cells [23].
The histological examination images showed mild and slightly severe liver injury in groups 4 and group 6. Sections of the liver collected from the experimental animals in Group 4 showed random multifocal areas of coagulative necrosis with infiltration of mononuclear phagocytes. Sections of the liver collected from the experimental animals in Group 6 showed a widespread, random, individual hepatocellular necrosis. Also, a severe infiltration of inflammatory cells around the portal areas were observed. This result correlates with that reported in human samples treated with amoxicillin, central zone necrosis with neocholangiogenesis and mild portal inflammation, portal infiltrates of lymphocytes and eosinophils [17]. Adjacent hepatocytes show ballooning degeneration and cholestasis. Groups treated with 500mg of amoxicillin and 500mg of ciprofloxacin showed mild alterations to hepatocytes.
The groups 2, 3 and 5 showed the normal features of the hepatic histomorphology for laboratory rats. Normal hepatic lobules, with normal hepatocytes arranged in interconnecting cords around the central veins. The cords are separated from each other by the hepatic sinusoids and radiate towards the periphery of the hepatic lobules where they make contact with the components of the portal areas (Hepatic artery, Hepatic vein and Bile duct) suspended in connective tissue matrix, this showed that even though there might be differences in enzyme activity of the test animals, there is no considerable damage to the liver tissues, this is supported by [15,23].
Ciprofloxacin and amoxicillin at normal doses have considerably low levels of hepatotoxicity; however, the administration of the drugs at double the normal doses may lead to liver toxicity. The synergistic administration of the drugs has greater possibility of hepatotoxicity. Hence, the hepatotoxicity activity of both drugs independently both at high and normal doses is generally considered slight in the light of the hepatotoxicity caused by their synergistic use after prolonged use.