High Signal Intensity in the Dentate Nucleus on Unenhanced T1-Weighted MR Images in Melanoma Patients Receiving Macrocyclic Gadolinium-Based Contrast
Objectives: The aim of the study is to evaluate possible gadolinium brain deposits on Magnetic Resonance Images (MRI), in patients with localized melanoma receiving repeated doses of a gadolinium based contrast agent (GBCA).
Material and Methods: The present study is a single-centre retrospective review of MRI studies performed between January 2013 and December 2016. A total of 44 patients were evaluated. Four radiologists conducted a blinded visual evaluation and quantitative analysis on unenhanced T1-weighted MR images by using regions of interest (ROIs) on the dentate nucleus. The contrast agent used in all cases was the macrocyclic GBCAs gadobutrol.
Results: In the qualitative analysis among the 315 T1W series, 27 were classified as “visible”. 8.6% of the series evaluated and 36.4% of patients showed at some point during follow-up high signal intensity in the dentate nucleus. An association between “visible” and the number of visits was not found, OR=0.9, CI95%: 0.77–1.05. No significant statistical association was found between the dose and the ratio. However the mean of the ratio was significantly higher in the “visible” group (p=0.024).
Conclusions: In our cohort of patients who had received macrocyclic-chelated gadolinium an increase in SI can be seen in the dentate nucleus.
Keywords: Gadolinium; Cerebellar Nuclei; Contrast Media; Magnetic Resonance Imaging; Brain
List of abbreviations: GBCA: Gadolinium-based Contrast Agents; SI: Signal-intensity; T1W: T1-Weighted; T2W: T2-Weighted; FLAIR: Fluid-attenuated Inversion Recovery; FOV: Field of View; MRI: Magnetic Resonance Imaging; GD: Gadolinium; FA: Flip Angle; TR: Repetition Time; TE: Echo Time
Contrast-enhanced MRI is a routine imaging study for patients with skin melanoma, to rule out brain metastasis in their follow up. The contrast agent used for those studies is a paramagnetic gadolinium-based molecule. Gadolinium (Gd) is a heavy metal that belongs to the lanthanide family.
Gadolinium-based contrast agents (GBCAs) fall into two classes, depending on their chemical structure: linear, with an open chain, and macrocyclic, with a closed structure.
In 2014, a study by Kanda et al. showed that the injection of GBCAs correlates with an increase in SI in the dentate nucleus and globus pallidus on unenhanced T1Weighted Magnetic Resonance Images (MRI) in patients that had previously received GBCAs [1]. Further studies by Kanda et al. and McDonald et al. in the brains of deceased patients provided evidence that increased intensity correlates with gadolinium deposits in brain [2,3].
Subsequent retrospective studies in patients and animal models have evaluated the deposition of gadolinium in the brain. This effect has been reported to be greater for linear GBCAs than for macrocyclic GBCAs.
These studies have shown that increased signal may be related to the stability of the gadolinium molecule, and is found more often in linear contrast agents, where the molecule is less stable than in macrocyclic contrast agents, where the molecule is more stable. Both linear and macrocyclic GBCAs have different thermodynamic and kinetic complex stabilities with a higher risk of release of the Gd3+ at physiological conditions upon linear GBCAs than upon macrocyclic agents.
We investigated patients with melanoma who had received cumulative doses of macrocyclic GBCA. We found an increased in signal intensity on unenhanced T1W images in the dentate nucleus in more than half of the patients evaluated.
The present study is a single-centre retrospective review of MRI studies performed at our institution between January 2013 and December 2016 in a group of patients with localized primary melanoma (Stage I, II, III) who had received cumulative doses of a GBCA during the follow up of their disease.
The medical ethics committee of our institution approved this retrospective study, with a waiver of written informed consent from the patients. Written informed consent for this study was waived because of the retrospective nature of the study. All patients had given consent to use their imaging data at the time of examination.
A total of 44 patients with low stage melanoma were evaluated. Patients underwent between 4 and 10 contrast-enhanced MRI studies, with an average interval of 6 months between administrations.
A total of 321 T1W series were evaluated. 315 T1W series were included in the analysis; the series obtained up to a maximum of 8 doses were evaluated (mean accumulated dose 64mL GBCA). The number of patients receiving more than 8 doses was very small so the series following the eight doses were discarded from the statistical analysis.
Baseline T1W images were acquired in the first visit with no previous exposure to gadolinium.
We confirmed from medical records that the subjects’ hepatic and renal function and creatinine levels had been recorded. We assessed the type and amount of administered GBCA as well as the time interval between MRI studies. The treatment received was also registered.
Exclusion criteria were subjects in which gadolinium was administered outside our institution, we excluded all patients who had had a prior MR study in another hospital, patients who had received gadolinium to evaluate other body regions apart from the brain (abdomen, pelvis, head and neck, chest), subjects with a PET-CT performed during follow-up to avoid the possibility of other external agents administered that may interfere with the gadolinium distribution and patients who developed brain metastasis over the follow-up period.
The studies were performed using four MR units, three 1.5 Tesla (Symphony Siemens, Aera Siemens, HX GE) and one 3.0 Tesla (Trio Siemens). T1W SE sequences were used for the analysis. TR ranged between 400-500msec, TE between 10-15 msec in the 1.5T units and 2.65ms in the 3Tesla unit, FA 90º, thickness 5mm, matrix size (224x352)-(420x448), and FOV 240x240mm. A phased array 8 channels and a quadrature coils were used for the studies.
The contrast agent used in all cases was the macrocyclic GBCAs gadobutrol (Gadovist; Bayer Schering Pharma), with an injected dose of 0.1 mmol/kg.
Four radiologists (three junior (JM,NB,JCS),and one experienced neuroradiologist (LO), who were all blinded to details of contrast administration, conducted a visual evaluation and quantitative analysis on unenhanced T1-weighted MR images from the picture archiving and communication system (PACS).
Imaging sets were anonymously and randomly assigned to each of the readers. The readers were not aware of the name or the order of the MRI in the series of follow up images they received. All the observers evaluated all the images.
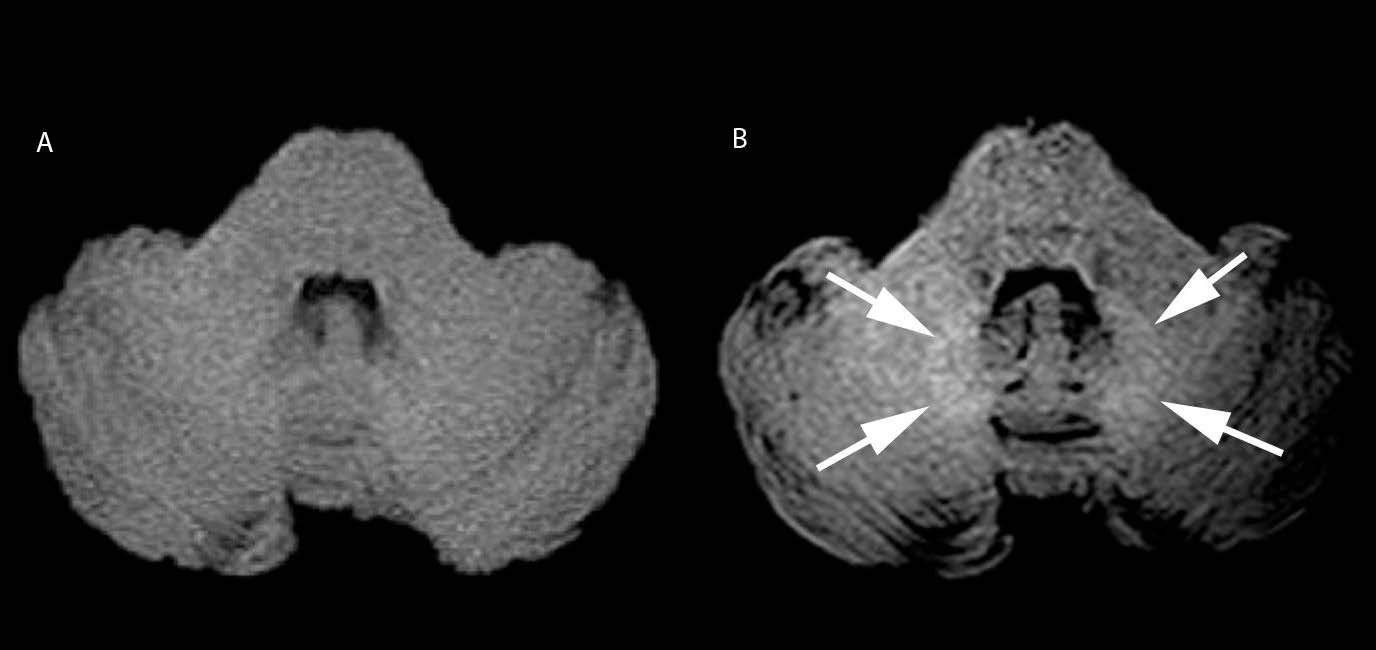
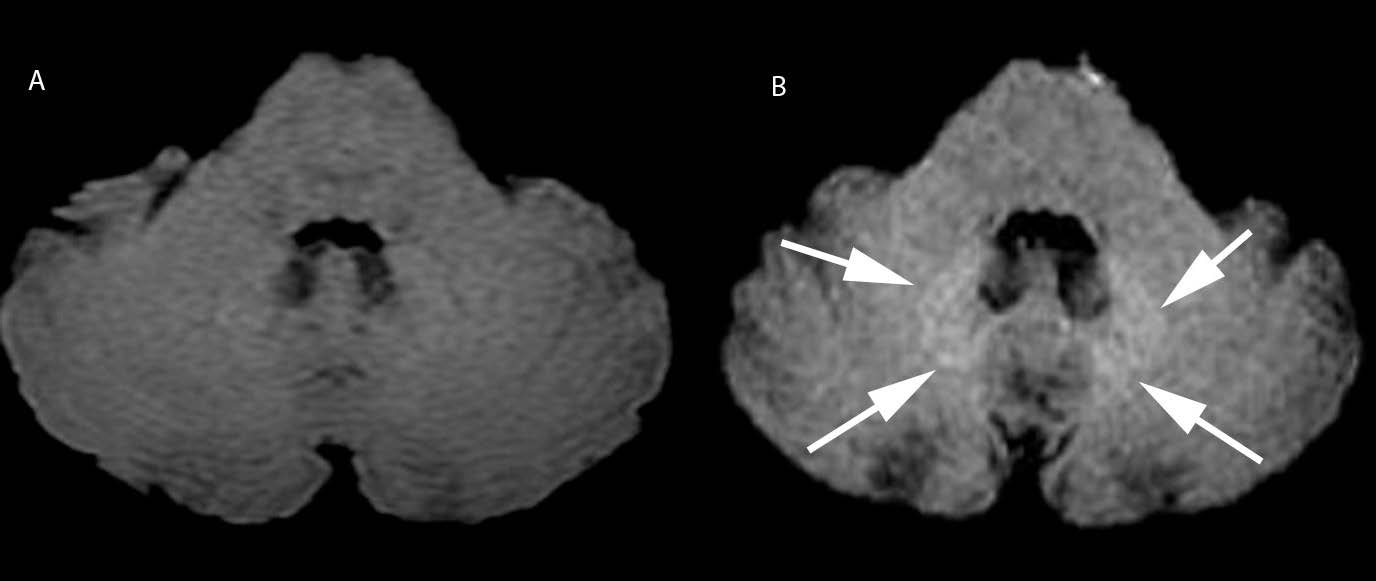
For the qualitative analysis, a visible or non-visible high signal in the dentate nuclei, in comparison with the pons, was assessed in all the imaging sets.
The signal intensity (SI) quantitative analysis was performed using oval regions of interest (ROIs), positioned on the unenhanced SE T1W images on the right dentate nucleus, as far as possible from pulsating vessels and on the central pons. When assessment of the right side was difficult due to the presence of artefacts, the left side was used instead.
T2W or FLAIR images were used to ensure the correct identification of the dentate nucleus, for correlation with ROIs then placed on the corresponding T1W image. In doubtful cases the final decision was obtained by consensus.
The ratio was obtained dividing the mean SI of the dentate nucleus by that of the pons.
The signal intensity ratios were recorded in each of the follow-up studies to evaluate the correlation with successive doses of gadolinium.
Qualitative variables were described using counts and percentages. Mean and standard deviation were used for quantitative variables.
The probability of “visible” was estimated and compared between observers by fitting a logistic regression estimated by GEE approach. Akaike’s information criterion and z-score test were applied to select models and to test the significance of effects.
Concordance among observers was assessed by Cohen’s kappa and intraclass kappa indexes. A linear mixed model with longitudinal correlation was fitted to assess the evolution of the “ratio” over doses. Likelihood ratio test was applied to test the significance of the trend.
Kaplan-Meier approach was used to estimate the survival curve related to the first “visible” event. The significance level for the hypotheses testing was set to 5%.
All our patients had a normal renal and hepatic function. None of them had received any systemic treatment apart from interferon, nor chemotherapy or radiotherapy.
Mean age was 58.34 ± 14.64 years old, 23 men and 21 women. Average weight 77.29 ± 17.17.
63.6% of the patients (28) hold seven visits to the dermatology clinic; at this point in time they have received six doses of gadolinium (accumulated dose 48mL GBCA) (Table 1).
None of the baseline T1W images were classified as visible.
8.6% of the series evaluated and 36.4% of patients showed at different points in time during follow-up high signal intensity in the dentate nucleus.
In the qualitative analysis among the 315 T1W series, 27 were classified as “visible”.
All imaging sets were used to assess interrater concordance. The interrater reliability was high in some visits, with kappa values close to 1, the overall reliability was 0.675 CI95% 0.62 – 0.72 %. Nevertheless, this is not sufficient to consider the observers interchangeable (Table 2).
No association was found between “visible” and the number of visits OR=0.9, CI95%: 0.77–1.05.
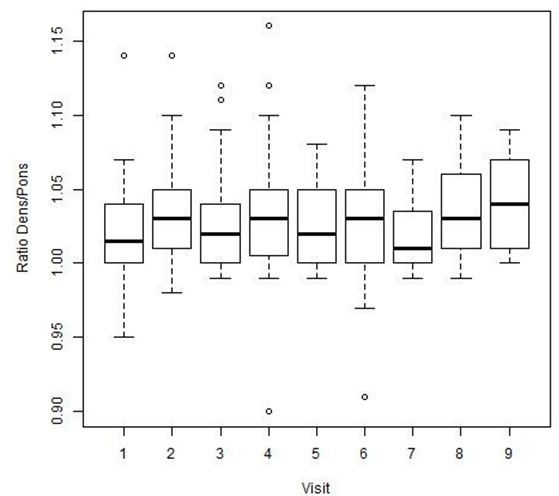
The results of the quantitative analysis of the dens/pons SI ratio are summarized in, showing the ratios for the 9 time points ( Figure 1).
No significant statistical association was found between the dose and the ratio. However the mean of the ratio was significantly higher in the “visible” group (p=0.024 ( Figure 2).
The 27 “visible” cases came from all four of the MR units used, evenly distributed ( Figure 3 and 4).
There are multiple reports in the literature describing deposits and the differences between linear and macrocyclic GBCAs in the dentate and deep grey nuclei in clinical and animal models studies [2-4]. There is an extended literature published by Kanda, McDonald, Quattrocchi and Radbruch showing and emphasising different aspects of brain gadolinium deposits [5,6].
There have been publications in animal models demonstrating residual gadolinium in the rat brain after repeated administration of linear GBCAs in three forms: soluble small molecules, soluble macromolecules, and an insoluble form. The Gd concentrations in the brain after multiple doses of macrocyclic GBCAs are lower, and the Gd is only present in soluble small molecules, which were slowly excreted [7].
In our study reviewing patients with melanoma in whom cumulative doses of macrocyclic GBCA were administered. We found increased signal intensity on unenhanced T1W images in the dentate nucleus in more than half of the patients after an accumulated dose of 48mL GBCA.
We chose to examine a group of low-stage melanoma patients for possible deposit of a macrocyclic GBCA in the brain. As the identification of metastasis of melanoma requires regular brain MR follow-up studies with contrast (8), this group offers a homogeneous population that can be analysed over an extended period of time, allowing evaluating the possible gadolinium deposition after multiple doses [8].
We found a visible increase in SI in the dentate nuclei at some point during follow-up in 36.4% of the patients analysed.
The ratio dens/pons on unenhanced T1W MR Images was higher in the patients in whom we saw an increase in SI. However there was no statistically significant association with the dose.
In some patients we found a decreased SI ratio in later studies although the total cumulative dose of gadolinium they had received was higher. We hypothesize that this could be related to the technical differences in the field strength and the MRI parameters used for the studies and the absence of normalization of the SI values of the dentate nucleus against the SI of the CSF. We do not think the time interval between studies and a wash out effect contributes to this SI decrease, since it was kept constant; every 6 months in all patients.
Radbruch et al. have referred to, a “washout effect” over time in a recent publication. They found a decrease in SI over time in follow-up examinations performed with macrocyclic GBCAs in patients with an initial SI related to the use of a linear GBCA. They hypothesize that there may be four mechanisms that can explain the SI dens/pons decrease: a “washout effect” over time; a precipitation of the originally bound soluble gadolinium; the elimination of part of the gadolinium through excess ligands; and a SI increase in the pons [9]. We did not investigate this specific aspect in our work but we did find some cases in which the high signal intensity was found in one visit and not visible in later visits, although since the studies were not performed in the same MR unit and the sequence parameters change between equipment used we cannot attribute this effect to the washout effect in our data.
Stojanov et al. were one of the first to show an increase in signal intensity on unenhanced T1W MRI in the dentate nuclei and basal ganglia in patients with multiple sclerosis (MS) who had received repeated doses of a macrocyclic agent (gadobutrol), the same agent used in our group of patients [10].
Eisele et al. studied a group of 22 patients with MS after a minimum 6 injections of the macrocyclic GBCA gadoterate meglumine, but they did not demonstrate an increase in SI in the dentate nuclei [11].
Radbruch et al. and Cao et al. in several publications indicate that serial doses of macrocyclic gadolinium-based contrast are not associated with an increase in SI in the dentate nucleus in adult patients or in children. Schneider et al. had similar results in a group of children who had received multiple injections of gadolinium over a period of 3 years in comparison with a control group [5,6,12-14]. These findings are in contrast to those of Rossi Espagnet et al., who found an increase in SI in the globus pallidus and dentate nucleus after multiple administrations of a macrocyclic gadolinium-based contrast agent in children [15].
There is an interesting article published by Jost et al. that compared several clinically used GBCAs in an animal model. They observed an increase in signal intensity in the cerebrospinal fluid (CSF) on contrast enhanced FLAIR images for all GBCAs, independent of their chemical structure. They postulate that the GBCA passage from the blood into CSF might represent an initial pathway of GBCAs infiltration into the brain. However, a relation between the CSF signal increase and that of the dentate nucleus was not demonstrated [16].
The mechanisms of gadolinium deposition remain poorly understood. The deposits of gadolinium are highest in the dentate and/or deep grey nuclei, regions that are prone to physiologic and pathologic calcification.
Nagawa et al. have demonstrated that gadolinium-chelates might penetrate the brain parenchyma through the CSF and perivascular spaces (PVS) [17]. The PVS is a part of the brain lymphatic system (glymphatic system). The glymphatic system is the brain perivascular pathway that transports low molecular weight materials passively from the CSF to the interstitial fluid and there is a continuous interchange between the CSF and interstitial fluid (ISF) [18,19]. Both linear GBCA and macrocyclic GBCA are transported in the same way. However the association between the signal increase of the dentate nucleus and the GBCAs transported through the glymphatic system is still unclear.
Deposition of Gd in the human body has been documented in several publications. All types of GBCAs tested can deposit in brain as well as in bone and skin tissue [20,21]. It still remains unclear in what form gadolinium deposition (free ionic form, chelated state) occurs, but the most prevalent hypothesis is that the observed SI changes are a result of dechelation and release of the Gd3+ ion from its ligand molecule.
A recent publication by McDonald et al. evidenced neuronal tissue deposition of gadolinium in a group of deceased patients that had been exposed to a linear gadolinium-based contrast [22]. The deposit has been demonstrated within the endothelial walls, and within the cytoplasm of neurons, particularly within the nucleus, with no histologic changes.
Fingerhut et al. have demonstrated in samples obtained in samples of 13 autopsy cases that gadolinium depositions in the brain are restricted to blood vessel walls, while the neuropil is spared and apparent cellular reactions are absent [23,24].
The clinical implication of the gadolinium deposit is still unknown. To date, no clinical signs or symptoms associated with gadolinium deposit in the dentate nuclei have been identified [25]. There are case reports of presumed gadolinium induced neurotoxicity in the literature, published by Maramattom et al. and Hui et al. [26,27].
The aim of our study is to mine our existing data about the SI changes in the brain after serial injections of a macrocyclic GBCAs agent, so that this new evidence can be added to the current debate. Further studies are needed, including control groups, for a more exact assessment of SI changes in the dentate nucleus after several injections of macrocyclic GBCAs.
One of the limitations of a retrospective study is the selection criteria. In our cohort four different units were used, with differing magnetic fields. Also, MRI TR and TE parameters varied between patients and in the same patient throughout the different studies performed over time. SI values of the dentate nucleus against the SI of the CSF were not normalized to account for the difference between sequences and MRI units.
The number of patients included might be considered small but we insisted on strict selection criteria in order to ensure that all patients had only received a macrocyclic agent, had not been exposed to other gadolinium agents, had no brain pathology or nor had undergone a PET-CT study. This has reduced the number of eligible patients. The study lacks a control group.
In our cohort of patients who had received macrocyclic-chelated gadolinium an increase in SI can be seen in the dentate nucleus.
The study has received funding from the Spanish Radiological Society (SERAM02_LOZ_INVESTIGACIÓN_SERAM.FUNDACIÓN_2016).