
Investigation of Structural and Electrical Properties of Manganese Doped ZnO Varistors Prepared from Nanopowders
Non-ohmic properties of pure and doped zinc oxide varistors are widely used to manufacture good devices. These varistors are generally used in electrical or electronic circuits to protect them from voltage surges. In this study, pure and Mn doped ZnO nanopowders have been synthesized by a soft chemistry method, the sol-gel route. The obtained powders after calcination at 500 °C are consolidated and sintered using conventional furnace at 1075 °C for 15 min. The obtained pellets are characterized by: X-ray diffraction, MET. The XRD spectra indicate that pure and Mn doped ZnO powders are solid solution, with an average grain size varying between 36.15 nm to 65.92 nm. The grain size decreases with the increase of Mn concentration except for 5 mol % Mn, where there is an unexpected increase. This is confirmed by MET images. The current-voltage J(E) characteristics show that the breakdown electric field increases with increasing Mn concentration ranging from 1595V/cm to 1901.50V/cm except for the Zn-5% Mn-O varistor, where the non linear coefficient α and breakdown electric field are lower. In general the more the grain size decreases the more the varistor effect and the threshold voltage increase.
Keywords: ZnO; Nanomaterials; Sol-Gel; Nano-powders; Varistors
Nanomaterials have received a great interest in last decades due to their many technological applications, very promising in various fields such as sensors, field-emission transistors, ultraviolet photo-detectors, photovoltaic and biomedical system such as DNA sequence detectors [1]. Among these materials, zinc oxide (ZnO) is considered as one of the most important in varistor behavior because of its excellent non-ohmic properties and a high non-linearity coefficient [2,3]. Varistors based on ZnO have been most extensively studied [4,5]. At the same time researchers have made considerable efforts to develop and investigate new properties in this material for protection against over voltages in electrical network or a power supply. Thus, in the literature, there are varistors based on tin dioxide (SnO2), titanium dioxide (TiO2), strontium titanate (SrTiO3), barium titanate (BaTiO3), tungsten trioxide (WO3) and dioxide of cerium (CeO2) [6-16]. In comparison, varistors based on zinc oxide are more interesting since they present a coefficient of non-linearity α ten times more high. For this reason ZnO became the best choice. To improve the coefficient α and to favor the states of interface, several oxides such as Bi2O3, Pr6O11, SbO3, CoO or MnO are added to ZnO matrix. ZnO nanopowders are synthesized by various techniques, the most widely used at this time is the sol-gel route, because of its low cost one hand, and the good quality of the varistors made with. The origin of the varistor effect is essentially due to the microstructure in one hand, and to the potential barriers of grain boundaries between two ZnO, in another hand [17-19].
The grain boundaries are therefore responsible for the non-linearity because each one of them constitutes a barrier to the passage of the current. Therefore, the size of grains in a varistor determines the number of grain boundaries that the current will encounter on its way and therefore the threshold voltage of the varistor.
The purpose of this study was therefore the investigation of the effect of manganese on the structural, optical and electrical properties of ZnO varistors.
Pure and Mn-doped ZnO nanopowders have been synthesized by the soft chemistry sol-gel technique. Zinc acetate dehydrate (C4H6O4Zn.2H2O) (purity>99%, biochem-Chempharma) is used as starting material and an alcoxide: citric acid (C6H8 O7.H2O) monohydrate is used to keep particles in suspension, monoethanolamine MEA (C2H7NO) and ethylene glycol are used as a stabilizer and solvent, respectively. The dopant source of manganese used is manganese chloride (MnCl3). Then, the obtained solution is stirred at 130 °C for 2h to obtain a homogeneous and transparent solution. Finally and after 24h the solution was calcined at 500 °C for 4h in a furnace.
The obtained powders are characterized by means of several techniques: XRD, using the Cukα (kα = 0.154056 nm) radiation of a BRRUKER AXS, D8 advance X-ray diffract meter, to identify the structure and calculate the grain size, TEM, using an X-Max model transmission electron microscope to identify the morphology and estimate the crystallite size, electrical characteristics J(E), using a high voltage measure unit (KEITHLEY model 237) to calculate the breakdown electric field and non linear coefficient α.
In order to obtain dense varistors with high performance, conventional sintering study was performed. To do that, the obtained powders were pressed into discs of 11mm in diameter and 1.8mm in thickness at a pressure of 2 MPa. Then the pellets were sintered at 1750 °C for 15 min. The size of the final samples was about 10 mm in diameter and 1.6 mm in thickness. Gold contact was deposited on both faces of the pellets of Zn% Mn-O to have ohmic contacts, which are realized by heating at 500 °C for 10 min to remove the organic functions.
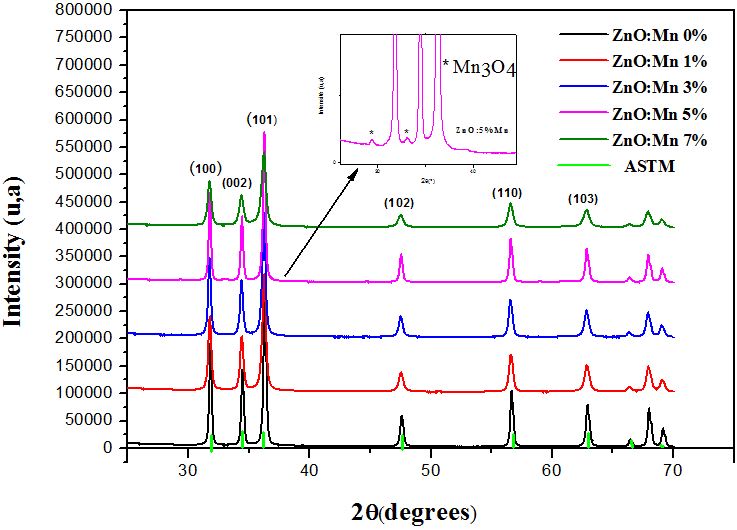
The XRD patterns of Zn1-xMnxO (0≤x≤7) powders synthesized by sol-gel method are shown in Figure 2. The spectra exhibit peaks of the würtzite structure. It is also shown that two peaks were detected at 29.39° and 33.05° only in Zn5%Mn-O corresponding to Mn3O4 phase as identified by Sharma, et al., which reported the presence of secondary phases: ZnMn2O3 or Mn3O4 in the Mn doped ZnO [20].
The average grain sizes were calculated from X-ray line broadening using Scherrer formula (1) [21].

Where D is the grain size, λ the X-ray wave length (λ=1.5418A°), Δθ the full width at half-maximum (FWHM) and θ the Bragg angle.
Lattice parameters a and c of the samples were calculated using the following equation (2):
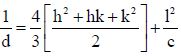
Where a and c are the lattice parameters, d is the interplanar distance and (hkl) are the miller indices
As it is shown in Figure 3 the grain size of Mn doped ZnO nanopowders decreases by increasing Mn concentration and varies from 65.92 nm to 36.15 nm, except for 5% mol Mn, where there is an unexpected increase, the grain size becomes higher (D ≈ 66 nm) because of the appearance of the new phase Mn3O4. However the powders keep the same structure. The values of lattice parameters are listed in Table 1.
The diffraction peaks of the ZnO matrix are slightly shifted towards the small angles after introduction of Mn atoms. It indicates that Mn2+ ions go to Zn2+ sites. The ionic radius of Zn2+ being 0.60 A°, and the one of Mn2+ is 0.66 A°.
In Figure 4, we present TEM images of the pure ZnO and manganese-doped ZnO nanopowders. The images show that the crystallites tend to agglomerate and form aggregating sphere. This tendency has already been reported by Phoka, et al. [22]. Basically, nanoparticles have a natural trend to agglomerate for two main reasons. First, the agglomeration is a more stable configuration from an energetic point of view. Then, nanoparticles tend to agglomerate to allow crystallite growth.
The results presented in Figure 3 indicate that the mean crystallite sizes measured from the TEM images is varying in the same direction than those obtained by XRD. The crystallite size histograms of pure ZnO, 1 mol%, 3 mol%, 5 mol% and 7 mol% manganese-doped nanoparticles are shown in Figure 3. For the doped samples, the crystallite size is between 10 and 80 nm. The manganese doping causes a reduction in the number of crystallites belonging to the size range from 39.4 to 79.87 nm.
However, the sample doped with 5 mol% Mn contains the Mn3O4 phase, whose crystallite size is on average higher than those obtained with the other concentrations. Since it is not possible to distinguish the mechanism of agglomeration of ZnO crystallites from Mn3O4 crystallites on a TEM image, we suggest that our measurements involve crystallites of the Mn3O4 phase because of the larger size of these crystallites.
The plotted electric field as a function of current density for different concentrations is given in Figure 6. The nonlinear coefficient α was obtained by: α=log (I2/I1)/ (V2/V1) where V1 and I1 as well as V2 and I2 are corresponding values of voltage and current for two points that can be chosen arbitrarily in the non-ohmic region [23].
E(J) curves obtained at room temperature for all the samples are shown in Figure 5. We can see clearly two regions: the ohmic region, known as a high resistance region and the non-ohmic one, known as a very low resistance region.
The curves show that the electric field E in the non-linear region increases by increasing Mn concentration, thus E increases with decreasing of grain and particle sizes except for 5 mol% Mn, where E is lower and the grain size higher. However the current density is reduced, particularly for the 5 mol% Mn, because the current is limited to the ohmic resistance. This is in good agreement with XRD and TEM results, and can be explained by the increase of the number of grain boundaries due to the decrease of the grain size average.
Table 2 and Figure 6 show that the non-linear coefficient and the breakdown voltage increase by increasing Mn concentration up to 3mol % Mn and remain nearly constant after that. The Zn-5%Mn-O is still out the expect variation.
For the coefficient α the results can be explained by the fact that this coefficient is due to solid state reactions and the formation of potential barriers between grains [24].
The increase of EB with increasing Mn concentration (from 1595V/cm to 1901.50V/cm except for the Zn-5%Mn-O varistor) and by the fact its increase with decreasing of the grain size of starting powders can be explained by the increase of the number of grain boundaries due to the decrease of the grain size average.
Nanopowders of pure and Mn (1–7%) doped ZnO have been synthesized by Sol–gel technique. The obtained nanopowders have been characterized by means of XRD, TEM and I-V to determine, respectively, their structural characteristics, morphological and electrical properties. The all obtained powders exhibit würtzite structure, where the lattice parameters a and c vary in the same direction. These powders are constituted by very small grains, which size decreases as a function of Mn concentration. On the other hand the manganese doping causes a decrease in the particles size and an increase in varistor effect for the 1, 3 and 7 mol% Mn-doped samples; the breakdown electric field ranges between 1595/cm and 1901.50V/cm and the coefficient of non-linearity (α) between 2.8450 and 13.63. In comparison with previous researches we have recorded higher values of non-linearity coefficient [25].
All samples have a morphology consisting of small nanoparticles, uniformly distributed. From 5 mol% Mn and more, the powders contain a Mn3O4 secondary phase formed at grain boundaries, which is not suitable for a use as varistor. This study shows that 7 mol% Mn doped ZnO varistor has the best electrical properties.

.JPG)
.JPG)
.JPG)
.JPG)
.JPG)
.JPG)