Is a pH of 6.7 for 8 Hours Survivable?
A 72 year female presented with severe lactic acidosis, profound hypotension and hypothermia, evidence of myocardial ischemia profound anemia, and advanced renal failure. Due to the need for transfer to another facility for advanced intensive care and initiation of dialysis, her treatment was delayed and she had an average pH of 6.7 for a minimum of 8 hours after presentation. Her acidosis was felt to be related to metformin use. Despite circumstances which would usually result in a very grave prognosis, she not only survived and was able to discontinue dialysis, but was discharged to her own home within ten days of presentation.
Keywords: Dialysis; Metabolic Acidosis; Metformin; Acute Kidney Injury
A 72 y/o female presented to the emergency department in extremis via EMS after her son-in-law found her at home with a decreased level of consciousness. She had reportedly been experiencing nausea, vomiting, diarrhea for approximately 1 week prior to presentation. Her past medical history included hypertension and type 2 diabetes for which she was prescribed ramipril 5mg PO daily and metformin 1000mg PO BID accordingly. She was compliant with these medications up until 24 hours prior to presentation. She had no known history of kidney disease or proteinuria. Upon arrival to the emergency department, the patient’s temperature was 32 degrees Celcius (89.6 degrees Fahrenheit), blood pressure was 69/41, and heart rate was 110 beats per minute. On physical exam, she was somnolent and in no acute distress. She had no focal neurological deficits, a normal cardio-respiratory exam, a normal abdominal exam, and a skin exam consistent only with severe dehydration [1,2].
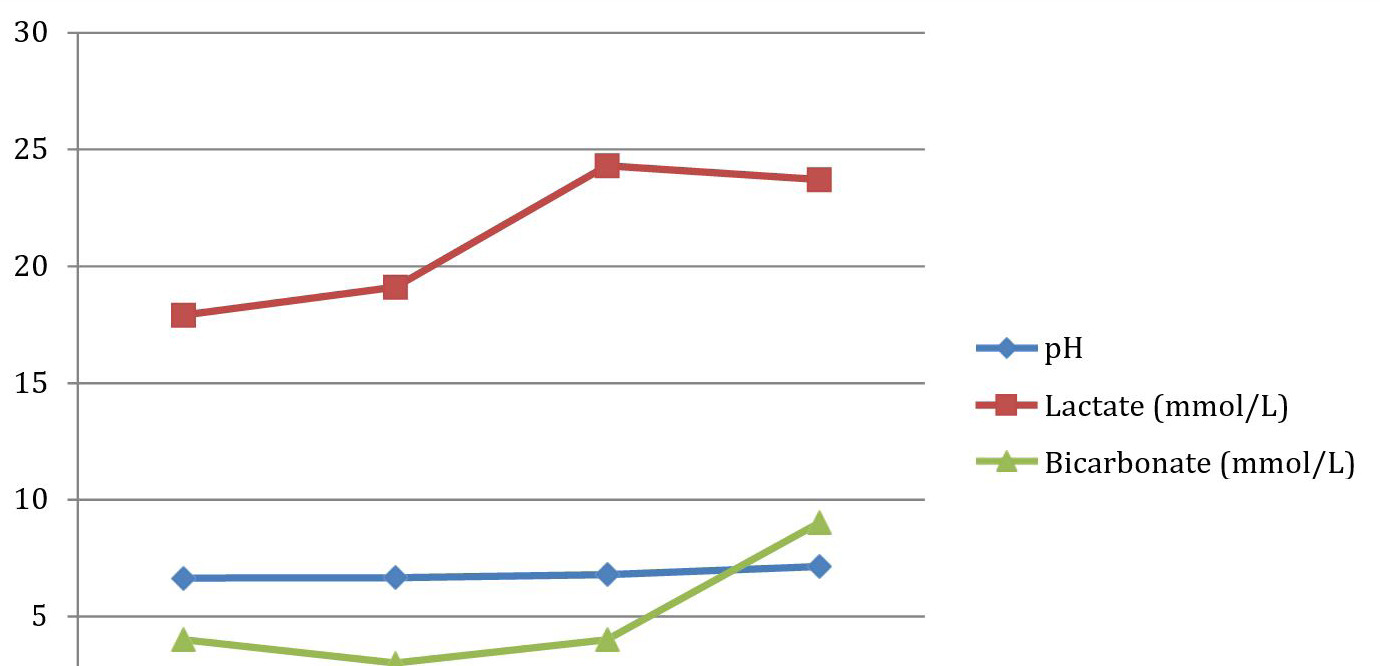
Laboratory studies showed an initial venous pH of 6.65, a bicarbonate level of 4 mmol/L, creatinine of 534 umol/L, potassium of 6.2, Hemoglobin of 58 g/L, white blood cell count of 14.2, troponin of 3.79 ug/L, and a lactate of 17.9 mmol/L. Her CK level was only 555 umol/L. No acute EKG changes were noted. The patient was intubated for airway protection and resuscitated with 5L of crystalloid but continued to experience refractory hypotension. A central venous catheter was inserted and vasopressors were initiated, rapidly escalating the doses to norepinephrine at 0.3 mcg/kg/min, epinephrine at 0.3 mcg/kg/min, and vasopressin at 0.04 units per minute. A bicarbonate infusion of 150 mmol/L in 1000mL of 5% Dextrose was initiated at 300 mL/h. The patient was also treated with broad- spectrum antibiotics as well as stress dose steroids, given her refractory shock. A MAP of 65 mmHg was unable to be obtained despite all resuscitative efforts [3].
Approximately 5 hours after initial presentation, the pH was 6.66, the lactate increased to 24.3 mmol/L and the patient was anuric. More than 8 hours after presentation her pH remained 6.79 and her average venous gas pH over an 8 hour period was 6.7. She required transfer to another facility for advanced supportive care andInitiation of dialysis, which delayed definitive intervention. Upon arrival to the accepting facility, the nephrology service was consulted for CRRT in the setting of refractory metabolic acidosis. A dialysis catheter was emergently placed and CRRT initiated with an immediate improvement in the patient’s clinical picture and vasopressor requirements. The metabolic acidosis was corrected, vasopressors weaned, and the patient extubated approximately 48 hours after admission. She had no hematochezia or hematemesis; however her stools were positive for OB. She had an upper endoscopy that showed Barrett’s esophagus, and outpatient colonoscopy was planned after discharge, but no acute bleeding was identified during her admission. The patient was discharged home from the hospital in stable condition, 10 days after admission. Diagnostic workup excluded sepsis, toxic alcohol ingestion, and ischemic colitis as etiologies for this case of refractory metabolic acidosis and renal failure. It is hypothesized that severe dehydration secondary to nausea and vomiting in conjunction with ongoing administration of an ACE inhibitor and a biguanide was the catalyst leading to this case of refractory metabolic acidosis and vasodilatory shock [4-13].
Extremes of pH, from a physiologic and medical perspective, are not compatible with life sustaining cellular function. Severe acidosis with significantly elevated lactate levels can carry a very high mortality rate.
Lactic acidosis occurs in states of increased anaerobic metabolism as a result of either global hypoperfusion such as cardiogenic shock or sepsis (Type A) or local hypoperfusion and oxygen deficit. This can also be drug-related as is the case with metformin induced lactic acidosis (MAHA).
We are not aware of any cases where there has been such a prolonged persistent severe acidosis where a patient has survived. In this instance, this elderly woman also had co-existing severe acute kidney injury, hyperkalemia, hypothermia and hypotension with encephalopathy. This woman was treated with fluids, vasopressors and IV bicarbonate but ultimately needed dialysis to correct her acidosis. There are no documented cases in the literature that we could find with this spectrum of illness with such a prolonged depression of pH documented that we are aware of where the patient survived ICU admission.
In this particular case, this patient not only survived but was discharged home with no neurologic sequelae, off dialysis and in stable condition (Figure 1,2 and 3).
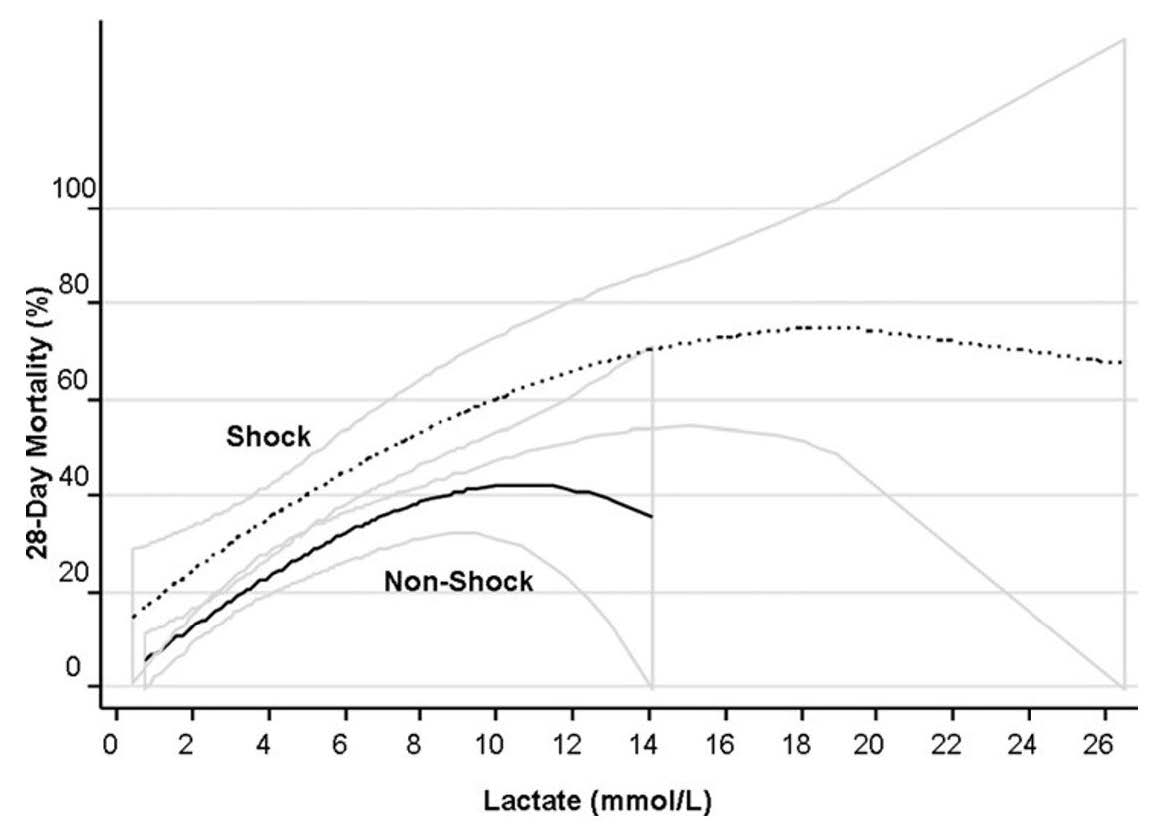
In cases of lactic acidosis unassociated with metformin use, there is a very high mortality with increasing lactate levels, whether shock is present or not, and a sharp increase in 28 day mortality is demonstrated at even minimal elevations in lactate levels above 1-2 mmol/L [14].
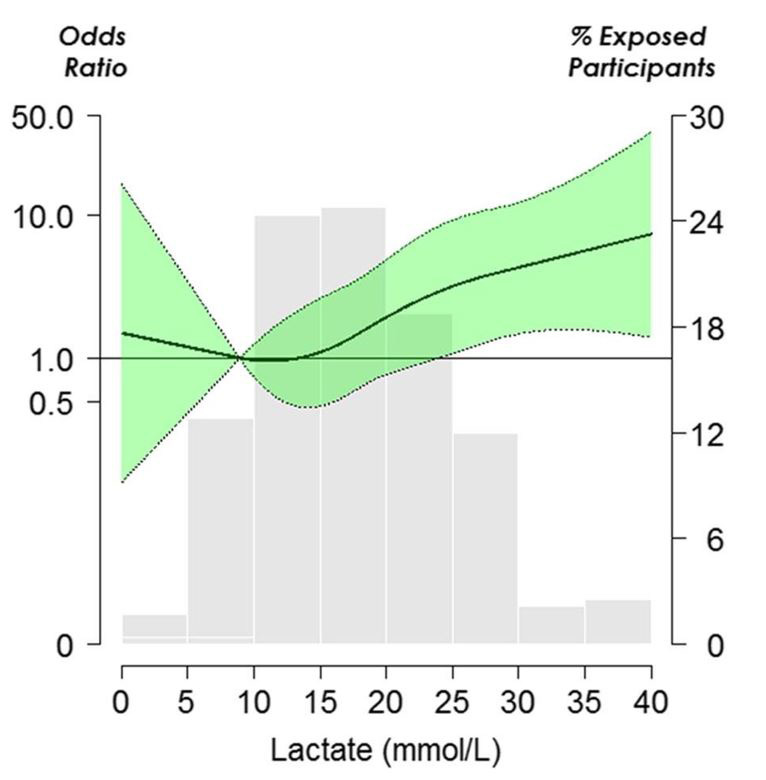
In metformin associated lactic acidosis (MAHA), initial pH and lactate levels do not correlate as dramatically as expected and there may be a possible protective effect of metformin itself , however MAHA still carries a very high mortality rate [15-17].
The true incidence of metformin associated lactic acidosis has proven to be very low (approximately 10 per 100, 000 patient years) and is most often associated with co-morbidity [19-21]. We cannot provide a physiological explanation as to why in this instance, this particular patient survived, where the literature suggests such a high mortality rate, other than supportive care was given to ensure hemodynamic stability until dialysis could be initiated. We should note however, that Kajbaf, et al found that with metformin associated lactic acidosis, arterial pH and lactate concentrations did not seem to provide prognostic value and patients often survived despite a mean pH level that was not compatible with life in other circumstances [15].
The unique aspects of this case were not only the extent of severity of illness at presentation (hypotension requiring aggressive fluid resuscitation, acute kidney injury with hyperkalemia, encephalopathy, hypothermia, severe lactic acidosis, severe anemia requiring transfusion therapy, and demand myocardial ischemia with an elevated troponin level) but also the documented prolonged nature of her severe acidosis of approximately 8 hours. She likely had undiagnosed chronic kidney disease that accounted for her severe anemia, as no other causes were identified.
She was discharged off dialysis but with residual renal impairment with a serum Cr of approximately 262 ummol/Lwith an eGFR of < 15. This may have increased her likelihood of MAHA [22,23].
We are pleased to report that despite the extremely low likelihood of survival in this patient, recovery in this setting is possible with supportive intensive medical care and renal replacement therapy as required. In this case this patient recovered with no significant acute clinical sequelae back to her own home within 10 days.