Lactulose Crystals and Liquid Both Show a Dose-Dependent Prebiotic Effect in a Computer-Controlled In Vitro Model of the Human Proximal Colon
The commercially available forms of the prebiotically active disaccharide lactulose include a liquid and a crystalline form. The prebiotic effect of both forms has not been compared in a similar study setup to date. In this study we repeated the most recent experiment performed with lactulose liquid with the crystalline formulation for comparison of the prebiotic effects. Lactulose crystals were administered daily for 5 days to the in vitro model of the proximal colon, the TNO Intestinal Model (TIM-2). Analysis of NaOH consumption, Short-Chain Fatty Acids (SCFA), Branched-Chain Fatty Acids (BCFA) and ammonia as well as relative abundance of microbiota revealed qualitatively comparable results with slight quantitative differences. After treatment with lactulose crystals, the levels of butyrate increased even more than after administration of the previously investigated lactulose liquid.
Keywords: Lactulose; TNO Intestinal Model (TIM-2); Butyrate; Bifidobacterium; Lactobacillus; Megasphera
Lactulose is an indigestible prebiotic disaccharide stimulating the growth of health-promoting bacteria like Bifidobacteriumand Lactobacillus [1,2]. Besides its therapeutic use in constipation and hepatic encephalopathy, lactulose is also used as a functional food ingredient [1,3]. The commercially available forms include a liquid (syrup) and a crystalline form [1]. These two forms differ slightly in composition. While the liquid form contains small but recognizable amounts of galactose, lactose, epilactose and 3-deoxy-glyceropentulose (in total up to 37% of lactulose), these sugars are neglectable in the crystalline form (less than 3% of lactulose) [4]. Similar to lactulose, galactose, lactose, and epilactose can promote growth of Bifidobacterium and Lactobacillus [5-10]. Therefore, the results from the liquid form cannot be transferred directly to the crystalline form. To date, the two lactulose forms have not been compared in a similar study design, even though both forms show a prebiotic effect [11-16].
We hypothesized that the crystalline form of lactulose exerts less prebiotic effect than the liquid form because of the missing side sugars. This hypothesis was tested in an in vitro model of the proximal colon, the TNO Intestinal Model (TIM-2). In a recent study in this model, 5 g per day of liquid lactulose increased SCFA, mainly acetate and butyrate production, the abundance of Bifidobacteriumand Lactobacillus, and reduced BCFA and ammonia production [12]. We repeated this study with the same design including the same batch of microbiota of human origin and administered 5 g lactulose crystals instead of lactulose liquid per day. The effects of the two lactulose forms were qualitatively and quantitatively comparable except for slight differences in the microbiota compositions. Surprisingly, lactulose crystals elicited an even stronger increase in n-butyrate compared to the liquid formulation, suggesting potential superiority with regard to gut health promotion. These results corroborate the prebiotic effect of lactulose crystals and warrant the future application of this form of lactulose in indications requiring prebiotic support.
The substance administered in this study was the lactulose crystals form (S.C.M. Società Chimica Mugello S.r.l., Vicchio, Italy) of lactulose (CAS 4618-18-2).
The TNO Intestinal Model (TIM-2) system, a dynamic in vitro model of the proximal colon, was inoculated with a highly metabolically active microbiota of human origin resulting from fecal donations from a group of 4 healthy volunteers (3 females, 1 male, age 38.8 ± 3.9 years; BMI (body mass index) 24.2 ± 1.5 kg/m2) [7,16]. Such pooled inocula have been shown to properly display the overlapping functionality of individuals and to include a slightly higher biodiversity [17]. The same microbiota batch as described for the previous study with the lactulose liquid formulation was used in this study [12]. Lactulose is generally considered not to be metabolized in the small intestine. Therefore the effect on the microbiota in the distal small intestine is considered minimal and the use of a model representing the proximal colon was considered appropriate.
The microbiota was dissolved in a standardized substrate from the ‘ileum’ (SIEM; Standardized Ileum Efflux Medium) as described recently [12].
SIEM simulates intestinal material passing the ileocecal valve in humans. It contains the major non-digestible carbohydrates (pectin, xylan, arabinogalactan, amylopectin, starch), which are found in a normal western diet. Furthermore it contains protein (bactopepton, casein), ox-bile, Tween 80 as well as vitamins and minerals [12].
At the start of the adaptation period the microbiota adapted to the model conditions and SIEM for 16 h.
Crystalline lactulose was added daily to the system at doses of 2 g, 3 g, 4 g, and 5 g lactulose. Each dose as well as the control experiment without addition of lactulose was studied in duplicate (n = 2). The test period of the TIM-2 experiments lasted 120 h (5 consecutive days).
A dialysate was continuously removed from the lumen by a semipermeable membrane and collected at the start of the test period as well as after 24, 48, 72, 96, and 120 h. At the beginning and end of the experiment (t = 0 h and t = 120 h) luminal samples were sampled as well. The samples were snap frozen in liquid nitrogen and stored at ≤ −72 ˚C until analysis. Dialysate samples were directly used; lumen samples were thawed and then centrifuged (15,300 g at 4 ˚C for 10 min in an Eppendorf Centrifuge 5417 C).
The pH was kept at a value of 5.8 by automatic titration with 2 M NaOH, the consumption of NaOH was monitored.
The lumen and dialysate fractions of TIM-2 were analyzed with gas chromatography (Shimadzu GC-2014 gas chromatograph) for SCFA (acetate, propionate and butyrate) and BCFA (iso-butyric acid and iso-valeric acid) as described previously (12).
Samples for lactate and ammonia analysis were centrifuged as described above. In the supernatant, both L- and D-lactate were determined enzymatically (based on Boehringer, UV-method, Cat No.1112821035, Roche Diagnostics, West Sussex, UK). Ammonia was determined based on the Berthelot reaction [12].
The bacterial population in the TIM-2 luminal samples was analyzed using Next Generation sequencing. Total DNA from the collected TIM-2 lumen samples at the start (t = 0 h) and at the end (t = 120 h) of the experiments was isolated as described [12].
For 16S rDNA amplicon sequencing of the V4 hypervariable region, 100 pg of purified DNA from the samples was amplified as described using 30 amplification cycles, applying F533/R806 primers [18,19]. These primers included Illumina adapters and a unique 8-nt sample index sequence key. The yield, integrity and size of the amplicons were analyzed on a Fragment Analyzer (Advanced Analytical Technologies, Inc.). The amplicon libraries were pooled in equimolar amounts and purified by using agarose gel electrophoresis and subsequent the QIAquick Gel Extraction Kit (QIAGEN). Paired-end sequencing of amplicons was conducted on the Illumina MiSeq platform (Illumina, Eindhoven, and The Netherlands).
The sequence data was processed with Mothur v.1.36.1 in line with the mothur MiSeq SOP [18]. Before merging the read pairs, low quality regions were trimmed using Btrim with a sliding window size of 5 nt and average quality score of 25 [20]. After merging, the sequences were filtered by length (range: 243-263), while no ambiguous bases were allowed. The unique sequences were aligned to the bacterial SILVA SEED reference alignment release 102 (available at: http://www.mothur.org/wiki/Silva_reference_files); too short sequences were removed using screen.seqs with parameters “optimize=start-end, criteria=90”. Chimeric sequences were identified per sample using UCHIME in de novo mode and removed. Next, sequences occurring less than 10 times in the entire dataset were removed [21]. Taxonomic names were assigned to all sequences using the Ribosomal Database Project (RDP) naïve Bayesian classifier with confidence threshold of 60% and 1000 iterations and the mothur-formatted version of the RDP training set v.9 (trainset9_032012) [22].
Due to experimental replicate number of n = 2, no statistics were performed. Mean values of lactulose treated experiments were compared to mean control values.
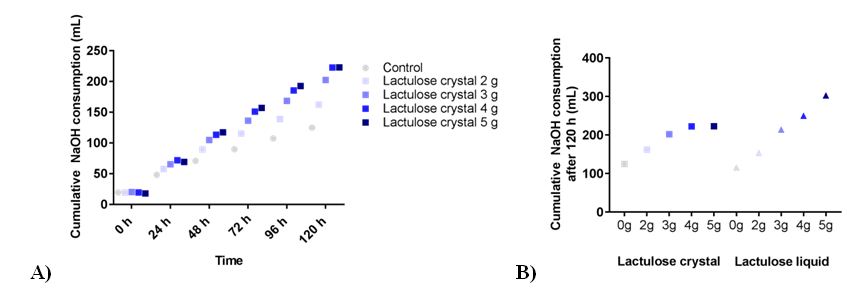
The addition of lactulose led to a dose dependent increase in NaOH consumption as shown in Figure 1A. The usage of NaOH was 162 ± 11 mL, 202 ± 13 mL, 223 ± 15 mL, and 223 ± 11 mL for the experiments with 2 g, 3 g, 4 g and 5 g lactulose, respectively, or 125 ± 9 mL in control runs. Both forms of lactulose led to a comparable increase in NaOH consumption at dosages of 2g and 3g (Figure 1B). While 4g and 5g lactulose liquid further increased the NaOH consumption, the same amount of lactulose crystals reached a plateau and did not increase NaOH consumption further.
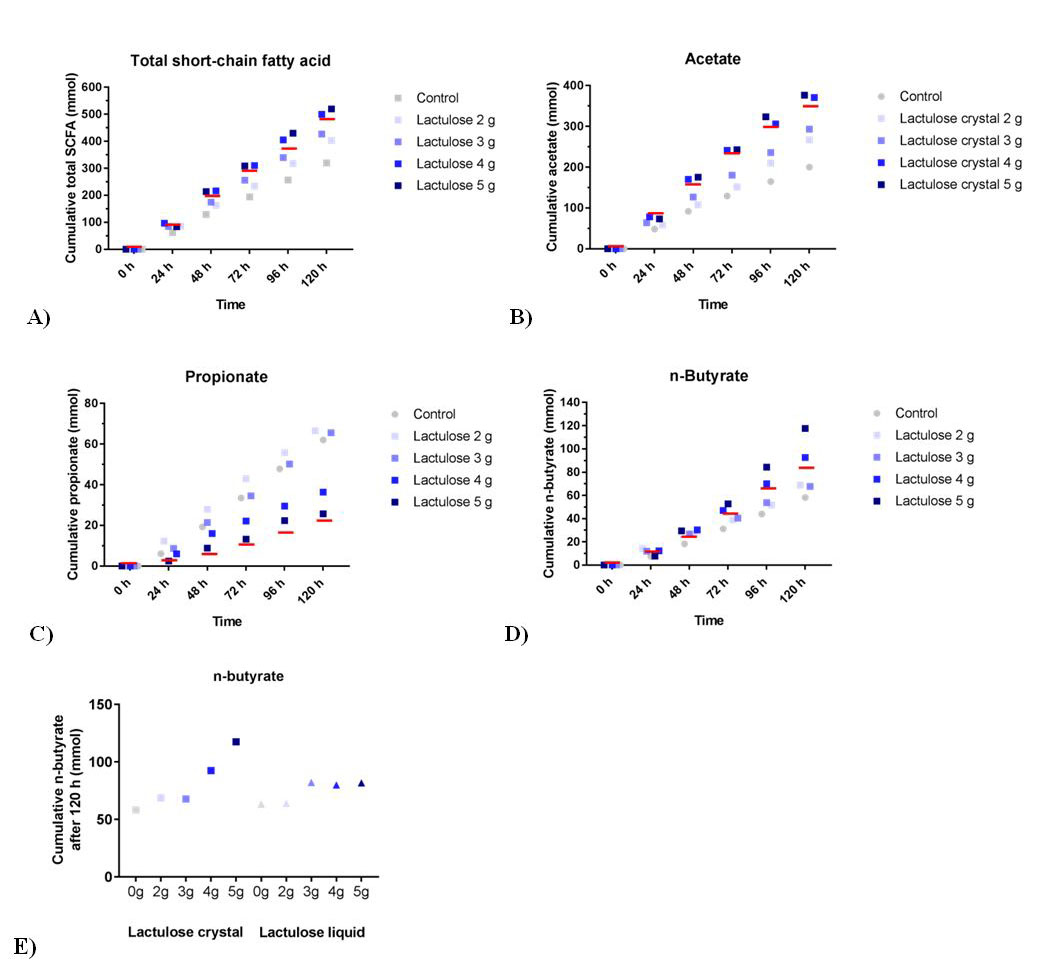
The different lactulose crystal doses all show a higher cumulative SCFA production as compared to the control as shown in Figure 2A. The mean amounts of total SCFA produced for the increasing daily doses of lactulose are 403 ± 5 mmol for 2 g, 427 ± 7 mmol for 3 g, 500 ± 13 mmol for 4 g, and 520 ± 7 mmol for 5 g, respectively, compared to 321 ± 12 mmol for the control. In the previous experiment the mean amount of total SCFA for 5 g lactulose liquid was less, namely 471 ± 12 mmol compared to 332 ± 34 mmol for its control [12].
The production profiles of each of the different SCFAs (Figure 2B; acetate, Figure 2C; propionate and Figure 2D; butyrate), indicate that similar to lactulose liquid, acetate is the predominantly produced SCFA [12]. The propionate production (Figure 2C) resulting from the higher doses (3, 4, and 5 g) of lactulose crystals was decreased compared to control and also compared to the amount reached with lactulose liquid 5 g treatment as recently published [12]. Lactulose crystals tended to induce increased butyrate production compared to control (Figure 2D). After 120 h, this increase was stronger when lactulose crystals were used compared to lactulose liquid (Figure 2E) [12].
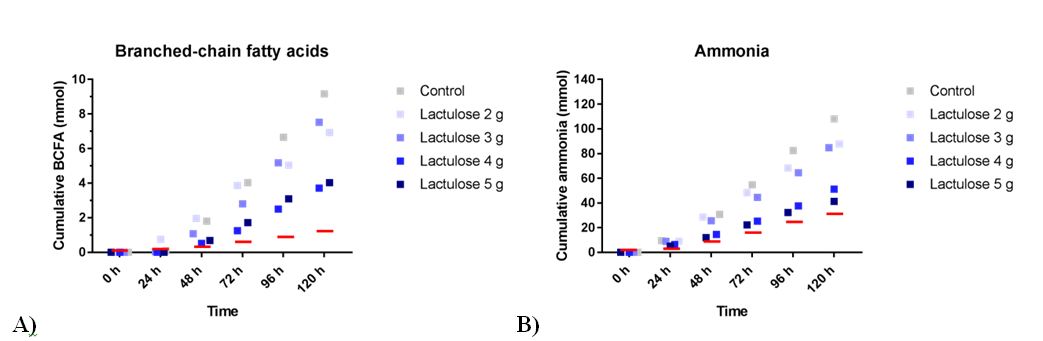
Reduced BCFA production (Figure 3A) was observed when lactulose crystals were added to the TIM-2 system. BCFA production was 9.2 ± 4.7 mmol (control), 6.9 ± 1.4 mmol (2 g lactulose crystals), 7.5 ± 1.4 mmol (3 g lactulose crystals), 3.7 ± 2.8 mmol (4 g lactulose crystals), and 4.0 ± 2.0 mmol (5 g lactulose crystals). For 5 g lactulose liquid the mean amount of total BCFA was 1.5 ± 0.2 mmol compared to 8.4 ± 4.2 mmol for the control [12].
The total amount of ammonia was measured as shown in Figure 3B. With rising doses of lactulose crystals there was a decreased mean ammonia production. Ammonia production was 108.0 ± 11.2 mmol (control), 87.7 ± 8.6 mmol (2 g lactulose), 84.8 ± 12.3 mmol (3 g lactulose), 51.1 ± 6.7 mmol (4 g lactulose), and 41.2 ± 5.2 mmol (5 g lactulose). For 5 g lactulose liquid the mean amount of ammonia produced was 30.5 ± 5.1 compared to 87.0 ± 27.9 mmol control [12].
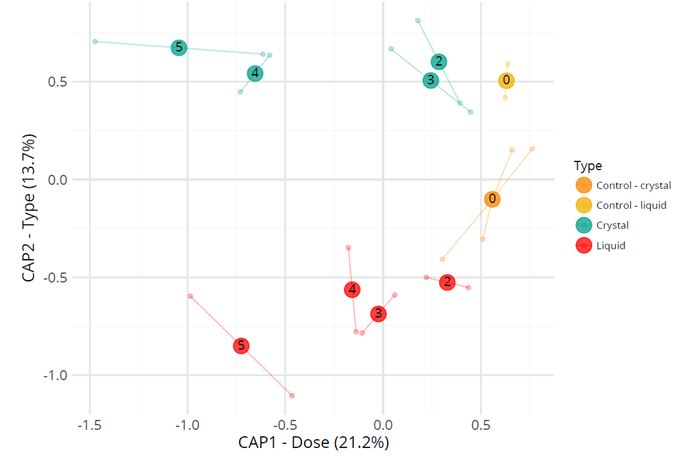
Amplicon sequencing of the TIM samples resulted in a total of 9,092,516 reads with an average of 287,547 reads per sample in a range of 207,253 up to 370,474 reads per sample. The total read length varied from 252 to 254 bases. Alignments were done against the Silva database (see method) and for classification of the reads, RDP was used. The β-diversity index represented by the constrained analysis plot of principal coordinates is shown in Figure 4. It shows effects of the lactulose dose and type of lactulose on the microbiota composition after 120 h. While after 120 h the lower lactulose doses (2 g and 3 g) are most similar in microbial diversity to the 0 g lactulose (control), higher doses (4 g and 5g) are most distinct from the 0 g lactulose.
The genus level abundancies for the control and test conditions resulting from analysis with mass V4 16S rDNA amplicon sequencing after 120 h in TIM-2 are shown in Table 1. Lactulose crystals increased the abundance of Bifidobacteriumand Lactobacillus. The increase was most prominent at a dose of 4 g lactulose crystals (> 4-fold increase in Bifidobacteriumand > 100-fold increase in Lactobacillus). In the previous study lactulose liquid led to > 6-fold elevated relative abundance of Bifidobacterium and > 2-fold elevated relative abundance of Lactobacillus [12]. In contrast to lactulose liquid, no increase in Anaerostipes was observed after treatment with lactulose crystals [12]. However, another butyrate-producing bacterium, Megasphera, showed elevated relative abundance (> 20-fold after treatment with 4 g lactulose crystals and > 60-fold after treatment with 5 g lactulose crystals).
The main finding of this study is that the prebiotic effect of lactulose crystals is qualitatively and quantitatively comparable to the prebiotic effect of lactulose liquid with few quantitative differences. Both formulations increase Bifidobacteriumand Lactobacillus. The relative increase in Bifidobacterium is comparable for the two forms of lactulose, while lactulose crystals lead to a more pronounced growth of Lactobacillus compared to lactulose liquid.
Both forms of lactulose increased the consumption of NaOH in this model, reflecting acidification of the colonic content. Such acidification is mainly due to the production of SCFA. In vivo, the colonic pH would be shifted to neutral by the uptake of SCFA by the epithelial cells and buffered by the excretion of bicarbonate [23]. The buffering of the pH by epithelial bicarbonate excretion is modeled in our study by the NaOH consumption. Daily administration of lactulose liquid to the TIM-2 model lead to a dose-dependent increase in NaOH consumption, which was also seen with lactulose crystals. After 5 days administration of lactulose crystals, however, the NaOH consumption of the 4g and the 5g runs were similar, while the NaOH consumption still increased when 5g lactulose liquid were compared to 4g of this formulation. This difference between the formulations was also reflected in the total amount of SCFA: Here the 4g and 5g runs of lactulose crystal were similar, while the levels further increased when 5g lactulose liquid were compared to 4g lactulose liquid. Even though the intraluminal pH is one of the modulators of bacterial growth, the impact of this slight difference in intraluminal acidification between the two formulations of lactulose is questionable due to the presence of bicarbonate buffering in vivo [23].
Both forms of lactulose increased the levels of SCFA and decreased the levels of BCFA and ammonia. The crystalline formulation led to a greater elevation of butyrate levels compared to lactulose liquid and to a slightly lower production of propionate. These two SCFA differ in their fate and effect. Butyrate is used preferentially as an energy source by the gut mucosa, while propionate contributes to gluconeogenesis in the liver [24]. Both have an anti-inflammatory effect with regard to cytokines, but butyrate in addition also inhibits production of reactive oxygen species [25]. Further postulated effects of butyrate are prevention of cancer, obesity and diabetes type 2 as reviewed in [26]. Propionate has been shown to lower liver lipogenesis and cholesterol levels, increase plasma leptin levels and satiety and to exert an anti-proliferative effect on cancer cells in vitro [27-32]. To date, nothing is known about the ideal intestinal ratio of propionate and butyrate and thus the consequences of the changes in SCFA after lactulose administration for gut health will have to be tested in vivo before final conclusions can be drawn.
The reason for the differences in butyrate levels between lactulose crystals and lactulose liquid may be due to differences in microbiota composition. Lactulose liquid leads to a strong increase in Anaerostipes growth, which was among others considered responsible for the increase in butyrate levels [12]. Nevertheless, although the relative abundance of Anaerostipes was not increased after administration of lactulose crystals, still the cumulative amount of butyrate in the lumen exceeded the levels induced with lactulose liquid. This effect may be related to butyrate production by other bacteria like Megasphaera, which increased in relative abundance after treatment with lactulose crystals, but not with lactulose liquid [33,34]. The increased relative abundance of Anaerostipes after treatment with lactulose liquid, which is missing after administration of lactulose crystals, may have been due to the additive effects of galactose and lactose, which are present in higher amounts in the lactulose liquid formulation. Both galactose and lactose have been shown to be even more growth promoting to the Anaerostipes strain Anaerostipes caccae than lactulose itself [35,36].
The reduction of BCFA levels, reflecting less proteolytic fermentation, was more pronounced after lactulose liquid treatment together with increased saccharolytic fermentation. Due to the reduced amount of additional sugars, administration of lactulose crystals provides less saccharides than lactulose liquid. Thus, the microbiota has to rely more on proteolytic fermentation with lactulose crystals and this could indicate why the amount of BCFA is less reduced. Interestingly, ammonia levels were comparable in both lactulose forms, excluding a harmful influence of the lessened decrease in proteolytic fermentation.
A limitation of this study is the low number of runs which precludes statistical analysis. The low number of runs was considered appropriate to gather first data for the lactulose crystal formulation as according to the former experience with the TIM-2 system the variation between runs of the TIM-2 system is rather small. Albeit the reproducible narrow variability these results require confirmation in future studies with a higher number of runs to determine statistical significance of the findings. A second limitation is the total amount of carbohydrates administered with the lactulose liquid formulation due to the higher number of side sugars. The effect of this rise in total carbohydrates on the microbiota composition cannot be excluded..
In conclusion, lactulose crystals exert a pronounced prebiotic effect in vitro comparable to the lactulose liquid formulation. The levels of butyrate after 120 h lactulose crystal treatment exceed those evoked by lactulose liquid, suggesting an even more positive effect on gut health.
This study was sponsored by Fresenius Kabi Austria
“M.K.B., A.K.-K., A.K., S.S.-G., J.F.S., A.J.H.M., and M.E.K. conceived and designed the experiments; K.L., A.J.H.M. and J.M.B.M.V. performed the experiments; S.B., K.L. and J.M.B.M.V. analyzed the data; M.K.B. wrote the paper.”
M.K.B., A.K.-K., A.K., S.S.-G., and J.F.S. are employees of Fresenius Kabi, the sponsor of this study.