Mortality in HIV-1 Patients under First Line Antiretroviral Therapy at the Out Patients Treatment Center (CTA) Fann Hospital, Dakar, Senegal
Background: Infection with HIV and AIDS is a major public health problem on a global scale, with more than 39 million deaths to date. The number of annual AIDS-related deaths declined steadily worldwide according to UNAIDS 2015. Despite the progress made in support of PLHIV, Mortality remains important because of deaths related factors that are late care, deep immunodeficiency, advanced WHO stage (III and IV), poor adherence, lack of medicines / poverty, an etiologic diagnosis delay, a delay of adequate treatment, a hospital late, medication side effects and iatrogenic causes. The main objective was to determine the associate factors in death in first line ARV.
Methods: Descriptive and analytical retrospective study from HIV positive patients on antiretroviral treatment records followed at the CTA. All HIV-1 patients under first line ARV seen in this clinic from January 2009 to December 2013 were included in this study. All patients infected with HIV-1 who underwent quantification of CD4 cells at baseline and at least twelve months follow-up in the center. We retrospectively analyzed the data entered into “ESOPE” database, which was exported to Excel. The data were then transferred to the Stata 11 College Station, Texas 77845 (USA) for analysis. We evaluated the basic characteristics of the study population associated with death by the Cox model bivariate and multivariate. The distribution of survival after initiation of treatment was estimated by the model of Kaplan-Meier survival curves and compared by the Mantel-Cox (Log-rank test).
Results: During the study period, we collected a total of 626 patients with 89 deaths followed a mortality of 14%. There was a female predominance with a sex ratio of 0.59. The average age was 37 ± 10 years with extremes of 17 and 72 years. The prevalence of HIV was higher among married patients (54%). The mortality was 2 times higher in patients with stage 4 WHO (P < 0.001), a CD4 count <172.5 cells / mm³ (P < 0.001), at the patients not on the AZT diagram (P = 0.000) and those with side effects (P = 0.001). All of these factors were statistically significant.
Conclusion: The active antiretroviral combinations for HIV (cART) are among the greatest achievements of modern medicine and have dramatically decreased deaths related to HIV and AIDS. The causes of mortality in patients with HIV infection have changed a lot since the beginning of the epidemic. The high hospital mortality observed in poor countries is the consequence of the delay in diagnosis and therapeutic management, thus promoting the emergence of severe opportunistic infections.
Keywords: Deat; HIV1; cART; Associated factors; CTA
List of abbreviations: CTA: Outpatient Treatment Center; cART: Active Antiretroviral Treatment Combinations; CHNU: Fann National Teaching Hospital
The HIV/AIDS epidemic is a major public health problem because of its high burden and significant number of death, more than 39 million deaths to date. According to the UNAIDS Report on the Global AIDS Epidemic 2013, the number of annual AIDS-related deaths declined steadily across the world from a peak of 1.8 million (1.6 to 2.1 million) in 2009 to an estimated figure of 1.5 (1.4-1.6) million in 2013. This decrease reflects the increased availability of antiretroviral treatment. And 12.9 million people received antiretroviral combinations (cART), including 11.7 million in low- and middle-income people. Those 11.7 million people account for 36% (34% to 38%) of 32.6 (30.8 to 34.7) million people living with HIV in these countries [1].
In Senegal, AIDS is still at the stage of concentrated epidemic type with a low prevalence nationally with 0.7% contrasting with high prevalence’s in the risk groups such as sex workers and men who have sex with other men [2]. The free access to ARV by the Senegalese government Initiative (ISAARV) initiated in December 2003 and the program “3 by 5” WHO have significantly improved access to ARVs.
Antiretroviral triple therapy used allow an improvement in the quality and duration of life, slow deterioration of the immune and a decrease in the frequency of opportunistic infections.
Most infections respond to a specific treatment and the efficacy of this treatment is closely linked to the precocity of his establishment and immune reconstitution with antiretroviral therapy. Delay in diagnosis is thus, in the era of HAART effective and available, a major obstacle to optimal management of infection, resulting in a high fatality even under antiretroviral therapy [3].
Despite the progress made in support of PLHIV, mortality remains important because of deaths related factors that are late care, deep immunodeficiency, advanced WHO stage (III and IV), poor adherence, lack of medicines / poverty, an etiologic diagnosis delay, a delay of adequate treatment, a hospital late, medication side effects and iatrogenic causes [4,5]. Study conducted at the Outpatient HIV Center in Fann Hospital (CTA) was to determine the associate factors in death in first line ARV patients. CTA is an ambulatory center taking care not people who are hospitalize but people in ambulatory.
Our study was conducted at an outpatient treatment center (CTA) in Fann University Teaching Hospital (CHNU) Fann in Dakar, Senegal, which is a national reference center in terms of monitoring of ambulatory patients living with HIV. This service has fourfold mission of care, training, research, psychosocial and nutritional support.
Our study was conducted at an outpatient treatment center (CTA) in Fann University Teaching Hospital (CHNU) Fann in Dakar, Senegal, which is a national reference center in terms of monitoring of ambulatory patients living with HIV. This service has fourfold mission of care, training, research, psychosocial and nutritional support.
The Ambulatory Treatment Center (CTA) at Fann Hospital in Dakar, Senegal, specializes in the comprehensive care of people living with HIV. It was created in 1998 thanks to a tripartite collaboration between the Pan-African Organization for the Fight against AIDS, the French Red Cross and the Ministry of Health of Senegal. It is one of the first three centers for therapeutic management of people living with HIV started under the Senegalese Initiative for Access to Antiretrovirals (ISAARV), the first governmental initiative in Africa.
This is a retrospective cohorte study from HIV positive patients on antiretroviral treatment records followed as an outpatient at the CTA [1]. All HIV-1 patients under first line ARV seen in this clinic from 2009 to 2013 were included in this study. Inclusion criteria: All patients infected with HIV-1 who are under first-line treatment and who underwent quantification of CD4 T cells at baseline and at least twelve months follow-up ambulatory care center, during the period from January 2009 to December 2013. Exclusion criteria: Have not been included patients lost and those who received a first-line non-standard, including the combination of three nucleoside reverse transcriptase.
For the measured variables: age, CD4 count, viral load, WHO staging, opportunistic infections, HIV type, types of ART regimens were quantitative variables; and for qualitative variables was sex, occupation, origin, marital status, risk factors and prevalence, side effects of ARVS.
We retrospectively analyzed the records of patients followed antiretroviral therapy by CTA in Dakar. We analyzed the data entered into “ESOPE” database, which was exported to Excel and complemented, for some missing variables from file sources (A2, ART register). The data were then transferred to the Stata 11 College Station, Texas 77845 (USA) for analysis. We evaluated the demographic parameters (age, sex, education), clinical stage, biological data (hemoglobin levels CD4 lymphocytes) and first-line antiretroviral combinations. Continuous variables were described as median and range unless the hemoglobin (<12g/dl versus ≥12g/dl), and categorical variables as percentages. The variable of interest (death “yes or no”) was estimated proportions. The variables were compared using the Fisher exact test and Wilcoxon test according to their conditions of applicability. We then evaluated the basic characteristics of the study population associated with death by the Cox model bivariate and multivariate. The variables associated death with a p-value less than 0.20 in the bivariate analysis were included in a multivariate model. The proportional hazards assumption was checked by the method of residues Schönefeld. Variables associated with death in the bivariate analysis why this has not been met were stratified in the final model. The relevance of stratification was assessed by determining the Akaike criteria. Any variable associated death with a p-value <0.05 were retained in the final model. The distribution of the survival after initiation of treatment was estimated by the model of Kaplan-Meier survival curves and compared by the Cox-Mantel (Log-rank test).
The study was performed on the records of deceased patients whose identity and address will remain confidential and will not be subject to any publication. But the other data in the survey form will be analyzed.
An anonymous database was compiled from medical and social records of patients at CTA. No information revealing the identity of the patients was included in this study. The database remains a CTA property. The study received prior approval by the head of the Clinic of Infectious Diseases.
During the study period, 2164 patients were followed at CTA, 626 were eligible for the study, with 89 deaths or a rate of (14.22%).
Description of Socio-Demographic Characteristics: A female was noted with 392 (63%) to 234 (37%) men, a sex ratio of 0.59. Age ≥ 37 was the most represented with 52 % (Table 1). The age ranged from 17 to 72 years and a median of 37 years. Illiterate were the most represented with 53%. Married patients were most represented 54%. The majority of patients had a wage income with 54%.
Mortality rates: Of the 626 selected patients, 14% were referred by the structures. Symptomatic patients on day 0 were represented with 84%. Patients with stage 4 were 24%. Patients with more than two opportunistic infections were 47% (Table 1).
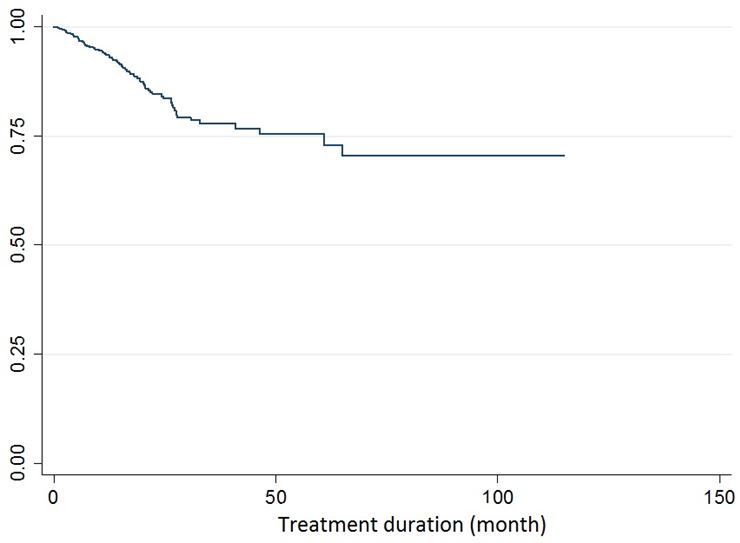
Patients with Hb ≥ 12 g/dl were 76%. Patients with CD4 counts <172.5 cellules / mm³ were 50%. CD4 counts ranged from 1 to 1300 cells / mm³ with an average of 201.20 ± 168.50 cellules / mm3.et a median 171cellules / mm³. Of the 626 patients included, 89 died, a fatality on treatment of 14%. The death rate was very high the first few months, with a tendency to stabilize with time (Figure 1).
We didn’t find a significant association between the mortality and the following factors: sex(P=0.3) ; age (P=0.17); income (P=0.4).Mortality was more prevalent in patients who were referred by 14%, with no statistically significant difference (P= 0. 6) (Table 2).
Mortality was higher in symptomatic patients at J0 (16%), and patients with more than two opportunistic infections 17%, with a statistically significant difference (P=0.001). The mortality was less prevalent among patients with Hb ≥ 12 g/dl, 7.9%, with a statistically significant difference (P=0.001) (Table 2).
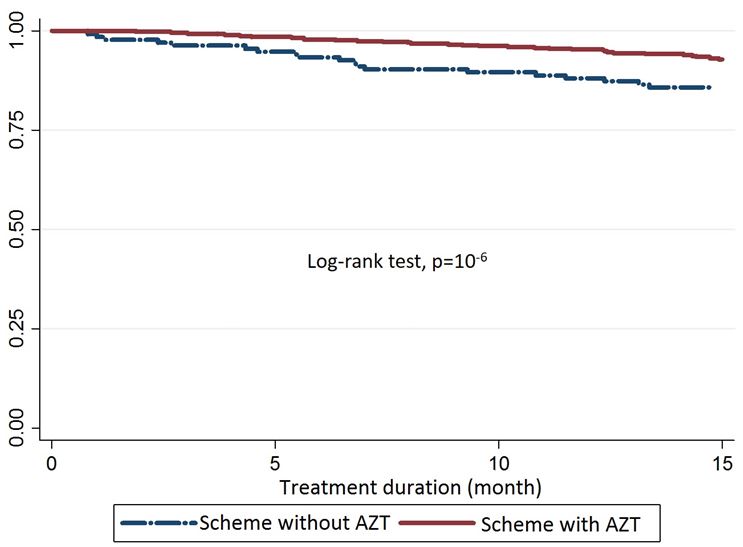
Triple therapy that combined AZT significantly decreased the mortality of 17% while a combination therapy that combined (d4T) increased mortality of 27% with a statistically significant difference (P = 0.01). Mortality was higher in patients with side effects (16%), with a statistically significant difference (P= 0.01) (Table 2).
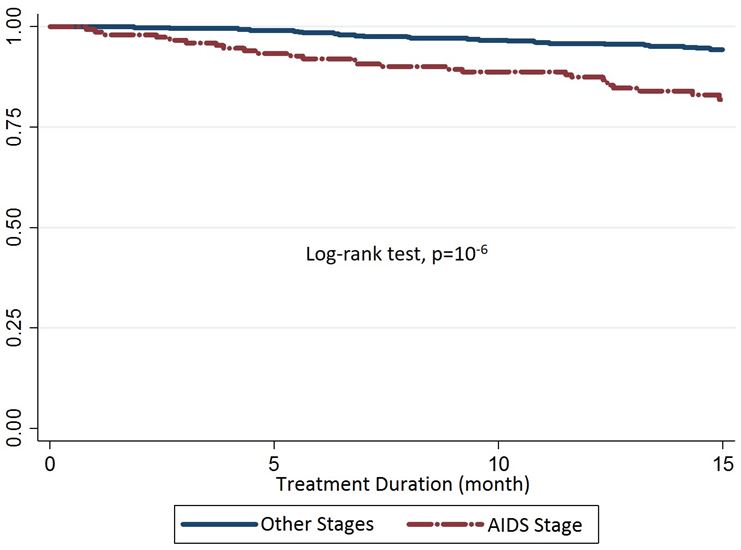
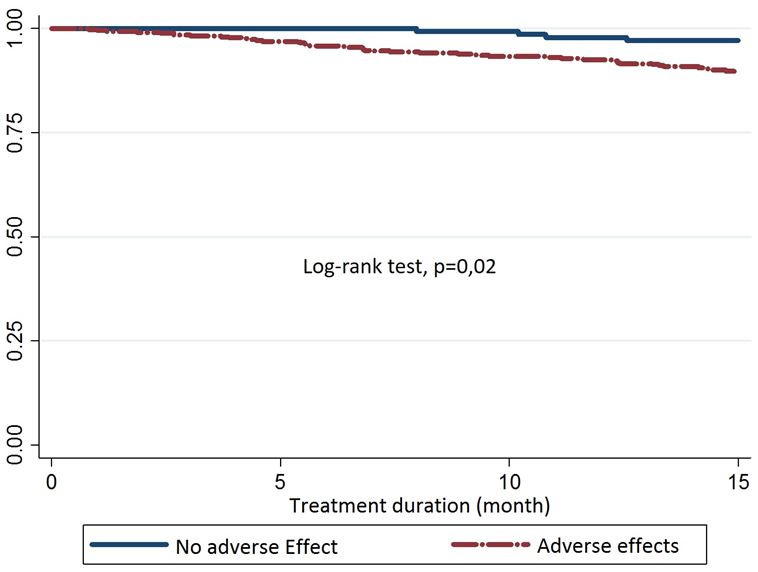
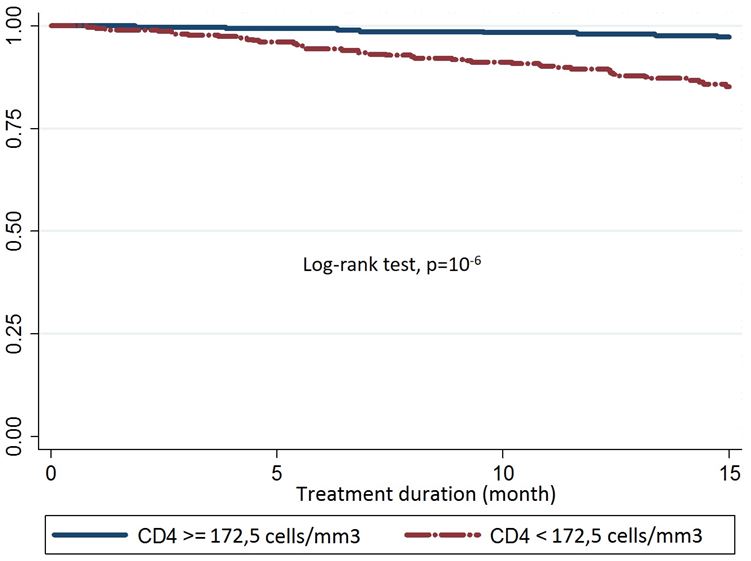
Mortality was 2 times higher in patients with AIDS stage (OR = 2.1, 95% CI (1.3 – 3) with a statistically significant difference (P= 0.001) (Table 3) (Figure 2). The log-rank mortality was almost 2 times higher in patients with adverse events, OR = 2; 95% CI (1.5-3.7) with a statistically significant difference (P= 0.02) log-rank (Figure 3). The case mortality rate was 2 times higher in patients with CD4 Cell < 172.5 / mm³, OR = 6.8, 95% CI (3.8 to 12) with a statistically significant difference (P= 0,000) (Figure 4). The log-rank mortality was almost 2 times higher in patients not on AZT regimen, OR = 2.3, 95% CI (1.5-3.5) with a statistically significant difference (P= 0.000) log-rank Figure 5.
Of the 626 selected patients, the mortality rate was 14%. Mortality was higher in patients with age ≥ 37 with 15% with no statistically significant difference (P= 0.17). However, other studies have found a statistically significant association between the age of patients and mortality. This observation was made by others studies (15%), (32%) and (40%) respectively [6-8].
The role of age in adverse outcomes is probably multifactorial, involving firstly immunosenescence leading to immune recontitution slower and less important in relation to the thymic involution. In fact, senescence is likely to disrupt the immune response in the initiation and regulation [9]. The immunodeficiency affects both, cellular immunity, humoral immunity in addition phagocytic cells [10]. The decline of cellular immunity with age is marked by thymic involution. The cellular response is diminished, marked by a numerical and functional reduction in lymphocytes, a decrease in the quantitative and qualitative cytokine response, and reduced and delayed skin reactivity [11].
Moreover the comorbidity related to age, including cardiovascular, renal, liver disease, neuropsychological and metabolic disorders which can all evolve beyond the diagnosis of HIV. This mortality affected more men. This high prevalence of men was found in other studies [12,11]. Previous work has documented that men tend to seek treatement at more advanced stages of the disease than women. Women indeed have more screening opportunities, among others in a secondary screening to diagnosis of infection in their spouse, but also as part of prenatal check [13]. However, differences between men and women regarding the pharmacology of antiretroviral have been well documented [14]. These differences explain various factors, including the weight and composition of body mass. Indeed, women have more body fat and less skeletal muscles and are thus have a greater susceptibility to lipophilic products, which can impact on their volume of distribution. The main consequence is a reduction in the maximum concentration of the product and the duration of its action. Women are thus more vulnerable to drug toxicity phenomena, although treatment compliance is often better compared to men [15].
Mortality was higher in symptomatic patients at day zero (16%) with a statistically significant difference (P< 0.001). This has been done in some studies [12,16]. However the stage of early detection seems to be a protective factor in our study and survival rate of patients at the WHO Stage I is a proof for significantly reducing the risk of mortality. Thus logically mortality was proportional to the number of opportunistic infections, indicating an advanced stage, with a very significant difference. Delays in diagnosis and management therefore seem obvious, leading to increased morbidity and mortality for the 23% of our patients that were in AIDS stage. Other studies confirm our hypothesis [6,7,12,17,18]. The association between late-stage and mortality is a constant in literature [3]. This shows once again the interest of public awareness routine screening, the only guarantee of early diagnosis [15].
In our study many patients who died had more than two opportunistic infections. The majority of patients who arrived at the advanced stage of HIV infection were carriers of at least one opportunistic infection, respectively which correlates to findings in these studies with 55% [8,19,20]. However the stage of early detection seems to be a protective factor in our study stage I of the WHO is a proof for significantly reducing the risk of fatality.
The mortality was less present in patients with Hb ≥ 12 g/dl. This reality is confirmed by some studies [17,7,20,21]. Anemia has been regularly reported as a factor of poor prognosis in people living with HIV, both in terms of progression to AIDS stage, and of survival, regardless of CD4 count [22]. It notes the multiple factors in poor areas, which are of order carentiel, infectious, gynecologic, obstetric and therapeutic. This shows the importance of the blood count in the therapeutic pre assessment and monitoring, especially before applying AZT, and proper management of any anemia.
Mortality was higher in patients with CD4 < 172.5cellules / mm³ 21.7%, with a statistically significant difference (P < 0.001), which was confirmed respectively in previous studies [6,12,17,18]. The severe immunosuppression results in a low CD4 counts at baseline, as well as reflecting the clinical stage, the consequence is a high and early mortality. The high early mortality in patients has received an advanced stage of immunosuppression gives all its importance to the early implementation of antiretroviral treatment, according to the new WHO recommendations that require early diagnosis of infection, at best proper implementation of the screening provider-initiated.
Triple therapy that combined AZT significantly decreased the mortality while a combination therapy that combined (d4T) increased mortality. This has been demonstrated by some studies [12,21]. The choice of the combination therapy also influences which can be negative with respect to d4T causes side effects can significantly increase the mortality of our patients and AZT which has the opposite effect (16%). This has been by Kumarasamy N, et al., Dlodlo RA, et al. [13,23]. D4T, long used as a first line option in combination with 3TC, is responsible for very debilitating long-term toxicity including lipoatrophy and peripheral neuropathy. The impact of this toxicity on compliance and the occurrence of treatment failure was the main reason for the final withdrawal of this molecule in the therapeutic arsenal antiretroviral.
The active antiretroviral combinations for HIV (cART) are among the greatest achievements of modern medicine and have dramatically decreased deaths related to HIV and AIDS. The causes of mortality in patients with HIV infection have changed a lot since the beginning of the epidemic. The high mortality observed in poor countries is the consequence of the delay in diagnosis and therapeutic management, thus promoting the emergence of severe opportunistic infections.
• Mortality persists despite highly active treatment
• Mortality attributed to late diagnosis, delayed ART, advanced stage of immunodepression, poor treatment adherence
• Mortality may be related to immune degradation at the beginning of ART
• Mortality due to severe toxicity of ARVs (case of D4T)
• Confirmation that D4T is associated with mortality compared to AZT despite its efficiency. This is due to the toxicity of D4T especially in cases of neuropathy which may lead to problems of treatment adherence.
• Mortality remains linked to late diagnosis, which consolidates the decision to early detect and treat
• Prospect of studying mortality among patients using TDF versus AZT in their combination.
Ngom-Gueye Ndeye Fatou, Diallo Abdoulahy, Ndiaye Abdoul Aziz design, data collection, statistical analysis and manuscript review. Other authors: design and manuscript review. All the authors have read and approved the final version of the manuscript.
The authors would like to acknowledge the participants and the patients, the outpatient center staff Fann for their support of this study.