Multiple Paragangliomas at Unusual Sites Detected on 18F-FDG PET CT
Occurrence of multiple Paragangliomas (PGL) is relatively rare. Very few case reports have described the role of 18F‑fluorodeoxyglucose positron emission tomography‑computed tomography (FDG PET‑CT) in the diagnosis and staging of PGL. Here, we report the case of a 48‑year‑old man with multiple PGL who presented with atypical symptoms. In this case, 18F-FDG PET‑CT proved to be a beneficial imaging modality in arriving at the diagnosis of this patient with nonspecific clinical presentation and also in the detection of the multiple sites involved.
Keywords: Paraganglioma; 18F-FDG PET‑CT; Carotid Body Tumors
Paragangliomas (PGL) are rare neuroendocrine tumours that arise from the paraganglial tissue / chromaffin cells and can be associated with the sympathetic or parasympathetic nervous system. Tumours in the adrenal medulla are termed pheochromocytoma (over 90%) and rest are termed paraganglioma. PGL appears in abdomen, neck, pelvis and mediastinum. Majority of PGL are non-functioning (i.e., do not secrete catecholamine’s). Carotid body tumors (CBTs) are rare type of extra-adrenal PGL which originate from the carotid body (also termed chemodectoma) [1]. Their incidence is estimated to be less than 0.03% [2]. Usually, CBT is a solitary occurrence. The incidence of bilateral carotid body lesions is just 10% [3]. CBT can have sporadic or familial (10% of all CBT cases) occurrence. The majority of cases are considered to be benign, with only 6-12.5% demonstrating malignant inclinations. CBTs are often diagnosed based on the location, clinical symptoms and imaging findings of the tumour [1]. The carotid angiography (most useful diagnostic test) demonstrates tumor blood supply and widening of the carotid bifurcation by a well-defined tumor blush (“lyre sign”) [3]. A biopsy of a CBT may cause uncontrollable haemorrhage, hence not advised.
Mediastinal paragangliomas are rare, only approximately 150 cases having been reported in the literature, and two-thirds of these tumors are located in the anterior or middle mediastinum. PGL located in the posterior mediastinum is very rarely reported. Mediastinal PGL originates from the para - aortic (middle mediastinum) and para - vertebral (posterior mediastinum) sympathetic chain ganglia. Up to 50% patients are asymptomatic and diagnosis is incidental. The behaviour of mediastinal paraganglioma is aggressive. The distant metastasis rate is about 19.5%. Multicentric PGL tumours are observed in 23% of cases, and there seems to be no specific distribution pattern [4]. Microscopically, PGLs show nests of polygonal to round cells surrounded by thin rim of sustentacular cells. This is called the classic “Zellballen” pattern of PGLs. No definite morphological criteria including severe nuclear atypia, capsular or vascular invasion, are present to establish malignancy or metastatic potential. Metastatic disease due to CBT can only be diagnosed based on the presence of chromaffin tumours in locations where chromaffin cells are not usually present. Only the presence of regional lymph nodes or distant metastasis (to brain, bone, liver and lungs) indicates malignancy.
Functional imaging techniques using tracers that are specifically internalized by catecholamine metabolism may confirm the diagnosis (e.g. 123/131I – MIBG, 18F-FDA, 18F-FDOPA, 11C-Epinephrine, 11C -Hydroxyephedrine). Functional imaging using 68Ga-labeled somatostatin (SST) analogs takes a special mention which has showed very good results [5]. Nonspecific functional imaging modalities such as Octreoscan (111In labeled anti-CEA antibody) and 18F-FDG PET-CT are also useful [6]. 18F-FDG PET-CT is not recommended as a first-line examination in PGL imaging. But in this case, it has proven its importance when done at an early stage, to detect multiple tumors or metastatic disease as it allows screening of the whole body. Here we report the importance of utilizing 18F-FDG PET CT to diagnose and stage a rare case of multiple PGL involving bilateral CBT and posterior mediastinum.
A 48 year old male presented with long standing chest pain and giddiness. He was initially evaluated in the Cardiology department. 2D- ECHO revealed reduced LV systolic function (LVEF of 50%). Coronary Angiogram was done which picked up a mediastinal tumour vascularized by Left Circumflex artery. Following which coil embolization of the feeding vessel was done. Patient was referred for 18F-FDG PET CT for further evaluation.
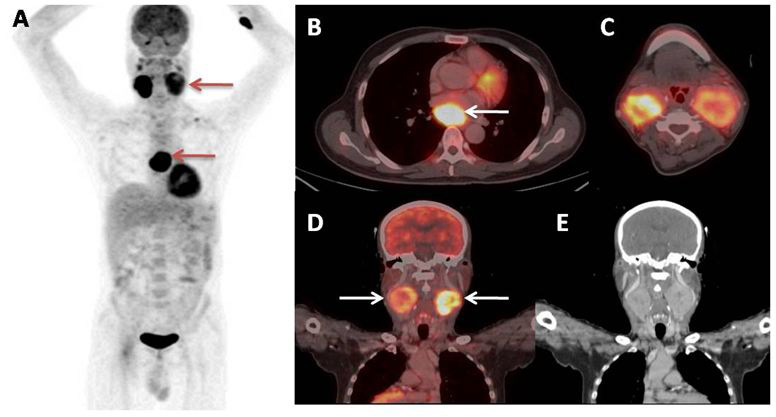
18F-FDG PET CT was conducted after injection of 12.8mCi of FDG. 18F-FDG PET CT maximum intensity projection (MIP) image showed hypermetabolic lesion in the mediastinal region and bilateral neck region (Figure 1A). Intense FDG uptake was seen in a heterogeneously enhancing well defined soft tissue density mass lesion in the posterior mediastinum abutting the left atrium, left pulmonary vein and right pulmonary trunk measuring 3.4 x 3.5 x 4.7 cm with SUV max of 18.2. The lesion was extending from lower border of T5 to lower border of T7 vertebra (Figure 1B). Also, FDG uptake was seen in intensely enhancing mass lesions in bilateral carotid space with central hypodensities (Figure 1 images C,D and E). Splaying of internal and external carotid arteries was noted on bilateral sides. Compression and splaying of bilateral IJV was noted with evidence of multiple collateral veins. Bilateral carotid lesions were seen abutting the anteromedial border of the upper third of sternocleidomastoid muscles on the respective sides. The lesion on the left side measured 5.5 x 4.4 x 5.9cm with SUV max of 6.9. The lesion on the right side measured 4.3 x 3.9 x 5.8cm with SUV max of 16.4. Hence PET CT findings were suggestive of bilateral Carotid body tumours. Also, biopsy was suggested from the posterior mediastinal lesion.
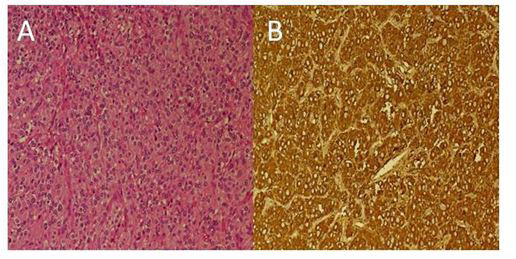
Patient underwent excision of posterior mediastinal mass lesion. Histopathology revealed a well circumscribed mass composed of nests and trabeculae of monotonous tumour cells surrounded by fine vascular network (Zellballen pattern) (Figure 2A). Immunohistochemistry (IHC) was strongly positive for NSE, Synaptophysin and Chromogranin. Findings were consistent with PGL (Figure 2B).
Following which right carotid body tumour excision was performed. Histopathology report showed a similar picture to that of posterior mediastinal lesion, consistent with PGL. Right level II and level III cervical lymph nodes were excised which showed no evidence of malignancy. Post-operative period was uneventful.
Multicentric tumors occur in 10–20% of all head and neck paragangliomas [4]. The most common multiple PGLs are CBTs. Molecular genetic research has identified multiple susceptibility genes for PGL, including succinate dehydrogenase SDHB, SDHC, SDHD, SDHAF2, SDHA, transmembrane protein 127 (TMEM127), Von Hippel-Lindau disease (VHL), RET (Rearranged during Transfection) in Multiple Endocrine neoplasia type 2 (MEN2), neurofibromatosis type 1 (NF1) and myc associated factor X (MAX). Risk of malignancy is highest in the presence of SDHB mutation, in which 18F-FDG PET CT is recommended as the first line PET study. However, in presence of SDHC, SDHD, SDHAF2 gene mutations 18F-DOPA is recommended [7]. Functional imaging has two main goals: to aid the clinical diagnosis and to depict multiple tumors, which may occur synchronously or metachronously [4]. 18F-FDG PET CT allows better detection of metastases / multiple sites, provides a high specificity, and enables functional characterization of PGL. It is important to stress that the histological appearance of a CBT is not a reliable guide to its propensity for malignant behaviour. Treatment options for head and neck paragangliomas include: surgery, conventional radiotherapy, stereotactic radiotherapy and stereotactic radiosurgery (for temporal bone PGLs), permanent embolization and combination of these treatment modalities [8].
As multiple paragangliomas may develop many years after the presentation of the first tumour, regular, prolonged clinical and radiological follow-up of patients is required.
Occurrence of multiple paragangliomas is rare. They pose several diagnostic and therapeutic challenges. The lack of firm predictors of malignancy, coupled with the variable course of this rare disease, make life-long follow-up of patients mandatory. 18F-FDG PET CT offers a one stop shop imaging procedure as the whole body is imaged to detect efficiently all the multiple / metastatic sites.