Novel Synthesis and Characterization of Silver Nanoparticles from Leaf Aqueous Extract of Aloe Vera and their Anti-Microbial Activity
The novel approach has been carried for the green synthesis of silver Nano particle using leaf extract of Aloe Vera and silver nitrate solution. The synthesis silver nanoparticles were characterized by using various instrumental techniques including (UV-VIS) Spectrophotometry, XRD Spectrophotometry, DRS Spectrophotometry, Scanning Electron Microscopy (SEM), and Fourier Transform Infrared Spectroscopy (FTIR).The EM) showed the formation of silver nano particle with an average size of 87.7 nm. The synthesized nanoparticles are found to be highly effective against different human pathogenic bacterial species including gram-negative Pseudomonas aeruginosa, salmonella, and Escherichia coli and gram-positive bacteria like Staphylococcus aureus by using different concentration of silver stock solution i-e 20 µg/ml, 40 µg/ml, 60 µg/ml, 80 µg/ml, and 100 µg/ml.Results revealed that the synthesise silver nano particle exhibit excellent zone of inhibition against Staphylococcus aureus 04mm, 09mm,13mm and 17mm and 19mm using Gentamicin as standard drug but did not show exhibit inhibitory effects against Escherichia coli,Pseudomonas aeruginosa,Salmonella. Thus their excellent antibacterial activity against resistant strains suggests that warrant further optimization as novel anti-infective chemotherapies.
Keywords: Silver Nanoparticles; Aloe Vera Leaves Extract; Characterization; Antibacterial Activity
Nanotechnology involves ‘manufacturing of particles at Nano scale and also creates new products which improves a wide range of physicochemical properties include durability, strength, reactivity and conductivity [1]. Nano-particles (NPs) have attracted much attention due to their potential applications in catalysis, biology, computing, solar cells and optoelectronic devices include cosmetics, mechanics, energy science, biomedical science, space industries, single electron transistors, nonlinear optical devices, light emitters, drug gene and photo chemical applications [2-5]. In current year synthesis of nanoparticle by green method in which plant extract is used as reducing agent is gaining importance over photochemical reduction, heat evaporation, electrochemical reduction, and chemical reduction methods due to its simplicity, less toxicity and eco-friend iness. Nanoparticles can be synthesis by green method by using several biological system including bacteria, fungi, and yeast.
Silver nanoparticles have attracted intensive research because of many applications such as, plasmonics, medicinewww.sooperaticles.com), antimicrobial, antiviral agents, anti-proliferative agents, catalytic, textile fabrics and plastics to eliminate microorganisms at low concentrations with less toxicity [6-9]. Plant extracts are rich sources of secondary metabolites which easily reduce silver nitrate to silver nanoparticles. The size and morphology of the synthesis silver nanoparticle can be controlled and strongly influenced by the experimental conditions, the kinetics of interaction of metal ions with reductive and productive biomolecules, adsorption processes of stabilizing agent with metal nanoparticles and varying the PH [10-12].
Many reports are available to synthesis the Silver nanoparticle by green method from various plant extract including Geranium leaves, Acalypha indica, Pelargonium graveolens, Medicago stiva (Alfalfa), Nico-tiana tobaccum Catharanthusroseus [13-15]. Similarly constituents of plant such as geranial possess reducing property which reduce Ag+ ion to silver nanoparticle with a uniform size and shape in the range of 1-10 nm with an average size of 6 nm.
Hence the aim of the present study is to develop a novel approach for the synthesis of green silver nanoparticle by using herbal extract of Aloe Vera which has been proven active against different strain of bacteria.
Materials used in research study were Silver Nitrate (AgNO3), distilled water, What-man filter paper and Aloe Vera leaves, chromic acid, volumetric flask, petri plates, Escherichia coli, Staphylococcus aureus and Muller Hinton Agar Medium.
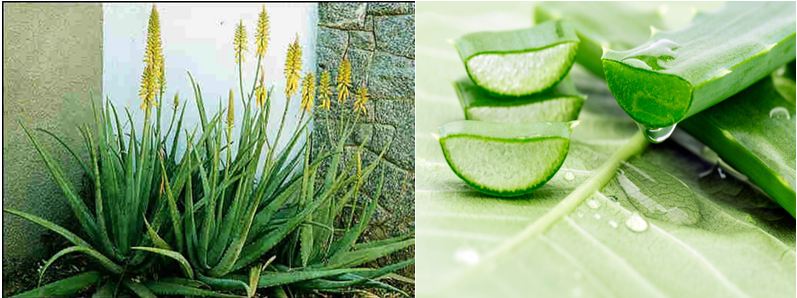
Fresh leaves of Aloe Vera Figure 1a and b were collected and washed several time with distil water in order to remove the dust particle and then sun dried to remove the remaining moisture. Weighed 10gram dried Aloe Vera leaves, crumpled and chopped with glass rod in 500ml glass beaker, added 200ml sterilized distilled water in 250 ml beaker, boiled for 20 minutes, until the color of the aqueous solution changes from watery to light yellow, Cool the extract at room temperature then filtered through what-man filter paper, centrifuged at 3000rpm for 30minutes, and separate the supernatant layer by pipette. Store the Aloe Vera extract at -15 oC temperatures and use within one week.
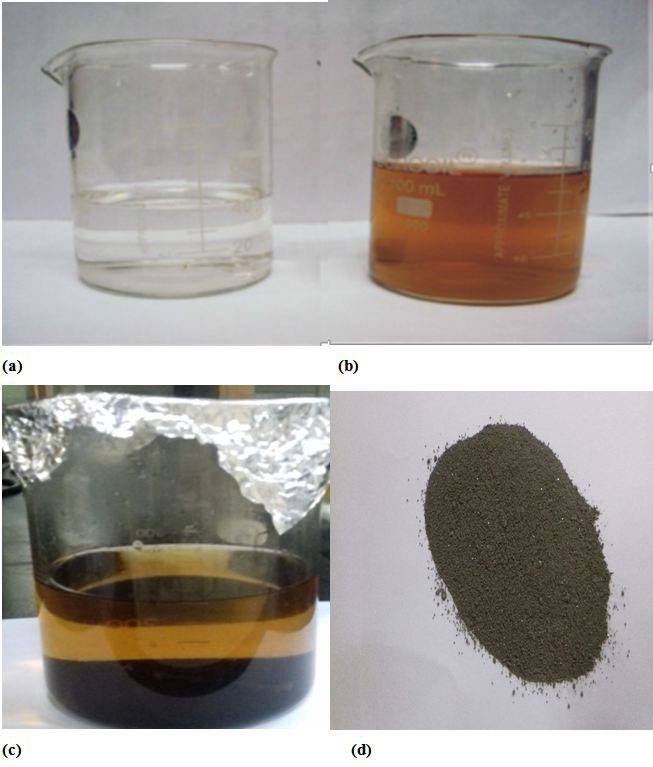
Took 0.17gm of silver nitrate in 1000ml volumetric flask and dissolved in distilled water and made up the volume to 1000 ml to Prepare 0.001M/1mM solution of AgNO3. In typical reaction procedure take 50 ml 0.001mm solution of AgNO3 then added 20 ml Aloe Vera leaves extract drop-wise with continuous shaking at room temperature until the solution become grey black colour, indicated the reduction of silver ion by the aqueous plant extract and the formation of stable silver nanoparticle see Figure 2a,b,c and d.
The reduction of Ag+ ion in bio extract solution was monitored by periodic sampling of aliquots (0.2 ml) of the bio extract , then diluting the samples with 2 ml deionized water and subsequently measuring UV–Vis spectra of the resulting diluents. UV– Visible spectroscopy analyses of silver nanoparticles was recorded on Shimadzu UV-240 nm (Shimadzu Corporation, Tokyo Japan, Model no LF-204.LS) spectrophotometer. The absorption spectrum is plotted against the range of wavelength, from 200-800 nm.
The residual solution of containing the Ag nanoparticles was centrifuged at 4800 rpm for 30 min and the resulting suspension was dispersed in 15 ml sterile distilled water. The centrifuging and redispersing process was repeated three times and finally dried at 400 oC. The dried Ag nanoparticles were analyzed in range 4000–400 cm-1 with IR-Prestige-21 Shimaduz FTIR spectrophotometer, using KBr pellet method.
The Size and nature of Silver nanoparticle were determined by using XRD Spectroscopy technique using Shimadzu XRD-6000/6100 model with Ni as filter and at a setting of 30 kV/30 mA Cu k α radian at 2θ angle. The Debye–Scherer’s equation was used for calculating the mean size of silver nanoparticles by using D = 0.94λ/B cosθ.
Scanning electron microscopy (SEM) analysis of silver nanoparticles analysis was done using Hitachi S-4500 SEM machine. Thin film of the sample were prepared on carbon coated copper grid by just dropping a very small amount of the sample on the grid, extra solution was removed by using blotting paper and then film on the SEM grid were allowed to dry by putting it under mercury lamp for 5 minute.
Muller Hinton Agar Medium (1 L) The medium was prepared by dissolving 33.9 g of the commercially available Muller Hinton Agar Medium (HiMedia) in 1000ml of distilled water. The dissolved medium was autoclaved at 15 lbs pressure at 121 oC for 15 minutes.
Vortex the organism suspension to make sure it is well-mixed. Then, dipped a sterile wire lope into the suspension, taken out and inoculated in the sterilized media ensuring that the temperature of media should not exceed 50 oC, shaken well and poured 20ml of this inoculated media in each petri plate (sterilized at 160 oC for one and half hour), let it to jellify. Note and ensure that all this activity is done under Laminar air flow cabinet with standard of USP customary class 100 (class A), differential pressure not less than 0.05 inches of water column or 12 Pascal, air changes not less than 100/hour. Bio burden less than 1cfu.
Dig wells in a petri dish, containing 20ml Muller Hinton medium that were seeded with 24hr culture of bacterial strains, with a sterile borer, and fill the well with 20 ìl of the nanoparticle were added in each well. The plates were then incubated at 37 oC for 24 hours. Note and ensure that all this activity is done under Laminar air flow cabinet with standard of USP customary class 100 (class A).
The antibacterial activity was assayed by measuring the diameter of the inhibition zone formed around the well with the help of Vernier calipers.
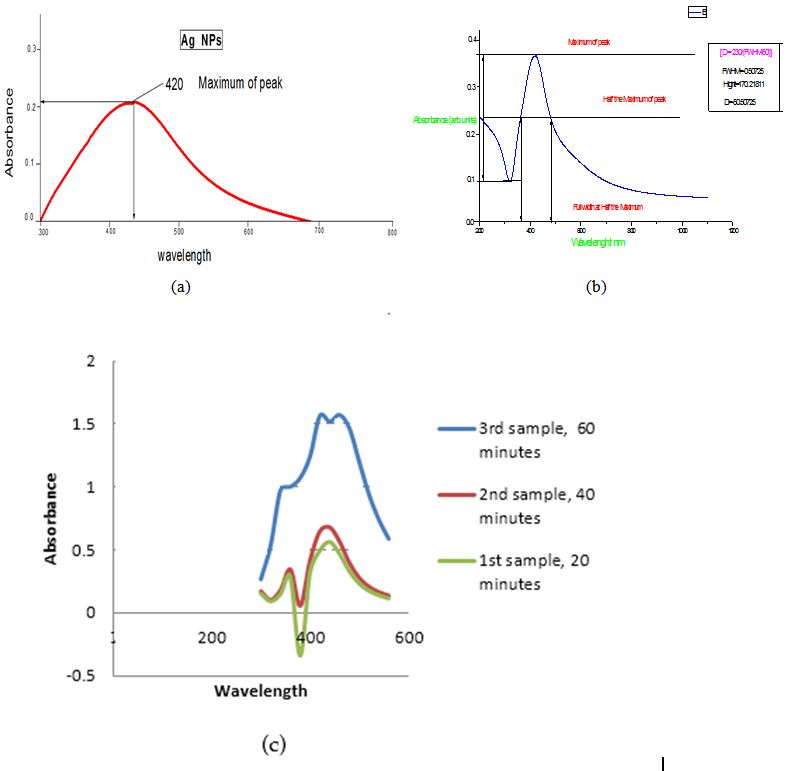
The UV-v spectra of silver nanoparticle in Figure 3a,b and c were recoded from the reaction mixture as a function of reaction of time (20, 40, 60 min) using leaf extract was mixed in aqueous solution of silver ion complex. The sample show similar behavior with maximum absorption peak at 390-410 nm. The overall broadness of the spectra and shift in the absorbance peak indicates that silver nanoparticles require some time to settle down, which mean the reaction takes time to complete but as far as the size of these particles are concerned, the size grows slightly in comparison to initial stage of the reaction when the extract is being mixed with the salt, so it is obvious that as the time for reaction is raised the concentration and size of silver nanoparticles is enhanced which can be observed by the (Figure 4) of variable times. The small absorption peaks after 20 minute indicate that there is no silver nanoparticle formed but after 40 min and 60 min the absorption occurs at 420nm indicate the formation of silver nanoparticle and increase with the time of reaction without change their wavelength [16].
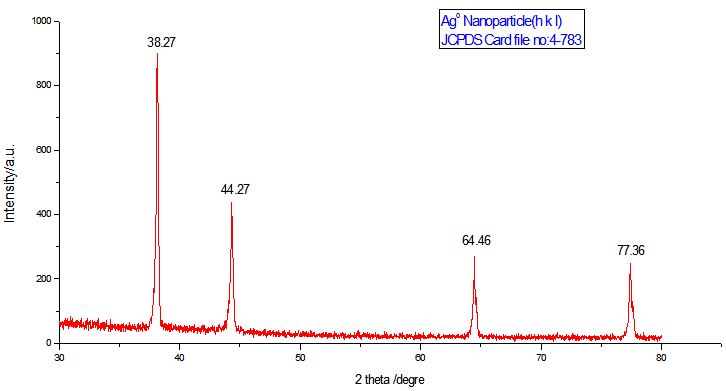
XRD analysis showed intense peak which confirming the existence of Silver nanoparticle and crystalline naturein the sample Figure 5. The intensity peak corresponding to 2θ=38.26,44.5,64.51,77.47 having Braggs reflections (111), (200), (220) and (311) which were in good agreement with reference to the unit cell of face-centered-cubic (FCC) structure of metallic silver (Joint Committee for Powder Diffraction Standards, JCPDS File No. 01-089- 3722) with a lattice parameter of a = 4.0843 Å. The Debye–Scherer’s equation was used for calculating the mean size of silver nanoparticles with respect to (111) of Bragg’s reflection, which gave an estimation of about the average size was from 86.7nm to 89.1nmof silver nanoparticles see Figure 4.
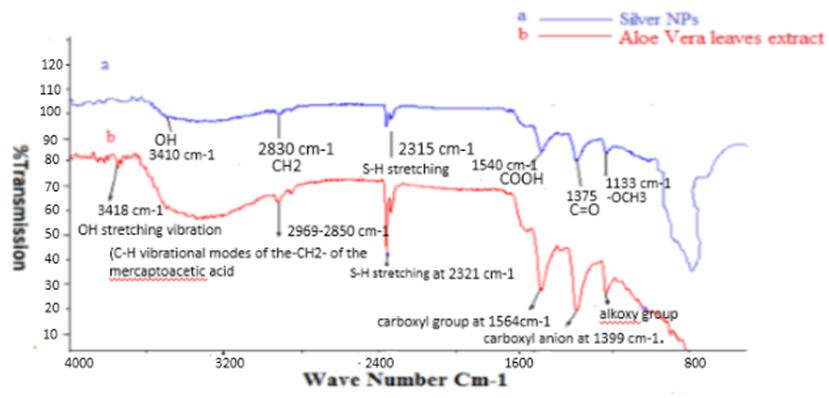
Figure 5a and b shows IR spectra of silver nanoparticles and aqueous Aloe Vera leaves extract. The Purified nanoparticles exhibited absorption peaks at 1133, 1375, and 1540, 2315,2969,2830,3410 cm−1 due to cyclic OCH3, C=O, C–OOH, S-H, CH2 and OH functional groups, respectively. The peaks obtained were compared with Aloe Vera leaves extract (Figure 5b) showed bands at wave number (cm-1) 1140, 1399, 1564, 2321, 2850, 3418 and less intense peaks with slight shift were observed in the purified silver nanoparticles. From the FTIR spectra it may be inferred that the Aloe Vera leaves extract was the probable reducing agent which was involved in the synthesis of silver nanoparticles. Further the Aloe Vera leaves extract might have formed a layer on the silver nanoparticles (i.e., biological capping) that prevented the agglomeration of the particles. Thus, the nanoparticles were stabilized. Thus, confirming the association of Aloe Vera phyto-compounds such as phenols, proteins and sterols with silver and their ability to act as an effective reducing as well as capping agent in silver nanoparticles synthesis.
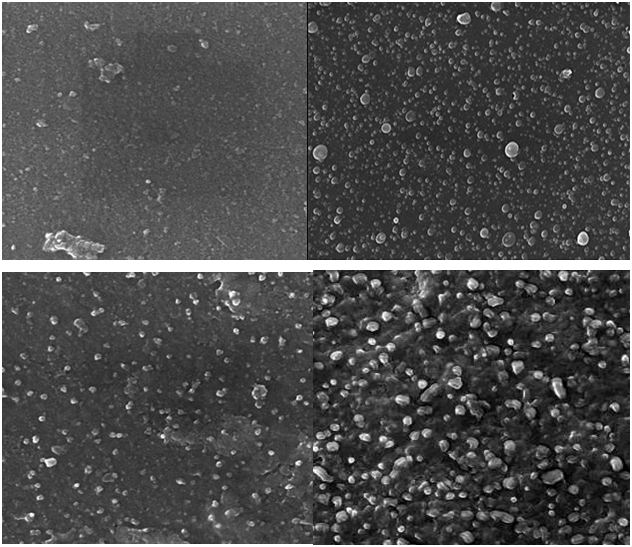
SEM technique were employed to visualize the size and shape of nanoparticle .The SEM (Hitachi S-4500 SEM machine) used SEM grid which were prepared by placing a small amount of sample powder on a copper coated grid and drying under lamp. The formation of silver nanoparticle and their morphological dimension in the SEM study demonstrated that the average size was from 86.7nm to 100nmwith interring particle dimension. The shape of the silver nanoparticle proved to be spherical as shown in (Figure 6). The larger silver particle size may be due to the aggregation of the smaller one.
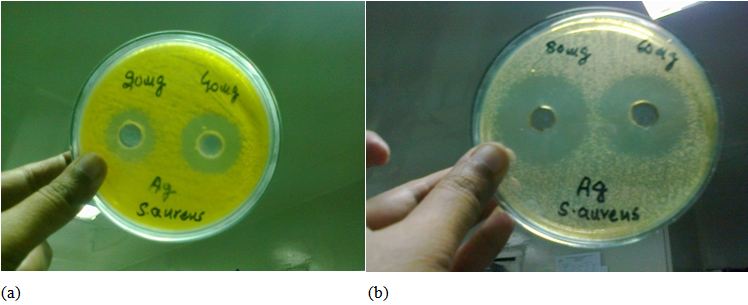
The synthesized Ag nanoparticles are tested against Escherichia coli, Staphylococcus aureus, Salmonella type and Pseudomonas aeruginosa by using agar well diffusion methods. The photographs of the bioactivity are given below in (Figure 7a and b). The zone of inhibition showed the antibacterial activity of Ag-nanoparticles.While in case of staphyllococcus aureus very prominent inhibition zones were observed, 20ug/ml, 40ug/ml, 60ug/ml, 80ug/ml of silver nanoparticles and compare to stander drug gentamicne which show clear results that less the concentration lesser is the inhibition zone, and more the concentration larger the inhiition zone, which ensures the effctiveness of antibacterial activity of Ag nanoparticles against staphyllococcus aureus (Table 1).
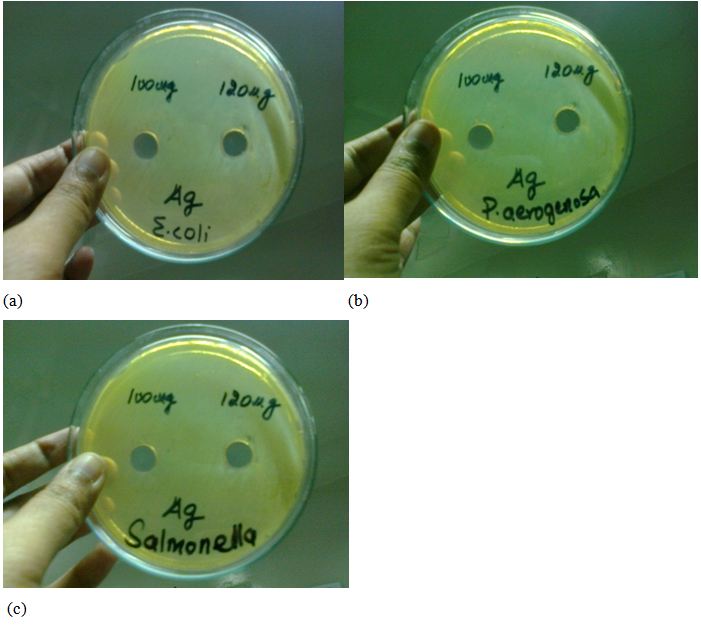
The synthesized Ag nanoparticles were also tested against Escherichia coli, Salmonella type and Pseudomonas aeruginosa but no prominent inhibition zones were observed against this type of bacteria upto 100ug/ml to 120ug/ml which shown in the image given below see Figure 8a,b and c (Table 2).
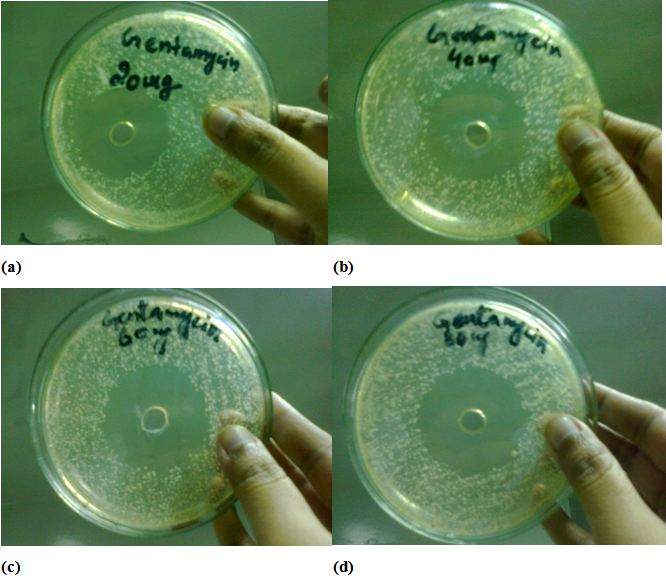
The Antimicrobial activity of Gentamicin the antibiotic substance which is being used in medicines, has depicted the inhibition zones against s.aureus, used as standard for comparative study for assurance and certainty of same antibacterial activity done and observed by Ag Nanoparticles, also depends upon concentrations, as the concentrations of gentamycin increases zone of antibacterial activity increases. Hence it is ensured that the Ag nanoparticles maybe more effective as antibacterial agent and have good gesture to overcome the issues concerning to antibacterial efficacy see Figure 9a,b,c and d (Table 3).
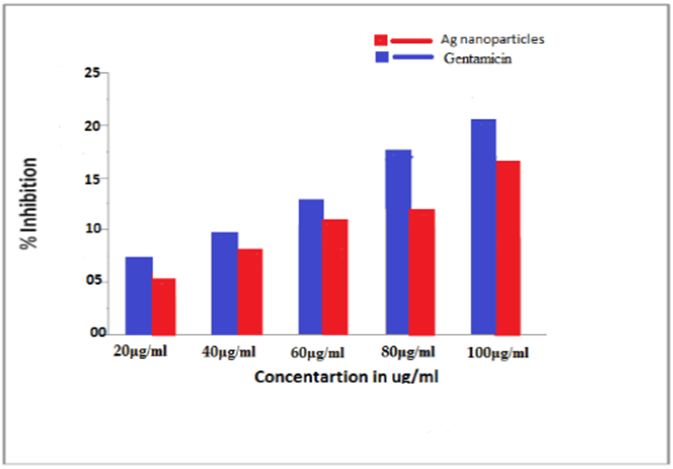
The Antimicrobial activity of Gentamicin the antibiotic substance which is being used in medicines, has depicted the inhibition zones against s.aureus, as compared to Ag Nano particle are given below see Figure 10.
The minimum inhibition concentration (MIC) were study for different strain of bacteria in the disc diffusion assay. The silver nanoparticle were first dissolved in 3% dimethylsulfoxide (DMSO) and diluted to 20 μg/ml be tested and then serial two-fold dilutions were made in a concentration range from 0.312 to 20 μg/ml in 10 ml sterile test tubes containing nutrient broth. MIC values of the silver nanoparticle againstbacterial strains were determined based on a micro-well dilution method as previously described (Table 4).
The effect of silver ion on microbe can be observed by the structural and morphological changes however the mechanism of action is not properly understood. One of the best mechanism is suggested that when the DNA molecule of microbes are in relaxed state the replication of DNA can be effectively conducted. When the microbial DNA are treated with silver ions it loses its replication capability due to turns into condense form and stop the cell division which leading to cell death. Another reported explore the direct attachment of heavy metal including silver ions with the sulfur containing thiol group of bacterial membranes proteins which able to attached with the cell as well as with DNA of microorganism [16]. The efficient antimicrobial property of silver ion derived from Aloe Vera as compared to other metal ion is due to their extremely large surface area, small size and essential oil component of Aloe Vera leaves which provide batter attachment and enhancement there antimicrobial activity. The antifungal activity mechanism of silver ion has not yet been proposed but silver nanoparticle also show best antifungal activity as well.
In our research study we found that Aloe Vera extract leaves could prove to be a good source of Silver Nano-particles. Type of synthesis used in our research study is called green synthesis and has many advantages, as it is eco-friendly, economically viable. There also many medical advantages (wound healing) in these Nano-particles. The reduction of silver ions and stabilization of the silver Nanoparticles was thought to occur through the participation of Leaf proteins and metabolites. Most importantly, the reaction was simple and convenient to handle, and it is believed that it has advantages over other biological syntheses. Silver nanoparticle exhibit a dark yellowish brown colour in aqueous solution due to surface Plasmon modification resonance phenomena. All Ag Nano particles were produced by green synthesis and were characterised by using FTIR Technique. The UV-Visible Analysis not only confirms the presence of silver Nano particles but also show the reaction time on absorption intensity. As the reaction time increases, absorption intensity increases because size and concentration of Nano- particles increases. Anti-microbial activity of these silver Nano particles was evaluated against Escherichia coli, Staphylococcus aureus showed high efficacy of Silver Nano particles as a strong anti-bacterial agent.
The authors are grateful to the Department of chemistry Hazara University Mansehra and National Centre for physic Islamabad for providing chemical and give all the lab facility do this research work and characterization of all the sample also. The authors would also like to thank Scholarena publishers for providing full wavier for publication of our research article in Journal of Nanoscience and Nanotechnology Application.