PAHs Behavior and Graphitization Degree of Soot in a Hexane Diffusion Flame
Pool combustion flame was analyzed using KrF Excimer laser optical system to characterize in-flame soot and its precursors such as polycyclic aromatic hydrocarbons (PAHs). Test fuel was hexane and it was a typical paraffin-type hydrocarbon fuel. Spatial distributions of PAHs and soot were measured using laser induced fluorescence (LIF) and laser induced incandescence (LII) diagnostics. Some of PAH concentrations were quantitatively obtained using gas chromatography (GC) system. As for the analysis of polymerization and graphitization process from PAHs to soot, Raman spectroscopy analysis was adopted. Peaks of G-band corresponding to the vibration mode of graphite lattice structure and D-band attributing to a disordered graphite lattice were detected. Further graphitization degree of soot was discussed using I(G)/I(D) ratio of Raman spectra and thermo-gravimetric analysis (TGA). Transition temperature from PAHs to soot was clearly obtained as the valley of PAH-LIF and soot-LII intensities. I(G)/I(D) ratio of PAHs in the later LIF stage was low, but it increased with a solidification progress from PAHs to soot. I(G)/I(D) ratio increased further when the soot inspection position approached downstream of the flame. Thermal decomposition temperature (TGA result) of sampled soot was elevated at the downstream position. Soot in high temperature region near the flame tip showed high I(G)/I(D) ratio and high decomposition/oxidation temperature, it means that graphitization of soot was well progressed near the flame tip.
Keywords: Particulate Matter; Soot; PAHs; PAH-LIF; soot-LII; Raman shift; Graphitization; Pool combustion; Hexane
Particulate matter (PM) emission exhausted from internal combustion engine is one of the major air pollutants, and its reduction in combustion field is strongly required for future development of automotive engine. In order to reduce the PM emission, many studies have been carried out on various combustion fields and PM emission becomes decreasing obviously [1-9]. In recent years, it has been known that nanometer size PM (nano-PM) is produced and exhausted from combustion fields of not only diesel but also gasoline engines. Even though a mass ratio of nano-PM in engine exhaust emission is low, its health effect is more serious than accumulation mode PM because of considerable number of nano-PM in the emission. Main part of nano-PM is nuclei mode PM of carbonaceous matter and is considered as primary particles of accumulation mode PM. Polycyclic aromatic hydrocarbon (PAH) is a kind of precursors of soot and accumulation mode PM. Sometimes it is considered that nuclei mode PM or nano-PM is the second stage precursor of soot because soot means carbonaceous particles in accumulation mode PM. Since formation mechanisms of nano-PM and soot are somewhat different, new technology concept to reduce nano-PM emission should be established to attain clean environment for human health. To make new nano-PM reduction concept, detail knowledge concerning PM formation and oxidation is necessary, and the new concept should be based on not only formation mechanism of soot but also formation mechanisms of PAHs and nano-PM.
The main component of PM is soot particles, which are formed through pyrolysis of fuel vapor and coagulation of polycyclic aromatic hydrocarbons (PAHs) [10]. Nano-PM is considered as intermediate particles during this formation process. Therefore, investigation of PAHs and nano-PM behavior in a flame is very important to understand the formation mechanism of soot and PM. Laser induced fluorescence (LIF) method is one of the powerful tools for non-intrusive measurement of PAH distribution in a flame as introduced in the literatures [11-18]. According to these previous investigations, number of carbon atoms in PAH molecule inside a flame was already estimated by LIF spectrum analysis [18]. Moreover, quantitative measurement of PAH concentrations in a diffusion flame was carried out using a gas chromatography (GC) system [19]. As for size and concentration measurements ofsoot particles, a laser induced incandescence (LII) diagnostics was carried out, and soot growth behavior in a flame was discussed by using LII results [19-21]. Also by these investigations, flame structure, spatial distributions of PAHs and soot inside the flame, and transition region from PAHs to soot were clarified.
However, more detailed discussions are required about PAH concentrations and PM (soot) characteristics. Especially, clear discussion based on the information of amorphous structure and graphite structure of primary soot (nuclei mode PM or nano-PM) existing in a combustion field is important in order to develop PM reduction technology [22-25]. For example, oxidation rate of soot depended greatly on the molecular structure of soot.
It was known that soot was composed with many graphene sheets and graphene sheet structure could be analyzed by Raman spectra analysis [26-28]. K. N. Kudin, et al. reported Raman spectra characteristics of graphite (G band) and defected graphene (D band) [29]. Raman spectra from carbon nanotube materials were physically and experimentally reveled [30-32]. F. V. Ferria, et al.. reported the relationship between Raman spectra and characteristics of functional graphene oxide [33]. Raman spectra analysis was also adopted as non-intrusive measurement of in-flame soot. Raman spectra of soot in flame was reported by K. Hayasida, M. Commodo, et al., P. Minutolo, et al.., and C. Guizani, et al. [23,34-37]. However there were few reports concerning the Raman spectroscopy investigation on practical diffusion flame of liquid fuels.
In this study, PAH and soot measurements and characterization such as graphitic feature of soot in a flame were performed using laser induced fluorescence (LIF), laser induced incandescence (LII), and Raman spectroscopy diagnostics. Gas chromatography (GC) analysis of PAHs and thermo-gravimetric analysis (TGA) of soot were also used to obtain the detailed information of PAHs and soot. Using these results, spatial distributions of many kinds of PAHs in the flame and progress from PAHs to soot were discussed with the feature of soot that was produced from PAHs. Almost all fundamental previous research works were performed on gaseous fuels owing their easy handling but main composition of practical liquid fuel for internal combustion engine was paraffin and iso-paraffin-type hydrocarbons. Then pool combustion flame of liquid hexane was chosen as the target of investigation.
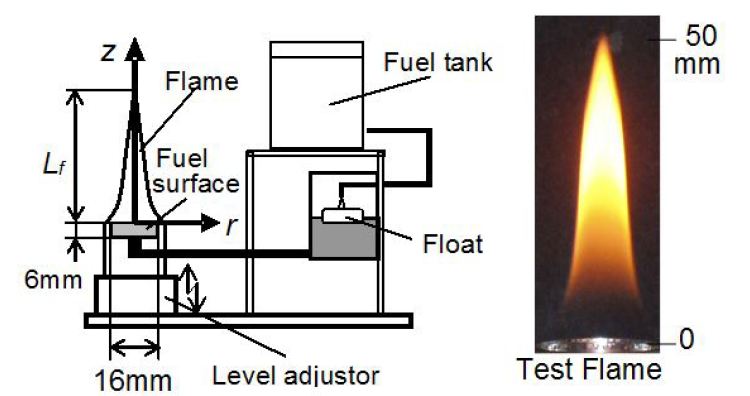
Pool combustion equipment was used to form a laminar diffusion flame of liquid fuel. Figure 1 shows the scheme of equipment. This equipment could provide small pool flames of various liquid fuels for fundamental investigation. Test fuel was hexane (C6H14) and it was a typical paraffin-type hydrocarbon fuel. Since paraffin and iso-paraffin hydrocarbons are the main composition of commercial gasoline, the fundamental investigation of PAH formation from paraffin or iso-paraffin type hydrocarbons had to be investigated. Then a hexane diffusion flame of which height was around 45mm was chosen as the test flame of this study. Combustion equipment consisted of a fuel tank, a fuel supplying system, a fuel pool and an electric microbalance. A liquid hexane was supplied from the fuel tank through a float chamber. Inner diameter of the pool was 16mm, and 6mm in depth. The float chamber could keep the fuel surface at a constant level. The fuel consumption rate Mfand flame length Lfwere adjusted with the fuel surface level. The weight of the equipment was measured by the electric microbalance and Mf was derived from the weight loss of it.
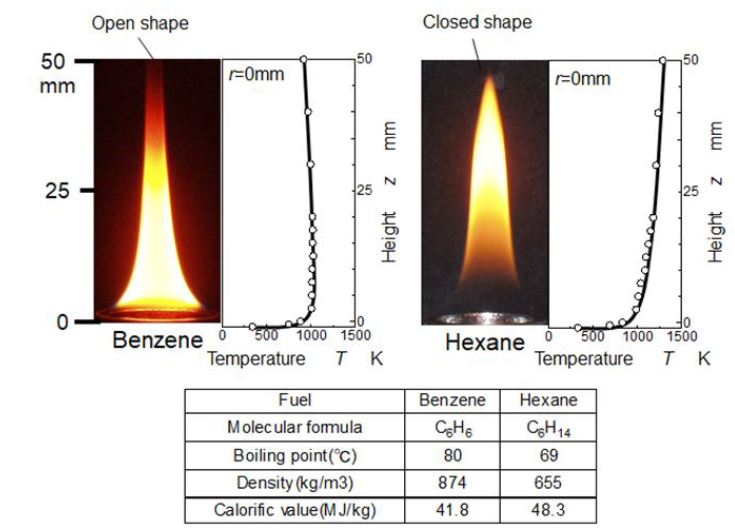
Typical pool flames of benzene and hexane are shown in Figure 2. These two flames were formed using same pool flame equipment and same fuel consumption rate. The main apparent difference is sooting and non-sooting flames [19]. Benzene flame has open flame tip and soot is emitted, but hexane flame has closed flame tip with no soot. Both of flames have luminous yellow flame zones. However temperature distributions along the center axis of flames and locations of luminous part of flame are different. The luminous part in hexane flame located far downstream than the benzene flame. It suggests that PAHs and soot formation process in hexane flame is slowly processed than the benzene flame. Further sooting and non-sooting seem to depend on the temperature level near flame tip.
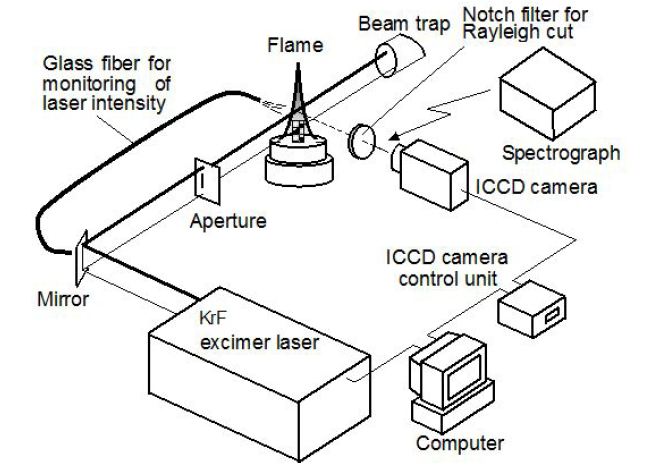
The laser diagnostic system used here consisted of an Excimer laser (Lambda Physik, LPX-150T) and an ICCD camera (La-Vision, FlameStar-II). Figure 3 shows the optical arrangement of the system [19]. A narrowband KrF Excimer laser (maximum pulse energy: 450 mJ/pulse, pulse width: 20 ns) was used to detect spatial distributions of PAHs and soot in the flame. Laser light was arranged into a sheeted beam (0.5 mm × 20 mm) by an aperture and was introduced into the flame. Wavelength of the laser was tuned at 248.469 nm that was the off-resonance wavelength of OH molecules. A 248±4 nm notch filter was set to eliminate the elastic scattering from the molecules and soot particles. LIF image from PAHs and LII image from soot particles were captured using the ICCD camera. In general, life-time of LII emission light was longer than that of LIF emission. Then, LII image except LIF emission (short fluorescence life time) was taken by long delayed timing (longer than 100 ns) of the camera gate. Using LII subtracting procedure, real LIF image could be obtained from light emission image containing both of LIF and LII emissions [16]. This method was previously developed and introduced in the literature as a temporal resolved method [17].
Raman spectrograph system consisting of an Excimer laser, a spectroscopy and an ICCD camera was used in this study. This optical system is also included in the equipment shown in Figure 3. Excimer pulsed laser wit wavelength of 248.469 nm (same as LIF andLII) was arranged as 0.5 mm dia. beam. Average power of the laser was 50 mJ/pulse. Notch filter to remove the Rayleigh emission was also used. Raman scattering light emitted from PAH molecules and soot on the center line of the flame was introduced into the spectroscopy (Chromex, 250IS, 100 grooves/mm). Raman emission spectra separated by the spectroscopy was detected with the ICCD camera. ICCD camera delay was 120 ns and exposure period was 20 ns. Raman spectra images of 20 pulses ×10 times runs were averaged in data processing system.
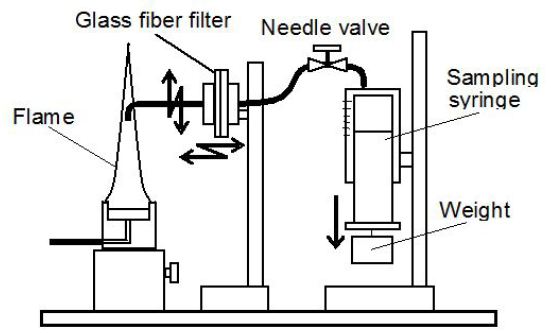
Figure 4 shows the PAHs and PM sampling system used here. The sampling system consisted of a stainless probe of 2.5 mm inner diameter, a glass-fiber filter, and a gas sampling syringe. In the case of PAHs sampling, combustion products containing PAHs were directly sampled by the probe. PM in the sampled gas was eliminated by the filter, and gas phase species were captured into the syringe. Then, gas phase species in the syringe were analyzed by a specially tuned GC (SHIMADZU, GC-14BP + GC-14BPF). In the case of PM composition analysis, PM captured by the glass-fiber filter was taken as a sampled substance. PM on the filter was introduced into by a combustion type PM analyzer (HORIBA, MEXA-1370PM), and mass concentration of soot was measured as the main component of PM (the PM analyzer could measure mass concentrations of dry-soot, SOF and sulfate). Here SOF means solvable organic fraction in PM.
Thermal decomposition analysis of PM was also performed for the sampled substance captured on a glass-fiber filter. A thermo-gravimetric analyzer (TGA; ULVAC-RIKO, TGD9600) was used in this analysis. Since the ambient gas in TGA was air, it could measure mass loss caused by thermal decomposition and oxidation. Here, heating rate of TGA was set at 4 K/min. It was low enough to neglect exothermic/endothermic reaction effect, and heating temperature was in a range from room temperature to 1270 K.
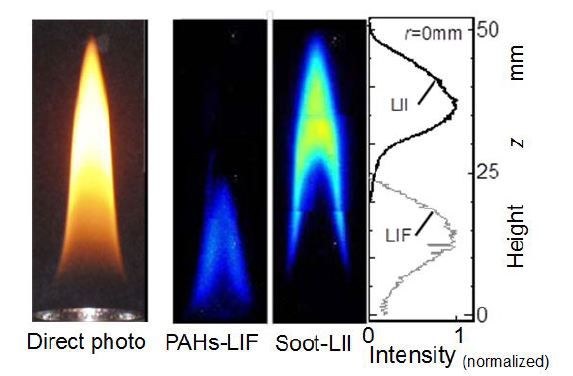
General feature of a hexane pool diffusion flame was investigated as the start of this study.Figure 5shows visible appearance of a small hexane flame investigated and its LIF and LII images obtained by laser irradiation. Tested flame was a typical diffusion flame having closed flame tip and exhausted no obvious soot from the tip. Luminous yellow appearance and no soot emission meant that soot formed inside the flame was almost completely burned before it reached to the tip.
Middle two images in the Figure are tomographic views of LIF and LII. These images were obtained by the temporal resolved method. Since the sheet width of illumination laser was 20 mm, three average images of bottom, middle and top part of the flame were combined. Intensity distributions of LIF and LII on the center axis of the flame are also summed up in this Figure. Since PAHs were formed through hydrocarbon abstraction process inside the flame, it was clear that the upstream image of laser induced light corresponded to LIF emission from PAHs. As for the downstream image, it corresponded to LII from soot. In a region from 20 mm to 30 mm apart from fuel pool (bottom), there was low emission intensity region on the center axis. In other words, there was a laser non-sensibility valley between PAH-LIF and soot-LII regions. It seemed that this valley is a transition region from PAHs to soot, and soot precursors such as heavier molecules than PAHs existed there. Temperature of LIF region was lower than LII regions as shown in Figure 2 (Flame condition was slightly different fromFigure 5). Using these LIF and LII results, the temperature condition of transition region of PAH to soot was later discussed in Figure 10.
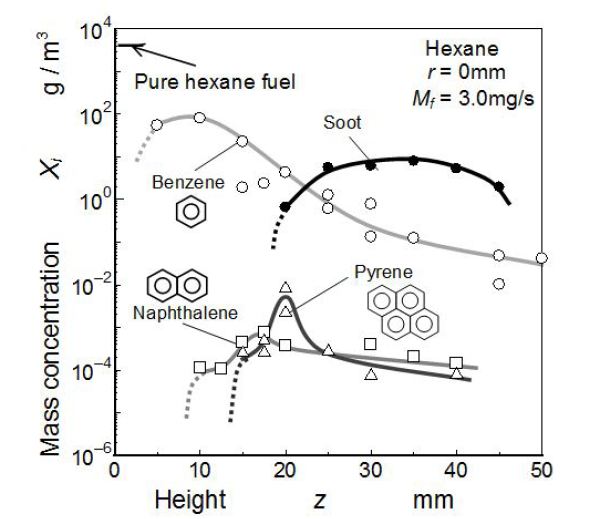
Mass concentrations of PAHs detected by the GC system and soot detected by the PM analyzer are shown in Figure 6. These were the GC results along the center axis of the hexane flame. Here, in order to make a direct comparison between PAH species and soot, all compositions were evaluated by mass concentration per unit volume of sampled gas of room temperature. Single ring aromatics (benzene), two ring aromatics (naphthalene) and four ring aromatics (pyrene) were detected clearly by GC and plotted in the Figure. Three ring aromatics like fluorene could not be detected by the GC analysis used here. Maximum concentration of pyrene was higher than naphthalene peak. Further its peak appeared at the LIF-LII valley mentioned in Figure 5. It suggested that pyrene was one of the key species in the transition process from PAHs to soot.
From the chemical scheme model of PAH growth used by K. M. Pang, et al.. and Y. An, et al. generally pyrene peak should appear at downstream position than naphthalene peak and it peak value should be lower than the naphthalene [38,39]. Then the GC results obtained here shows that more stable pyrene than the model existed in the hexane diffusion flame. Two ring and four ring aromatics in chemical structure of PAHs were pointed out by P. Desgroux, et al.. as key species for premixed methane flame [40]. Both of literatures and GC results obtained here suggested that naphthalene and pyrene were key precursor PAHs of soot formation. However mass concentrations of these two aromatics were two order lower than benzene and soot.
Benzene was detected in high mass concentration at the upstream part of flame. If we supposed that pure hexane vapor was sampled, its concentration was apparently 3.8x10³ g/m3. Then benzene concentration of 1.0x10² g/m3 that was detected as the maximum level, suggested that a few percent of hexane might convert to benzene (conversion ratio was 2.6 % at least). Since a mass concentration was a total result of formation and reduction, net conversion ratio from fuel hexane to benzene might be higher than this conversion ratio. Mass concentration of benzene rapidly decreased with an increase of the flame height.
Since, benzene emitted weak fluorescence light by the irradiation of 248 nm laser, the LIF image in Figure 5 corresponded to molecules other than benzene. Then the trend of LIF intensity along the axis did not consist with benzene decreasing. Naphthalene was not detected at the bottom position of the flame, it was detected in downstream than 10mm (z > 10 mm). The maximumconcentrations of it appeared at around z= 17 mm. The maximum concentration of pyrene appeared at around z = 20 mm. It was clear that the maximum concentrations of naphthalene and pyrene appeared downstream of the maximum point of benzene. It suggested that polymerization process from benzene to PAHs progressed there. After the clear peaks of these concentrations, they decreased rapidly with an increase of z. Although PAHs were not detected by LIF image in the sooting region (LII region of Figure 5), it was confirmed that some kinds of PAHs remained in this region.
As for the mass concentration of soot particles, it was detected at around z> 20 mm. Detectable region of soot and its peak were well corresponding to the LII result shown in Figure 5. Its mass concentration had the maximum at around z = 35 mm (10 g/m3). It is considered that soot was formed in a region from z= 20 mm to 35 mm. At z > 35 mm, soot mass concentration decreased with increasing of z. This decreasing trend seemed to be caused by soot oxidation. When the benzene concentration and soot mass concentration were compared, both concentrations showed almost the same level at transition region near z = 20 mm. However, naphthalene and pyrene concentrations were far lower than benzene and soot. Further, the concentration peak of pyrene appeared in the transition region from PAH-LIF to soot-LII. It means that the benzene was a kind of origin species of soot, and other PAHs such as naphthalene and pyrene were intermediate soot precursors changing smoothly to other heavier PAHs or soot.
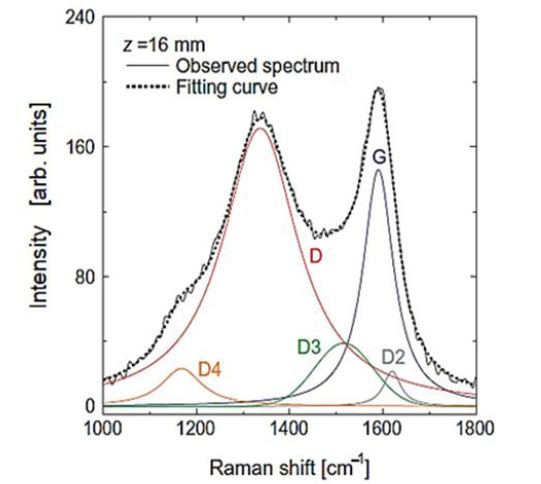
In this study, graphitic characterization of PAHs and soot particles inside the flame was performed with the Raman spectroscopy analysis [26-28]. Application methodologies of Raman spectroscopy on soot structure were well introduced by Hayashida, et al.., M. Commodo, et al.., P. Minutolo, et al.., and C. Guizani, et al. [23,34-37]. Figure 7 shows a typical Raman spectrum of soot in propane diffusion flame. Soot in the flame was excited by an Ar+ laser of 488 nm wavelength. The spectrum exhibits two broad and strongly over-lapping peaks at approximately 1340 cm-1 and 1590 cm-1 corresponding to the G and D peaks, respectively. The G peak represents the characteristic of an ideal graphitic structure, and the D peak is associated with the nature of disordered graphite. A detailed analysis of the spectrum reveals the presence of five bands. The G band is attributed to the ideal graphitic lattice vibration mode. The D band is associated with the graphitic lattice breathing mode, which is forbidden in the ideal graphitic lattice and becomes active only in the presence of disorder. The D2 band is attributed to the disorder-induced graphitic lattice vibration mode. The D3 band originates from the amorphous sp2-bonded forms of carbon, such as organic molecules, fragments, and functional groups. The D4 band is observed in the spectra of poorly organized materials such as soot and char, and is assumed to be due to the mixed sp2–sp3 bonds and/or the sp3-rich carbon structures, etc. More detail analysis of Raman spectroscopy from graphene were reported by researchers in carbon material field [23-33].
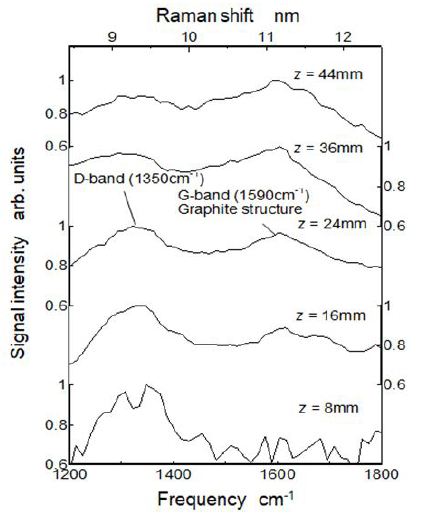
The Raman shift spectrum detected by the spectroscopy at various height positions along the center of the tested hexane flame are shown in Figure 8. It shows the Raman scattering spectrum shifted from irradiation laser wavelength (248.469 nm). As the physical feature of Raman shift, shifted light emission was independent from excitation wavelength [41,42]. Since the test flame was a luminous diffusion flame of hexane, profiles of the Raman shift was distorted from the typical Raman shift profiles in the literatures. It means that there were many species producing optical noises on the Raman shift profiles. Even though the optical excitation wavelength was different and profiles of Raman shift were distorted, we could discuss the PAHs and soot behavior comparing the reference results shown in Figure 7.
Here, the spectrum indicated by 8 mm was the Raman shift spectrum at 8 mm apart from flame bottom and the 44 mm spectrum was the Raman shift spectrum near the flame tip. From this Figure, Raman shift frequencies of around 1350 cm-1 (1350 kayser) and around 1590 cm-1 were clearly recognized. However D2, D3 and D4 bands shown in Figure 7were not recognized independently, and observed profile of the Raman shift was a combined profile of all shifts explained in Figure 7.
Generally, Raman spectrum of around 1590 cm-1 (G-band) was emitted from graphite as “sp2” sites, and Raman spectrum of around 1350 cm-1 (D-band) was attributed to a defect from graphite lattice. D-band spectrum was forbidden in perfect graphite lattice and only became active in the presence of disorder. In other words, D-band spectrum suggested the existence of molecules such as PAHs and PAH like structure soot. Clear peak of D-band appeared at upstream region of the flame, whereas clear peak of G-band appeared at the downstream. This phenomena was reported by C. Russo, et al.. as a feature of young soot and by M. Commodo, et al.. as a process of nucleation of soot particle [34,43]. However, there was no clear transition region from D-band to G-band. It suggested that total concentrations of PAHs did not decrease in the LIF-LII transition region shown in Figure 5. It could be considered that the LIF emission intensity did not agree to the total PAH concentrations, because LIF sensibilities were different depending on various PAH species. G band peak was detected more upstream position than LII image detection. It might be considered that some of heavier PAHs had graphitic structure.
From the comparison of the intensities of 1200 cm-1 in Figure 8 and Figure 9 , it was estimated that near D4 band intensity (0.9 arb. units) at z = 36 mm in Figure 8 was extremely higher than that of general Raman spectra model shown in Figure 7. F. Negri, et al.. estimated near 1300 cm-1 Raman spectra for PAHs. F. Russo, et al.. mentioned that D4 band was detected in some soot samples and PAH molecules showed few modes around 1300 cm-1 [42-44]. Then our data shown in Figure 8 suggested that some PAHs were formed and still existed in the sooting region.
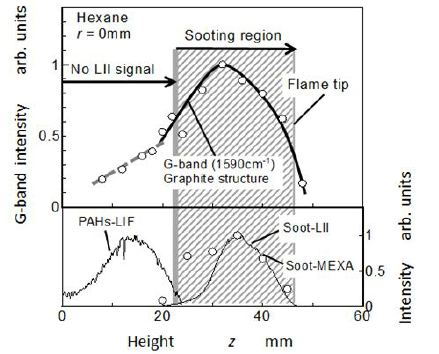
Relative intensity of G-band spectrum peak (1590 cm-1 ) along the flame center was shown in Figure 9 with relative intensities of PAH-LIF, soot-LII, and soot mass concentration. G-band spectrum was normalized by its peak value. From 20 mm height to the flame tip, high relative intensity of G-band was attributed to soot structure inside the flame. However, G-band frequency shift was also detected near the bottom (z < 20 mm), even though LII image and PM analysis showed that there were no soot particles in there.
As for the relative intensity of G-band spectrum in sooting region, its trend along the flame height agreed with increasing and decreasing trends of LII intensity and soot mass concentration. In the region from z = 20 mm to 30 mm, relative intensity of the G-band increased with flame height. It means that quantity of the graphitic soot (included PAHs) increased with flame height. Beyond 36 mm in height, its intensity decreased by oxidation process of the soot.
On the other hand, spectrum intensity of G-band in non-sooting region (z < 20 mm) was very low but appeared increasing trend with flame height. At upstream region of z< 20 mm, the G-band frequency seemed to be attributed to aromatic ring structure molecules other than soot particle. It was considered that the G-band spectrum at upstream region was due to PAHs having aromatic rings. If the G-band spectrum was attributed to benzene ring, it could be considered that quantity of benzene ring might increase with flame height. However, the result indicated in Figure 6 shows that benzene concentration decreased actually with height. It also suggested that the low G-band spectrum at this region was caused by PAH molecules other than benzene.
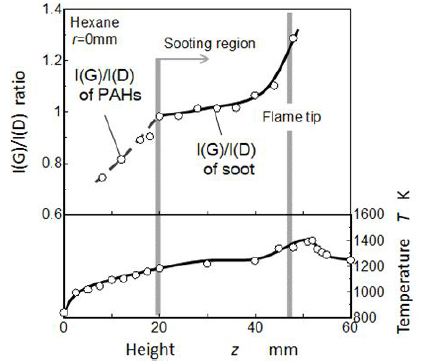
In order to investigate graphitic degree of PAHs and soot, I(G)/I(D) ratio (peak height ratio of G-band intensity to D-band intensity) on the center axis was plotted as shown in Figure 10. Here, high value of the I(G)/I(D) ratio means high graphitic degree (disorder in the graphitic lattice was low) of soot. When we discussed the defect level of graphite, I(D)/I(G) was reasonable. For example, GrG soot (spark discharge generation soot by GfG 1000, (Palas GmbH Germany)) showed I(D)/I(G)≅1.0, but it contained no HC compositions [41]. However I(G)/I(D) was convenient to discuss the transition from PAHs to soot because of attribution of heavier PAHs to D-band [44].
Temperature distribution on the flame center axis obtained from thermocouple (Pt-PtRh 13%) readings was also shown in this Figure. It took the maximum at the decreasing zone of LII image where soot was burned out completely. Note luminous flame appearance was the characteristics of diffusion flame sheet located outside boundary of the flame. Sooting region where LII signal and obvious G-band Raman shift were observed, was corresponding to downstream region of its temperature being higher than 1200 K. It suggested that the transition from PAHs to soot took place in higher temperature region than 1200 K.
In the non-sooting region (below z = 20 mm), value of I(G)/I(D) ratio was low but increased with flame height. In other words, concentrations of molecules having benzene ring structure increased. It means that increase of I(G)/I(D) ratio is a kind of index for polymerization of PAHs. As for the sooting region, I(G)/I(D) ratio was high. When sampling position approached downstream part of the flame, the I(G)/I(D) ratio increased more. It means that graphitization of soot was processing there. Especially, the I(G)/I(D) ratio raised up rapidly at the flame tip. The trend of I(G)/I(D) ratio had similar pattern with temperature rise up shown in the lower part of Figure. It seems that graphitization process of soot was controlled with flame temperature. In other words, graphitization process of soot was strongly accelerated in a high temperature oxidation region. This process was also reported by Y. Liu, et al. for methane flame [25].
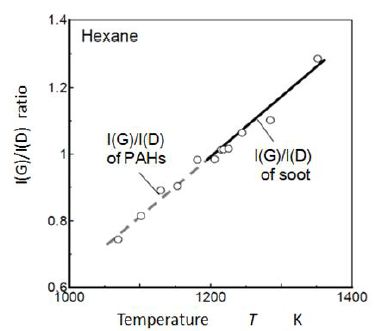
Figure 11 shows the relationship between local temperature and I(G)/I(D) ratio. It was the rearrangement of Figure 10. I(G)/I(D) ratio increased linearly with temperature. In the hexane flame investigated, temperature on the flame axis increased monotonously from the bottom to the flame tip. Then this relationship had two meaning. One was a simple relationship between temperature and I(G)/I(D) ratio. The other was that it showed a growth process from PAHs to soot because temperature increase corresponded the conversion process from PAHs to soot. Based on the meaning of simple temperature effect on I(G)/I(D) ratio, lowest temperature for graphitic predominant PM was 1200 K. This temperature corresponded the final oxidation temperature of fine graphite carbon shown in the TGA result shown in Figure 12. It means that soot/PM in sooting region in Figure 10 could be easily oxidized when enough oxygen was supplied.
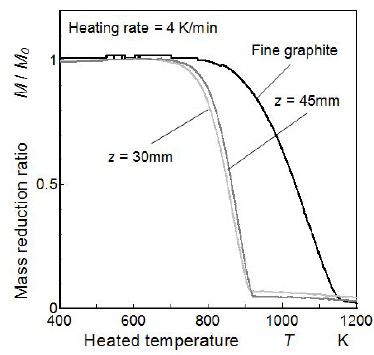
PM including soot and other substances such as SOF was analyzed using the TGA. PM captured on the glass-fiber filter was heated gradually in atmospheric air condition from room temperature to 1270 K, with heating rate of 4 K/min, and mass loss caused bydecomposition and oxidation was analyzed. PM samples captured at 30 mm and 45 mm height were analyzed here. In addition, the fine graphite carbon was also analyzed to obtain reference oxidation data for comparison. Results of the TGA analysis are shown in Figure 12. TGA result of each sample was normalized by the test sample mass (M0). Since the mass reduction caused by vaporization of moisture and other substances such as high volatile PAH was negligently small. The mass reduction trends over 400 K were summarized in the Figure.
As for the PM sampled from highest concentration position (z = 30 mm, in-flame PM), TGA analysis showed that mass of PM decreased with high rate in a temperature range from 700 K to 910 K. This temperature range was lower than the fine graphite, but 50 % mass reduction temperature was almost same as carbon nanotube oxidation temperature (around 870 K) [30]. Further this oxidation temperature range was around 100 K lower than the oxidation range of diesel soot captured in diesel particulate filter [46]. It means that in-flame soot was young-soot and more easily oxidized than diesel soot [43].
Since PM mass reduction caused by SOF decomposition had to be detected during a heating period lower than 700 K, it was considered that PM mass reduction in a heating period higher than 700 K was caused by the oxidation of soot in PM. Starting temperature of reduction for the PM sample of z = 45 mm was slightly higher than the starting temperature for the PM sample of z = 30 mm. Temperature difference of around 30 K was estimated in oxidation start temperatures of two samples. Generally, thermal decomposition temperature of the graphite soot became high with decreasing of the disorder degree in graphite structure. According to the I(G)/I(D) ratio shown in Figure 10, more graphitized and less disorder graphitic soot was the feature of PM sampled from flame tip (z = 45 mm, end-flame PM).
The Raman spectroscopy analysis shown in Figure 10 was non-intrusive analysis of PM in the hot flame, but PM oxidation analysis was performed on the solid PM sampled by a probe and quenched in the probe. In other word, I(G)/I(D) ratio indicated the structure of hot PM. Since quenching process in the probe was a kind of graphitization process with cooling and it was the reason why there was small difference in TGA profiles.
The starting temperatures of mass reductions of both samples were far lower than that of fine graphite carbon. It means that soot in PM formed inside the flame had amorphous like structure even though the graphite feature was observed by Raman shift spectroscopy. Further, at around 850 K, more rapid mass reductions than the fine graphite were observed for both PM samples. It suggested that PM contained high temperature volatile SOF such as heavier PAHs.
Graphitic characteristics of PAHs and soot inside a diffusion flame of hexane fuel were analyzed using laser diagnostic and direct sampling. PAH-LIF, soot-LII and Raman shift spectrum were used to discuss conversion process from PAHs to soot. Main results are summarized as follows.
(1) In non-sooting hexane diffusion flame, more than 2 % mass of hexane changed to single aromatic molecule like benzene. (2) There was a transition valley between PAH-LIF and soot LII regions. The concentration peak of pyrene took the maximum at this valley region. (3) The G-band Raman spectrum could be detected in the PAHs existing region (non-sooting region) even though the relative intensity of G-band was low. Its intensity increased with flame height. Polymerization of PAHs was considered as the reason of this increase. (4) As for the sooting region, when sampling position approached downstream part of the flame, the I(G)/I(D) ratio of Raman spectrum and thermal decomposition temperature obtained by TGA increased. It means that graphitization of soot was processing in this region and it was well correlated with temperature distribution along the flame height. (5) TGA experiment showed that in-flame PM is easily oxidized than end-flame PM. It caused loose structure of in-flame PM.