Patented Breakthrough in Control of Poultry Coccidiosis and Satisfying the One World One Health Strategy of FAO/OIE/WHO
A patented breakthrough in control of poultry Coccidiosis, and satisfying the ‘One World One Health’ strategy of Food and Agriculture Organization (FAO)/ The World Organization for Animal Health (OIE)/World Health Organization (WHO), is based on the hypothesis of dual approach of decontaminating poultry barns by an invented Wide Spectrum Disinfectant (WSD) and intermittent supplementation of drinking water with natural Essential Oil Blend emulsified in Water Extract (EOBWE) of plants. The first nine trials were concluded in isolation unit facilities and laboratories, while the other four were field trials. These first nine trials had different objectives including, studying the protection against coccidiosis by intermittent or continuous administration of EOBWE in drinking water against controlled challenge by sporulated oocysts of Eimeria spp, administered intra-esophageally or through contaminated floors of rearing pens. Another objective studied the effect of different concentrations of EOBWE and WSD on lysis of Eimeria oocysts and inhibition of wide spectrum of poultry microorganisms, while other objective compared the control of coccidiosis in broilers by the invented dual approach of applying WSD and EOBWE versus the application of classical disinfectants and synthetic coccidiostats. The first three field trials compared the dual intervention by classical disinfectants and synthetic coccidiostats versus the invented intervention by WSD and EOBWE against field challenge of broilers by Eimeria spp. The fourth trial compared the impact of synthetic coccidiostat alone versus concurrent administration of both the synthetic coccidiostat and the EOBWE on protection of broilers against field challenge by Eimeria acervulina spp. The compiled data of this global research led to comprehensive control of poultry coccidiosis, manifested in significant reduction of oocysts output and its associated Eimeria lesions, and consistent improvement of the chicken performance.
Keywords: Breakthrough; Coccidiosis; Control; Poultry
Coccidiosis is the most economic protozoan disease, affecting poultry industry worldwide, resulting in an estimated annual loss of more than four billion US dollars [1]. It is documented that eight species of this protozoa are pathogenic in chicken namely, E. acervulina, E. brunetti, E. hagani, E. maxima, E. mivati, E. necatrix, E. praecox, and E. tenella [2-4]. The continuous supplementation of coccidiostats in feed did result in the emergence of drug-resistant Eimeria strains, and sporadic residuals of drugs in poultry products, creating a concern in consumers [5,6]. The Food and Agriculture Organization of the United Nations (FAO), the World Organization for Animal Health (OIE) and the World Health Organization are in continuous collaboration, embracing the “One World One Health” strategy in which they reaffirm that the human, animal, and environmental healths are inseparable. Accordingly, the three organizations documented their second Tripartite’s strategy in October 13, 2017 (FAO, OIE, WHO, 2017), targeting food safety and security [7]. It is documented that the synergistic multiplicity of active ingredients, present in disinfectants, essential oils and water extracts of plants, makes it difficult for bacteria, viruses, yeasts, and protozoa to develop a resistance to it [8,9]. The aim of this work is built on the hypothesis of dual intervention approach by an invented disinfectant (WSD), with multiplicity of active ingredients that inactivate a wide spectrum of economic poultry pathogens, and intermittent supplementation of poultry-drinking water by natural Essential Oil Blend emulsified in Water Extract (EOBWE) of plants, also with multiplicity of active ingredients, that could result in a comprehensive control of poultry coccidiosis and avoidance of synthetic drugs, aiming at healthier poultry products to consumers [8].
The materials and methods of the compiled 13 experiments aimed at evaluation of a new method for control of coccidiosis in poultry by dual intervention with an invented Wide Spectrum Disinfectant (WSD) to decontaminate the surfaces of rearing area, followed by intermittent supplementation of drinking water with invented Essential Oil blend in Water Extract (EOBWE). The invented WSD is constituted of chloro-m-cresol polymeric biguanides (30%), organic per acetic acid (15%), inorganic phosphoric acid (15%), anionic dodecyl benzene sulfonic acid surfactant (10%), completed to 100% by water. However, the invented EOBWE is a mixture of essential oils, emulsified in water extracts of herbs [10,11]. More specifically, the EOBWE is an oil-in-water emulsion, in which the water phase contains extract of Salvia libonitica, while the oil phase contains a blend of essential oils generated by eucalyptus and peppermint. This natural coccidiostat is constituted of 10% (v/v) water extract of Salvia libonitica, 10% (v/v) eucalyptus essential oil, 10% (v/v) peppermint essential oil, and a saponin emulsifier (45 – 55%). The water extract is prepared in a ratio of plant leaves to water equivalent to 1/5 (w/w).It is worth noting that in controlled challenges, the nature of the different inocula are described in Experiments #6 to #9.
Was performed at Leipzig University, Germany. Briefly the % lysis of E. tenella-sporulated Oocysts (25,000 oocysts/ml) was determined by their contact with 3% and 4% dilutions of the invented WSD for periods of 30 to 120 minutes vs. control Oocysts deprived of contact with WSD [12]. The WSD dilutions were prepared fresh before contacting the Oocysts. The sporulation of the Oocysts was confirmed under light microscopy. The control oocysts deprived of contact with WSD were of same count as that for experimental tests (25,000 oocysts/ml).
Performed also at Leipzig University, Germany, studied the infectivity in day-old chicks (N = 10/treatment) by sporulated Oocysts of E. tenella (2000 Oocysts/chick) that were previously contacted with 3 % WSD for 120 min (Treatment #1) vs. infectivity by non - contacted Oocysts with WSD (Treatment #2), following the guidelines of the German Veterinary Medicine Society, while controls were deprived of any challenge (Treatment #3) [12]. The oocysts contacted with the WSD were administered esophageally to each of the 10 chicks in Treatment #1 (2000 oocysts/chick), while the positive control chicks of Treatment #2 received the same count of oocysts that were deprived of contact with WSD, and the negative control birds were all deprived of the oocyst challenge.
Performed by Opticon Co. in Switzerland and American University of Beirut - AUB, examined the susceptibility of poultry - associated bacteria and viruses upon contact with 3% dilution of invented WSD for different periods namely, 5, 15, 30, and 60 minutes. The tested bacteria were E. coli, Streptococcus spp., Salmonella Enteritidis, Proteus mirabilis, while the tested viruses were New Castle Disease virus (Lentogenic) and Avian Influenza (H9N2). The bacterial count before contact was adjusted to 2.0x10⁷ CFU/ ml, while the viral Hemaaglutinating (HA) Units before contact was set at 4.0. Each test was performed in triplicate. The counts of the bacteria were determined after each contact time by serial dilution, using sterile saline, followed by plating of each dilution on triplicate plates of Muller Hinton Agar, and incubation for 24 hours to count the surviving bacteria. The allontoic fluid of embryonated chicken eggs, containing each of the two viruses, was serially diluted after each contact time with the WSD, and a volume of 0.1 ml of each dilution was injected in 10 day-old chick embryos in triplicate, incubated for 3 days at 37 °C, and the allontoic fluids of the embyonated eggs were tested for its ability to agglutinate a 1% suspension of Chicken Red Blood Cells (RBC). The % reduction in bacterial counts after contact compared to initial count was determined. In addition, the absence of agglutination is indicative of loss of viability of the virus to replicate in the allontoic membrane due to its contact with WSD, in comparison to sustainability of the viral viability in control viruses that were deprived of contact with WSD.
Performed at AUB, determined the needed contact time between Oocysts and different dilutions of EOBWE for obtaining a maximum lysis. The total Oocyst number in each test was 25,000/ml of equivalent number of 8 Eimeria spp (E. acervulina, E. brunetti, E. hagani, E. maxima, E. mivati, E. necatrix, E. praecox, and E. tenella). The developed EOBWE was used in four different dilutions of 0.005, 0.010, 0.020, and 0.100%. The contact times were 30, 60, 90, 120, and 180 minutes. Control Oocysts count of 2500/ml were kept in contact with saline. All tests were accomplished in duplicate. The % lysis was determined by comparing the oocyst count in experimental tests, after the oocysts were contacted with EOBWE, to that of control tests in which the same initial count was used, while depriving the oocysts from contact with the developed EOBWE. The count of oocysts was done in a McMaster chamber, under a light microscopy set at magnification of 400X.
Performed by Opticon Co., Switzerland and AUB, aimed at evaluation of the susceptibility of poultry-associated bacteria and viruses to invented EOBWE, using the same above protocol, presented under Experiment #3, and each test was accomplished in triplicate.
Performed by KAU of KSA and AUB, Lebanon, evaluated the protection in Eimeria - challenged broilers by single intervention, using continuous ad libitum administration in drinking water of the natural EOBWE, at a dilution of 0.025%. The challenge was esophageal, at different ages of 14, 21, 28, and 35d, with equivalent number of sporulated Oocysts of 8 Eimeria spp (E. acervulina, E. brunetti, E. hagani, E. maxima, E. mivati, E. necatrix, E. praecox, and E. tenella), totaling to 1.76x10⁵ oocysts/bird. The four treatments were: G1 (Unchallenged – Untreated with EOBWE), G2 (Unchallenged – Treated with EOBWE), G3 (Challenged –Untreated with EOBWE), and G4 (Challenged-Treated with EOBWE). Equal number of birds (n=10) were sacrificed at 6 days-post the time allocated for each challenge for assessment of broiler’s production parameters, intestinal lesion scores and Oocyst counts. The assessed production parameters were weight increase in the period of 6 days post challenge of birds in each treatment, and the feed conversion ratio to live body weight in the period of the 6 days post challenge, calculated by dividing the feed consumption of birds in each treatment over the weight gain during the 6 days multiplied by 100. The intestinal lesion scores were recorded in a range of 0 to 4. The zero score is given for absence of lesion, while the 4 is for severe inflammation, associated with bleeding, and sloughing of epithelial layer. The score of 1, 2, and 3 are given to the different degrees of inflammation that are below the severe stage. Each intestinal organ was observed for recording the gross lesion scores, including the duodenum, jejunum, ileum, and cecum. The oocyst count per each gram of intestinal organ was determined for each bird, using homogenization of one gram of the intestinal organ in saline, floating of the oocysts at meniscus of the 37% NaCl solution, and counting the floated oocysts by McMaster Chamber under light microscope set at 400X.
Performed at isolation unit of Poulpharm BVBA, Belgium, targeting the evaluation of protection in broilers thast were challenged by sporulated oocysts of 6 Eimeria spp. at single age of 17d, using Maxiban-coccidiostat in feed versus continuous ad libitum administration in drinking water of the natural EOBWE, at a dilution of 0.025. The esophageal challenge was with the following number of Oocysts: Eimeria acervulina (7.4x10⁴), E. maxima (1.6x10³), E. tenella (6.8x10³), E. mitis(7.8x10³), E. necatrix (7.0x10³), and E. praecox (7.0x10³). The three treatments, each with 8 replicate cages containing 5 birds/cage were: TRT #1 (Challenged-Untreated), TRT #2 (Challenged-Treated with Maxiban), and TRT #3 (Challenged-Treated with EOBWE). The Maxiban inclusion rate in the feed was according to the manufacturer instruction. Birds were sacrificed at 6 days-post challenge for assessment of the production parameter, intestinal lesion score, and Oocyst output, using the same procedure as that described under Experiment #6.
Performed at isolation units of Nagpar Veterinary College, India, evaluated the protection in broilers, challenged by contaminating the floor of pens at stocking time of one-day old chicks, with equivalent number of local Eimeria spp., totaling to 4x10⁵ sporulated oocysts/m2, and treated intermittently with different dilutions of EOBWE (0.005, 0.010, and 0.025 %) at the following ages 4-6, 10-12, 18-20, 24-26, and 31-33 days of age vs. continuous treatment with Salinomycin coccidiostat in feed. The five treatments were: TRT #1 (Challenged-Untreated), TRT #2 (Challenged-Treated with 0.005% EOBWE), TRT #3 (Challenged-Treated with 0.010% EOBWE), TRT #4 (Challenged-Treated with 0.025% EOBWE), and TRT #5 (Challenged-Treated with salinomycin supplemented feed). Each treatment had duplicate pens, with 20 birds/pen. The inclusion rate of salinomycin in the feed was according to the manufacturer instruction (66 mg/Kg feed). Six birds were sacrificed per pen at each of 28 and 35 d of age for assessment of production parameters, and oocyst output/g of feces, following the same protocol that is described under Experiments #6 and #7, except that the count of oocysts in this experiment was per gram of feces and not per gram of intestinal organ.
Performed by AUB and KAU, aimed at evaluation of the dual approach, for protection of broilers against sporulated Oocysts - contaminated floor, by application of WSD vs. chlorine disinfection of the pens’ surfaces and intermittent treatment (3d/week) with 0.025% EOBWE in drinking water vs. Maxiban in feed. The floor was contaminated with a total sporulated oocysts of 4x10⁵/m2 of equivalent number of oocysts of 8 Eimeria spp. (E. acervulina, E. brunetti, E. hagani, E. maxima, E. mivati, E. necatrix, E. praecox, and E. tenella), followed by disinfection with invented WSD vs. chlorine disinfectant. The four treatments, with duplicate pens/treatment, and 500 birds/pen, were: TRT #1 (WSD disinfected floor – EOBWE in drinking water), TRT #2 (WSD disinfected floor – Maxiban in feed), TRT #3 (Chlorine disinfected floor – EOBWE in drinking water), and TRT #4 (Chlorine disinfected floor – Maxiban in feed). The dilution of applied WSD was at 3% dilution, applied in 400 ml/meter square, while the application of Chlorine disinfectant was according to manufacturer’s instructions. The oocyte output was determined at 14, 21, 28, 35 d age, while the feed conversion ratio (FCR), body weight, and cumulative mortality, up to 35th d of age, were reported as followed in the protocol of Experiments #6, #7, and #8.
Performed in the field by ANC Hayvan, Turkey, aimed at evaluation of the dual approach for controlling recurrent E. maxima outbreak on farms in Turkey. Two treatments were compared: TRT #1 (WSD decontamination of farm – intermittent administration of 0.0125% EOBWE in drinking water, 3d/wk) vs. TRT #2 (Classical disinfectant – administration of salinomycin in feed). The size of broiler flocks in Treatments 1 and 2 were 10,400 and 23,200 birds, respectively. The dose of E. maxima challenge in farm trial can’t be estimated. The WSD was applied at 3% dilution, in an amount of 400 ml per meter square, while the classical disinfectant and the salinomycin were applied according to manufacturer’s instructions. The live body weight, feed conversion, and mortality were determined and included in the European Efficiency Factor (EEF) formulae to determine and compare the efficacy of both treatments. It is worth noting that the EEF = Average weight gain (g)/day x % survival rate / feed conversion x 10.
Performed at Garo’s farm, Zahle, Lebanon, aimed at evaluation of dual approach for controlling coccidiosis. The two Treatments, with two barns/Treatment, and containing between 7,000 to 13,000 birds/barn, were: TRT #1 (WSD for surface decontamination – intermittent administration in drinking water of 0.025% EOBWE, 4d/wk) vs. TRT #2 (Omnicide disinfectant – Yumamycin in feed and Coccisol in drinking water). The WSD was used at 3% dilution and application of 400ml per meter square, while the Omnicide, Yumamycin, and coccisol were administered according to manufacturer’s instructions. The production performance was compared in the two treatments by calculating the FCR, mortality, and live body weight up to market age.
Performed at Adel’s Farm, Baalbek, Lebanon, evaluated the dual approach. The two Treatments, with one barn/treatment, and containing 15,600 birds/barn were: TRT #1 (WSD for surface decontamination – intermittent administration of 0.025% EOBWE in drinking water, 4d/wk) vs. TRT #2 (Formaldehyde disinfectant – administration of Monensin in grower feed and salinomycin in finisher feed). The WSD was used at 3% dilution and application of 400 ml per meter square, while the formaldehyde and monensin were administered according to manufacturer’s instructions. The production performance was compared in the two treatments by calculating the FCR, mortality, live body weight, and oocyte output in fecal material up to market age.
Performed by Dremax kft, Hungary compared two treatments on a broiler farm with long history of E. acervulina challenge, including 3 barns/Treatment and containing 17,000 birds/barn. The two treatments were: TRT #1 (WSD decontamination - Concurrent administration of Maxiban in feed and intermittent 0.025% EOBWE in drinking water, 3d/wk), and TRT #2 (WSD – only Maxiban in feed). The WSD was used at 3% dilution and application of 400 ml per meter square, while the Maxiban inclusion rate in feed was accomplished according to the manufacturer’s instruction. The European Efficiency Factor (EEF) was used to determine and compare the production efficiency in each of the two treatments. The EEF = Average weight gain (g)/day x % survival rate / feed conversion x 10.
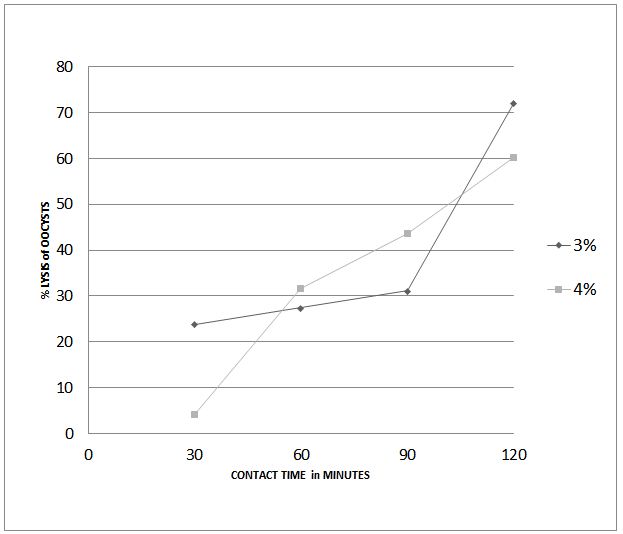
Experiment #1 resulted in a positive correlation between contact time of invented WSD and % lysis of sporulated Oocysts of E. tenella, with a respective correlation of determination (R2) obtained by 3% and 4% dilution of WSD equivalent to + 0.86 and +0.95, at 95% confidence limit (Figure 1). The % lysis of oocysts at shortest (30 min.) and longest (120 min.) contact times was higher when contacted with 3% dilution of WSD compared to that obtained by contact with the 4% dilution. The maximum lysis of oocysts (around 73 %) was obtained after their contact for 120 minutes with 3% dilution of WSD.
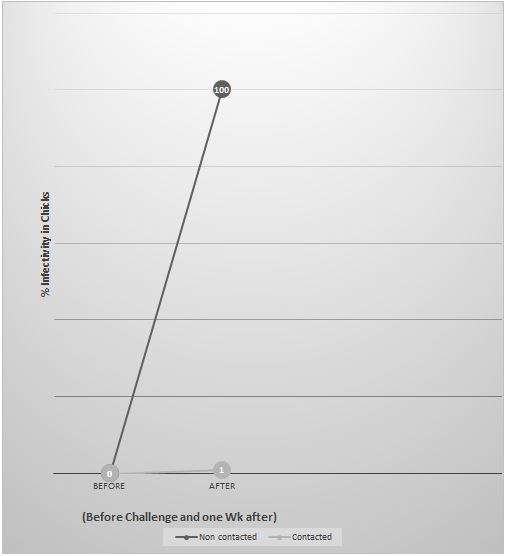
Experiment #2 showed that the contact of sporulated Oocysts of E. tenella with invented WSD (3%) for a period of 120 minutes resulted in 99% loss of infectivity in day-old chicks (Figure 2); however, the positive control birds that were administered the same dose of oocysts, deprived of contact with WSD, had a significantly different infection rate, approaching to 100% (P<0.05).
Experiment #3 proved that the 5 minutes-contact time of WSD (3%) with tested bacteria & viruses, in presence of interfering organic matter (1 % skim milk) resulted in 100% inhibition, except of the 96.6% inhibition of Streptococcus organism, a result that was significantly different than the bacterial counts, and positiveness of Hemagglutination of viruses grown in embryonated eggs, when previously deprived of contact with WSD (P<0.05) (Table 1).
Experiment #4 showed that the higher the concentration of invented EOBWE (0.020% or 0.100%) the shorter was the needed contact time (30 minutes) to lyse the sporulated Oocysts of 8 Eimeria spp. (P<0.05) (Table 2). A higher dilution of the EOBWE of 0.01% and 0.005% resulted in longer time to lyse the oocysts equivalent to 120 min and 180 min, respectively (P<0.05).
Experiment #5 proved that the EOBWE inhibitory effect on tested viruses (AI & NDV) was higher than that on tested bacteria, reaching to 100% viral inactivation at shortest contact time (P<0.05). The EOBWE - inhibitory effect on tested viruses was not affected by the interference with 1% organic matter (P>0.05), while the bacterial inhibition pattern was reduced significantly by the organic matter (P<0.05) (Table 3). It is worth noting that the most susceptible test organism to contact with EOBWE was the H9N2 avian influenza virus subtype that was inactivated at 5 min. contact time, in presence and absence of organic matter. However, the hardest organism to inhibit was the Streptococcus spp. having the lowest % reduction of 14.0% upon contact for 60 minutes with EOBWE in the presence of organic matter.
Experiment #6 showed that the continuous treatment by the invented EOBWE in drinking water of broilers that are challenged esophageally at different ages (14, 21, 28, 35d), by sporulated oocysts of 8 Eimeria spp. compared to untreated-challenged birds resulted in significant reduction intestinal lesion scores (P<0.05) (Table 7), reduction in intestinal oocyte counts (P<0.05) (Table 8), and improvement in production parameters of weight (P<0.05), FCR (P<0.05), and reduction in mortality (P<0.05) (Tables 4, 5, and 6).
Experiment #7 proved that the continuous treatment by either the invented EOBWE in drinking water (Treatment #3) or by Maxiban in feed (Treatment #2) to broilers challenged esophageally at same age (16 d), by sporulated Oocysts of six Eimeria spp., compared to untreated and similarly challenged birds (Positive Controls) (Treatment #3), resulted in lower oocyte output, and similar improvement in growth compared to untreated birds (Tables 9 and 10). More specifically, challenged birds treated with either Maxiban or EOBWE resulted in significant reduction of E. maxima-oocyst output compared to birds that were similarly challenged and deprived of medication (P<0.05). However, the treatment with Maxiban resulted also in significant reduction of E. acervulina-oocyst output (P<0.05), while the treatment with EOBWE resulted in an insignificant reduction of the oocysts of this Eimeria specie (P>0.05). Both treatments by Maxiban or EOBWE resulted in significant increase in weight gain compared to the positive controls (P<0.05).
Experiment #8 demonstrated that the intermittent treatment by EOBWE in drinking water (3 d/week), at higher concentrations of 0.0125% or 0.0250%, or the treatment by salinomycin in feed to broilers, raised on floor contaminated by 4x10⁵ sporulated oocysts/m2 of local Indian Eimeria strains, resulted in similar significant reduction in oocyst output, and better growth and reduced Feed Conversion Rate (FCR), compared to positive controls (P<0.05) that were similarly challenged but deprived of medication (Table 11 and 12).
Experiment #9 proved that the dual approach of interception, targeting the control of coccidiosis by WSD sanitization of oocysts belonging to 8 Eimeria spp. on pen’s surfaces and intermittent EOBWE administration in drinking water (WSD/EOBWE) or WSD/Maxiban in feed, resulted in similar Oocyst outputs at 14, 21, 28, and 35 d of age (P>0.05) that were significantly lower than the oocyst output obtained by dual interception with Chlorine disinfectant and EOBWE or Chlorine disinfectant and Maxiban (P<0.05) (Table 13). In addition, the dual interception by WSD/EOBWE resulted in significant reduction in FCR and significant weight gain compared to all other interceptions (P<0.05), while the mortality was significantly lower in both dual interceptions namely, that of WSD/EOBWE or WSD/Maxiban compared to other interceptions (Table 14).
Experiment #10 proved that the dual approach interception with invented WSD for sanitization of the barn’s surfaces, at a dilution of 3% and application of 400 ml/m2, and intermittent EOBWE administration at a dilution of 0.0125% for 3 consecutive days per week on broiler farm, with history of E. maxima challenge, resulted in 10% higher performance, deducted from the European Efficiency Factor (EEF) compared to dual interception with a commercial aldehyde disinfectant and continuous supplementation of salinomycin in the feed.
Experiment #11 showed that the dual invented approach of interception by WSD at a dilution of 3% and application of 400 ml/m2 on barn’s surfaces and intermittent administration of EOBWE in drinking water (0.025%) for periods of 4 consecutive days per week compared to a dual interception by Omnicide disinfectant and continuous administration of a combination of two commercial coccidiostats (Yumamycin + coccisol) resulted in the following percent difference in improvement of production by the invented approach: FCR 21.9% lower (P<0.05), mortality 15.3% lower (P<0.05), and live body wt. 12.3% higher (P<0.05).
Experiment #12 showed that the treatment of broilers with invented WSD at a dilution of 3% and application on barn’s surfaces of 400 ml/m2 and intermittent administration of EOBWE in drinking water (0.025%) for periods of 4 consecutive days per week compared to a dual interception by formaldehyde disinfectant and Monensin inclusion in grower feed followed by Salinomycin inclusion in finisher feed resulted in the following % difference in improvement of production and reduction in oocysts output by the invented approach: FCR 2.1% lower (P<0.05), mortality 10.1% lower (P<0.05), live body weight 2.5% higher (P<0.05), and Oocyte output 8.7% lower (P<0.05).
Experiment #13 showed an improvement of 8% in the European Efficiency Factor (EEF), detected in broiler flocks subjected to Treatment I (Interception by WSD at a dilution of 3% and application of 400 ml/m2 on barn’s surfaces and concurrent continuous supplementation of Maxiban in feed and intermittent administration of EOBWE in drinking water at a dilution of 0.025% for periods of 3 consecutive days per week) compared to birds in Treatment II (Interception by WSD at a dilution of 3% and application on barn’s surfaces of 400 ml/m2 and continuous supplementation of Maxiban in feed). The typical lesions for E. acervulina, a recurrent infection on this farm, were absent in autopsied birds of Treatment I but not in birds of Treatment II.
The discussion will cover each concluded experiment in the same sequence that was presented under the result section.
The apparent lysis effect by multivalent WSD on the oocysts of Eimeria spp. is most likely due to chloro-m-cresol multi-site mode of action, with basic activity at their hard wall, the polymeric biguanides ability in microbial wall disruption, multiplication arrest and chromosome condensation, suggesting DNA binding to this component of the WSD the organic peracetic acid denaturation effect on proteins of the oocyst, including enzymes, the inorganic phosphoric acid buffering effect against water impurities used in dilution of the WSD and the function of amionic sulfonic acid surfactant on biofilm built up on surfaces of pens that are subjected to disinfection [13-17].
The obtained higher lysis effect by the 3% dilution of WSD compared to the 4% dilution at 120 minutes contact time was adopted in Experiment #2 and in many following experiments presented in this manuscript. This 3% dilution of WSD, and the 120 min contact time with oocysts of E. tenella were enough in reducing significantly their infectivity in day-old chicks. This is most likely due to the inability of the non-lysed oocysts, surviving the contact with the WSD, in causing an infection of the intestinal epithelial cells. It is worth noting that a complex array of co-expressed surface proteins of oocyst, involved in its binding to intestinal host cell, could have been changed in their configuration due to their contact with WSD, resulting in a failure of its attachment to the intestinal cell receptors [18].
This experiment proved that the WSD at 3% dilution has also significant antibacterial and antiviral effects, which was the reason for us to give this disinfectant its name as ‘Wide Spectrum Disinfectant’. Actually, the polyvalent components of the WSD were documented before to cause inhibition or inactivation of bacteria and viruses, due to their damaging effect on the structure and functional components of these microorganisms [13-17]
This experiment helped in uncovering the lysis effect of EOBWE on oocysts of Eimeria spp. in a shorter time, once this invented material is applied at high concentrations of 0.020 or 0.10%. The lysis of the oocysts by the EOBWE is most likely due to its main active ingredients including, the effect of the eucalyptol molecule (1, 8-cineole) present in Eucalyptus plant on microbial structural configuration, and agglomeration of its inside structure, the effect of menthol in peppermint on perturbation of the microbial structure, resulting in alterations of their attachment component, and inability to replicate, and the superior activity of carvacrol present in Salvia libanotica on outer structure and viability of organisms [19-21]. Accordingly, the following in vivo experiments adopted the administration of either of the two concentrations of EOBWE in drinking water of broilers that are exposed to challenge by oocysts of Eimeria spp. It is worth noting that researchers in the field of development of antimicrobial agents rely on data of such a similar in vitro experiment to determine which concentration of the under developing agent will be experimented on in their follow up on in vivo trials [22].
This experiment presented the in vitro susceptibility of viruses and bacteria to EOBWE. It is worth noting that the in vitro susceptibility results do not always correlate positively with the in vivo susceptibility [23]. This fact requires future investigation to proof or disproof the presence of this correlation related to organisms used in the in vitro procedure of Experiment #5.
This experiment gave the first indication of the coccidiostat effect obtained by single intervention with continuous administration of EOBWE in drinking water to broilers that were esophageally challenged with sporulated oocysts of 8 Eimeria spp. The in vivo data of this experiment were in agreement with the in vitro data of experiment #4, in which the output of oocysts from broilers treated with EOBWE was significantly reduced. Future investigation should uncover the effect of ingested EOBWE in broilers on the formation of the other stages in the life cycle of Eimeria spp. including, sporozoites, schizonts, merozoites, male and female gametes, and zygotes [24].
This other in vivo experiment confirmed the coccidiostat effect of continuously administered EOBWE in drinking water of broilers that were esophageally challenged with oocysts of 6 Eimeria spp. in comparison to the coccidiostat effect of commercial Maxiban. This result emphasizes the need for the same future investigation, recommended under Experiment #6, aiming at studying the effect of EOBWE against the formation of the different lifecycle-stages of Eimeria spp. [24].
This experiment helped in finding the proper dosing of the invented EOBWE that was intermittently administered in drinking water of broilers, exposed at one day-old to soprulated oocysts on the floor of their pens. A similar coccidiostat effect was obtained by EOBWE at dilutions of 0.0125 and 0.0250%. These two dilutions were adopted in other experiments presented in this manuscript. It is worth noting that the norm of dose-standardization works always as a prerequisite to other following experiments, performed in isolation units and in those that are implemented under the field situations [25].
The acceptable data resulted from Experiment #8, related to effective dosing of EOBWE, its intermittent mode of administration in water, and the nature of challenge on the floor by specific sporulated oocysts count/m2 were adopted in Experiment #9, with an introduction of another interception beside the EOBWE namely, by decontamination of the oocysts on the floor by the invented WSD versus application of classical chlorine disinfectant, while comparing the administration of EOBWE in drinking water to that of Maxiban inclusion in the feed. This was the first experiment dealing with dual interception by WSD and EOBWE, showing its highest efficacy in controlling coccidiosis caused by 8 Eimeria spp compared to dual interceprtion by classical chlorine and EOBWE, or by chlorine and Maxiban, or by WSD and Maxiban. It is believed that the WSD decontamination of the pens floor, before introducing the day-old chicks, will most likely have a significant lysis rate of the oocysts, as shown in the in vitro procedure of Experiment #1, thus reducing the density of the challenge below the infective dose known for Eimeria spp. in chicken and by that avoid the intestinal injury, while providing enough exposure to low number of oocysts to enable the induction of a protective acquired immunity [26].
This experiment adopted also the dual interception, targeting the control of coccidiosis on a farm, by application of 3% dilution of WSD in 400 ml/m2 for decontamination of the farm surfaces, and intermittent administration of EOBWE at 0.0125%, a dilution proved to be efficacious in Experiment #8. This dual approach resulted in better control of coccidiosis compared to dual interception by formaldehyde decontamination of the surfaces and salinomycin inclusion in feed. The obtained data, under field environment, supported the previous controlled experiments performed in isolation units. It is believed that the multivalent active ingredients of WSD and those present in EOBWE could collectively induce an antimicrobial effect that is superior to reagents that are constituted of a single molecule [27-29].
These two field experiments are of a similar experimental design to that of Experiment #10, in which the obtained data showed the superiority in control of coccidiosis by the dual interception with WSD and EOBWE (0.025% dilution) compared to control birds that were subjected to classical dual interceptions by commercial disinfectants and administration of other coccidiostats. The results obtained could be due to long history of use of these commercial substances on these farms, thus selecting for drug resistant-Eimeria spp. that is causing recurrent infection, or it could be again due to the multivalent nature of the invented WSD and EOBWE that helped in augmenting their antimicrobial effects on these resistant strains [27,29,30].
This field experiment proved the absence of negative interaction between EOBWE administration in drinking water and the concurrent administration of Maxiban in the feed of broilers. Actually, there seems to be a synergism between the two materials, as shown in their improvement of control of E. acervulina on that farm compared to interception with the EOBWE alone.
The global effort of investigators on this project, targeting an invention of dual interception method for improving the control of coccidiosis in poultry, while satisfying the new vision of FAO/OIE/WHO in providing poultry products that are devoid of drug residues, is concluded. The in vitro experiments on WSD and EOBWE were conclusive in proving their lysis effect on oocysts of Eimeria spp.,and their antibacterial and antiviral nature. The in vivo experiments performed in isolation units resulted in preliminary conclusion about the coccidiostat nature of the invented EOBWE in chicken, that were subjected to controlled challenges, showing significant reduction in their oocyst output, associated with apparent improvement in their quantified production parameters. The in vivo experiments related to dual interception approach by WSD and EOBWE, performed in isolation units or on farms, with history of coccidiosis outbreaks, showed the impact of this approach on significant control of coccidiosis by reducing the oocyst output and improving the production parameters of broilers. The absence of a negative interaction between EOBWE and
We recommend keeping monitoring the emergence of resistant Eimeria spp isolates, upon different intervals of dual application of WSD and EOBWE on farms, to evaluate the impact of multivalent active ingredients in both invented substances on time needed for emergence of resistance in these protozoa.
The Authors of this manuscript are thankful for the encouragement of the poultry sector in many countries that are willing to have a transformation towards rearing poultry without drugs. In addition, we are thankful to all global institutions in the 9 countries that cooperated on this international project. Last but not least, we are thankful to Opticon Hygiene Co. in Switzerland for funding the 13 experiments of this project.