Photocatalytic Study and Anticancer activity of Green-Synthesized Ag Nanoparticles Using Drumstick Leaf Extract
Rapid preparation of silver nanoparticles (Ag-NPLs) using Drumstick (Moringa Oleifera) leaf extract has been developed for the photocatalytic and anticancer activities. Ag-NPLs were characterized by FTIR, UV–vis, XRD, TEM, SAED, SEM, and EDAX. FTIR confirmed that Ag-NPLs were coated and stabilized with the biomolecules present in the plant extracts. UV–visible studies showed an SPR characteristic peak of Ag metal at 408 nm with energy bandgap = 2.3 eV. Reduction mechanism of Ag+ to Ag0 was presented. XRD showed that the Ag-NPLs were of face-centered cubic structure which consistent with the SAED profile. TEM observations show the formation of sphere-shaped Ag-NPLs with an average size of 5-15 nm. EDAX spectrum confirmed the elemental composition of the Ag-NPLs (3.0 eV). The electrical conductivity of Ag-NPLs was 2.2 x 10⁻¹¹ S cm-1. Ag-NPLs as a photocatalyst exhibit an awesome performance towards sunset yellow (SSY) dye. Ag-NPLs have been shown to be effective against three types of human cancers (Caco-2 cells, HepG2 cells, and Mcf-7 cells). Ag-NPLs as anticancer agents inhibited the growth of the three types of human cancer cells as indicated by the IC50 values. The proposed biosynthesis of Ag-NPLs can be recommended as a potential route for technological applications such as water treatment and a chemotherapeutic agent for some human cancer treatment.
Keywords:Silver; Nanoparticles; Green Chemistry; Photocatalytic; Anticancer
Silver nanoparticles (Ag-NPLs) are widely exploited in a wide range of new purposes due to their unique optical, electrical, thermal and catalytic properties [1,2]. These special properties of Ag-NPLs are attributed to their nano-size regime and large surface area. Ag-NPLs are used in various applications such as photonics, electronics, catalysis, antimicrobial activities, water treatment, optical limiting and cancer treatment [3-15]. Physical and chemical methods for producing Ag-NPLs are expensive and hazardous [16]. "Green chemistry" offers several advantages over the physical and chemical routes of nanoparticles due to their eco-friendly attributes and application. Meanwhile, Green chemistry is a simple and non-toxic approach that can produce Ag-NPLs with controllable morphology, size, and shape [17].
Numerous studies have proven that the plant extracts act as a potential precursor for the synthesis of Ag-NPLs in eco-friendly and non-hazardous ways. The plant contains natural reducing or capping species e.g., flavonoids and alkaloid compounds [7]. A survey of previous literature suggested that several plants can be utilized to produce Ag-NPLs [5,9-22]. Although biosynthesis of Ag-NPLs using plant extracts has been previously reported, there is still a lot of attention to this field because of the diversity, availability and the high potential of plants as reducing, capping and stabilizing agents in producing highly ordered Ag-NPLs with precise dimensions. The main objectives of the present study are to (1) Highlight the potential of Drumstick (Moringa Oleifera) leaf extract for the rapid green synthesis of Ag-NPLs, (2) Explore the mechanism of the formation of Ag-NPLs occurring in these media, (3) Assess the photocatalytic activity of the green-synthesized Ag-NPLs and (4) Investigate the effectiveness of the leaf-mediated Ag-NPLs against some types of human cancers.
In the present work, a facile synthesis of Ag-NPLs by an eco-friendly procedure involving the in-situ reduction of Ag+ by Moringa Oleifera (M. Oleifera) leaf extracts have been developed. However, M. Oleifera is rich in flavonoids, broadly belonging to the class of phenolic compounds [23]. It was observed that the use of M. Oleifera extract makes a very fast and convenient method for the synthesis of Ag-NPLs and can reduce Ag+1 into Ag0 within 90 sec of reaction time without using any harsh conditions. Compared with the other literature works on the synthesis of Ag-NPLs, the features of our method are: the reaction system is simple, economic and ultra-fast; the yield is high and the synthesized Ag-NPLs are quite stable. Characterization was performed using a combination of analytical techniques, including FTIR, UV–vis., XRD, TEM, SAED, SEM, and EDAX. Suggested mechanism of Ag+1 to Ag0 was presented. The characteristics of the final product such as optical, electrical, and thermal were investigated. The photocatalytic degradation of sunset yellow (SSY) dye by Ag-NPLs is demonstrated. The anticancer activity of Ag-NPLs was carried out on human colon cancer Caco-2 cells, human hepatic cancer HepG2 cells and human breast cancer Mcf-7 cells.
All the chemicals, used in this work, were analytical grade and used as purchased without further purification. Silver nitrate, AgNO3 of 99 % purity (Sigma Aldrich), was dissolved in deionized water.
M. Oleifera leaves were freshly collected. To remove the soil and other contaminants present on the surface of the fresh leaves, initially tap water was used to remove the contaminant and then thoroughly washed with deionized water. After the wash, M. Oleifera leaves were cut into small pieces and then soaked in 100mL de-ionized water. These leaves were continuously stirred at 62 °C for 4h and filtered to get the extract. A deep yellow extract was obtained, and the extract was freshly used.
Typically, a plant extract-mediated reduction involves mixing the aqueous solution of the relevant Ag salt (1g/100ml) with a fresh aqueous extract. The reduction occurs at room temperature and is generally complete within 90 sec. The solution after complete reduction was centrifuged at 4,000 rpm for 6 min to isolate the Ag-NPLs free from the compounds present in the solution.
Infrared spectra were recorded on a Thermo Fisher– model: Nicolet iS10 FT-IR spectrometer. UV-vis absorption measurements were recorded by PerkinElmer; model: LAMBDA 750 UV/Vis/NIR Spectrophotometer. The structure of the Ag-NPLs was investigated by a Philips X-ray diffractometer (model PW 1710). The morphology of Ag-NPLs was investigated by scanning electron microscopy (SEM; JEOL [model: JSM 5400LV]) and transmission electron microscopy (TEM; JEOL [model: JEM-100 CXII]. The resistance measured using a high resistance meter (Keithley, Model 6517B). Thermal analysis measurements were recorded on a Shimadzu thermogravimetric analyzer TGA-50.
Cell viability was determined by the MTT assay as we recently reported [24]. The cell lines used in the present study were human colorectal adenocarcinoma (Caco-2) cells, human hepatocellular carcinoma (HepG2) cells, and human breast cancer (Mcf-7) cells. The cell lines were purchased from VacSERA, Egypt.
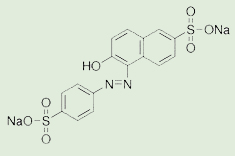
To assess the photocatalytic activity of the green-synthesized Ag-NPLs, the degradation of sunset yellow (SSY) dye as a model pollutant was carried out. The chemical and physicochemical properties of the SSY AZO dye are tabulated in Table 1. To explore the best dye concentration, we already made a preliminary test previously; 5, 10, and 20 mg/L SSY dye for 6 h were tested. The best concentration was 10 mg/L; therefore, it was used to perform the photodegradation study. On the other hand, such concentration was consistent with the literature. In this study, typically 60 mg of synthesized Ag-NPLs was added to 100 mL of a 10 mg/L aqueous SSY dye solution. The reaction mixture was mixed by magnetically stirred for 1 h in dark condition to reach the adsorption-desorption equilibrium of the working solution. After that, the reaction mixture was exposed to light irradiation for 10 h. In this study, UV (Herolab lamp, 6W, λ 254 nm) and solar irradiation were utilized. The experiment under solar irradiation was performed on a sunny day between 10 am to 3 pm at our Lab in Al-kharja city. At specific time intervals, 3 mL sample was withdrawn and used to evaluate the photocatalytic degradation of SSY dye. The aliquot samples were centrifuged at 4000 rpm for 5 min before analyzing by UV–Vis spectrophotometer (JASCO V-630) at wavelength of 480 nm. A control experiment was performed without adding Ag catalyst. Removal percentage of SSY dye degradation was estimated as the following (eq. 1):
% Degradation = (C0-Ct)X100/C0 (1) (1)
The kinetics of SSY dye/Ag-NPLs reaction mixture follow the pseudo first order as the initial SSY dye concentration is very low and is expressed as eq. 2:
ln(Ct/C0) = -kt (2)
where k is the photocatalytic rate constant at time t.
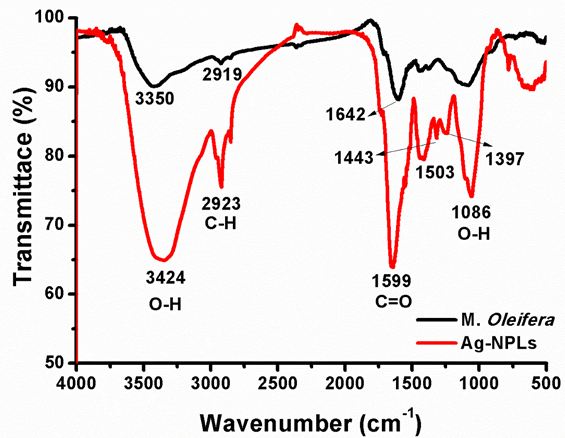
In order to illustrate the possible functional groups of aqueous extract of M. Oleifera and synthesized Ag-NPLs, the FTIR analysis was performed. The spectrum of the Ag-NPLs (red) shows a broad band around 3424 cm-1 is due to the -OH of the stretching vibration of attributes for water and M. Oleifera extract molecules. The peak emerged at 1379 cm−1 is due to −C-O-C stretching modes. The stretching vibrations at 1086 and 1443 cm−1 are attributed to -OH functional groups in polyphenols. The absorption peak at 1379 cm−1 should be owing to COO- vibrations. The absorption peak at 1599 cm−1 is associated with stretching vibration of C=O. The stretching vibration of C-C- in aromatic ring causes an absorption peak at 1503 cm−1. The absorption peak located at 1086 cm−1 may be owing to C-O stretching vibrations of phenolic groups.
On the other hand, the spectrum of the M. Oleifera extract (black) shows the absorption peaks at 3350 cm−1 corresponding to the -OH groups and the peak at 2919 cm−1 indicates the presence of C-H linkage. The absorption peaks around 1642 and 1413 cm−1 are the characteristic peaks for the C-H and COO- stretching respectively. The bands at 1248 and 1057 cm−1 indicate the presence of C-O stretching of phenols and the carboxylic acid groups. This observation confirmed the dual function of the M. Oleifera extracts as a natural reducing and capping agent. The similarities between the spectra of the M. Oleifera extract and Ag-NPLs as shown in Figure 1, with some shifts in peak position/intensity, indicate the presence of the biological species as a capping and stabilizing agent. This observation confirms that the organic species in the plant extract are adsorbed on the surface of Ag-NPLs by π-electrons interaction [19]. Further, the bioactive components were responsible for the formation and stabilization the Ag-NPLs. Notably, some works observed a modification of these bands depending on the natural biomolecules in the plants [20-25]. All these stretching vibrations and bends exhibit that polyphenols are bound along with Ag-NPLs. Further, the absence of an absorption band of Ag2O at 513 cm−1 in the Ag-NPLs spectrum indicates the purity of the Ag-NPLs [26].
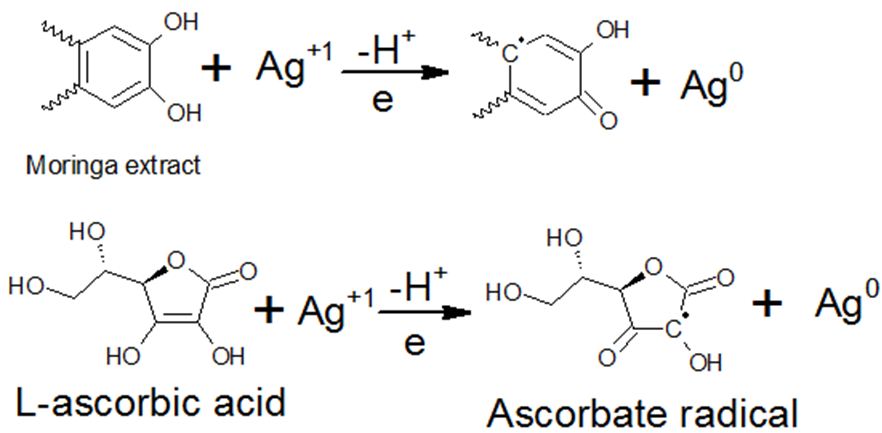
Green synthesis approaches to prepare the inorganic nanoparticles are recommended; since the fabricated nanoparticles are stable, economic and eco-friendly. Plants are promising candidates for biosynthesis of nanoparticles because of their diversity and availability. Further, plant-mediated nanoparticle synthesis offers a facile route for large-scale production of inorganic nanoparticles [27]. In this study, the organic species present in M. Oleifera leaf aqueous extract and the water-soluble heterocyclic components e. g., alkaloid and flavones are responsible for the reduction of Ag+ ions and the stabilization of the Ag-NPLs [7]. Quercetin and ascorbic acid (vitamin C) among the major bioactive compounds in the aqueous extract of M. Oleifera. However, Quercetin belonging to the flavonoid group of phenolic compounds which has been shown to possess a strong chelating ability [28]. The most abundant biocomponent is ascorbic acid as well.
Phenolics and vitamins present in the extract are not only reducing silver salt but also work against precipitation or agglomeration. To identify the potential mechanism/s of Ag-NPLs formation, FTIR spectroscopy was employed. Mechanisms of formation of the Ag-NPLs via the chemical reaction of the silver nitrate precursor with the bioactive compounds of the M. Oleifera are suggested (Scheme 1). For instance, chemical behavior of L-ascorbic acid and Ag+, oxidation of L-ascorbic acid to ascorbate via free radical, followed by electrostatic attraction between the free radical and the precursor cation.
UV-vis spectroscopy is a useful and reliable tool for the initial characterization of the synthesis and stability of Ag-NPLs. In silver, the conduction and valence bands lie very close to each other in which free electrons move easily [29]. These electrons produce a surface plasmon resonance (SPR) absorption band, occurring due to the collective oscillation of electrons of Ag in resonance with the light wave Initially, bio-reduction progress of Ag+ ion into Ag particles during exposure to the M. Oleifera extract could be monitored by the color change; the color of the solution turned from pale orange to yellowish white after 90 sec of the reaction, which indicated the production of Ag-NPLs [30] (Figure 2A).
Figure 2A shows an absorbance band at 408 nm, corresponding to the SPR of Ag-NPLs. The observation indicates that the reduction of the Ag+ ions carried out very fast. It has previously been reported that absorbance at around 400-440 nm is a characteristic of Ag-NPLs which is dependent on the nanoparticle size and shapes [31]. However, for the smaller sized Ag-NPLs, SPR shows a shorter wavelength, while for the bigger nanoparticles SPR is found at longer wavelengths [29].
Measuring the energy bandgap is a significant factor in the nanomaterial industry. The term bandgap refers to the energy difference between the valence the conduction bands. The energy bandgap was calculated as 2.3 eV by the applying Tauc relation as given by the following equation 3:
αhv=A0(hv-Eg)m
Where hv is the photon energy, m is assumed values of 0.5 and 2.0 for allowed direct and allowed indirect transitions, respectively [32]. Photoluminescence observed in nanoparticles is due to the inter-band transition between sp band and valence band. In silver, out of six bands, five bands lie below the Fermi levels are called d or valance and the single band which lies above the Fermi level are denoted as sp or conduction band [33]. The transition between the sp and d band is known as interband transition. When Ag-NPLs were excited at 220 nm, it exhibited an excitation peak at 440 nm (Figure 2B). The Ag-NPLs synthesized using olive leaf extract were reported to be luminescent with the emission band at 425 nm [34]. To verify the results of the UV–vis spectral analyses, the powder sample was examined by XRD.
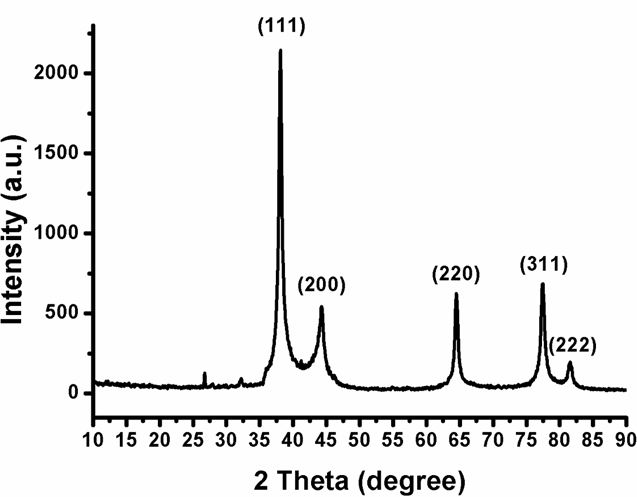
X-ray diffraction (XRD) can analyze the structural features of a wide range of materials, like inorganic, superconductors, and polymers. Analysis of these materials depends on the formation of diffraction patterns. The diffraction patterns explain whether the materials are pure or contain some impurities. XRD pattern of Ag-NPLs was recorded in the 2θ range 10–90° as shown in Figure 3. The XRD pattern shows that there are five distinct reflections (JCPDS file No. 04-0783) at 38.11° (111), 44.29° (200), 64.44° (220), 77.39° (311) and 81.13° (222).
The intense reflection at (111), in comparison to the other four, may indicate the growth direction of the nanocrystals. Based on the half-width of the (111) reflection on the powder pattern, the average particle size (approximately 17 nm), determined by broadening of the (111) reflection by the Scherer formula; D= 0.9 λ/(β cosθ), λ= 1.54056 0A, β is full width in radians at half maximum of the peak. The absence of some additional reflections other than the reflections belonging to the Ag lattice suggests the high purity of Ag-NPLs. The highest peak intensity of (111) plane with narrow FWHM illustrates the good crystalline nature of Ag-NPLs as observed from the TEM images. The XRD results are consistent with TEM analysis.
Transmission electron microscopy (TEM) has been used to identify the size, shape, and morphology of Ag-NPLs. TEM profile in Figure 4A and B shows that the formed Ag-NPLs are in the range of nanoparticle size around 5–16 nm and some particles are in large scale. The TEM images exhibit a mixture of shapes with mainly spherical shapes are predominant. These particles are spread over the surface. Further, a thin layer of organic materials from plant extract, which acts as a capping organic agent, is observed as well as previously reported [35]. This may explain that the Ag-NPLs show a good dispersion inside the bio-reduced aqueous solution. This was confirmed by the higher magnification TEM image; such as the one shown in Figure 4B.
The crystallinity of the Ag-NPLs was detected by selected area electron diffraction (SAED) experiments and a typical SAED pattern is depicted in Figure 4C. The appearance of discrete spots in the ring pattern showed that most of the particles are single crystalline materials and they are oriented along their (111) Ag direction, as generally found in the FCC crystallographic structure of the Ag crystal lattice.
Scanning electron microscopy (SEM) is a surface imaging method, accomplished of resolving different sizes, shapes and the morphology of the nanoparticles. SEM images reveal that the particle-like Ag-NPLs crowded together to look like collective cauliflower (Figure 5A and B). SEM images show that the formed Ag-NPLs are in the range of nanoparticle size around 18 nm. The combination of SEM with energy-dispersive X-ray spectroscopy (EDAX) can be used to examine silver powder morphology and conduct chemical composition analysis.
The elemental composition of the green-synthesized sample was determined by EDAX. The EDAX spectrum of Ag-NPLs is shown in Figure 5C and exhibits that a strong peak at 3.0 eV confirms the formation of Ag-NPLs. The signals in the range of 0.0–0.5 keV represent the absorption of carbon and oxygen and thus indicates the presence of the plant extract (as a capping agent) on the surfaces of the Ag-NPLs. Further, The EDAX analysis revealed only Ag content, indicating no Ag2O formation. In previous work, a signal energy peak in the range of 2–4 keV for spherical-shaped Ag-NPLs produced using Memecylon edule [36]. These results are similar to those for the Chenopodium album leaf extract previously reported [37].
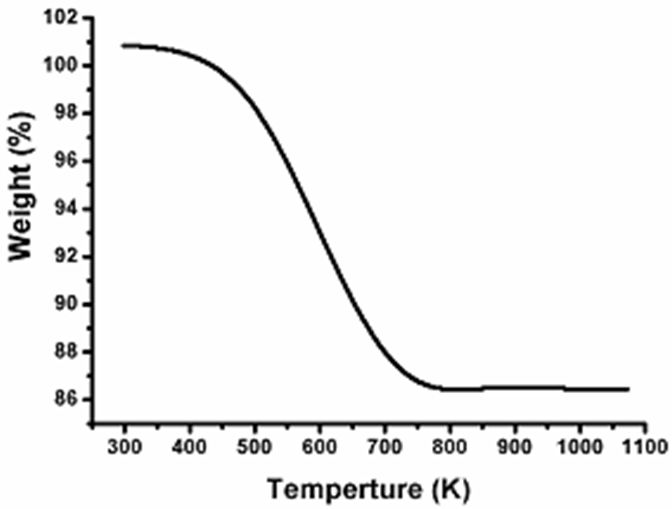
The thermal gravimetric analysis (TGA) was carried out at a heating rate of 10 °C/min under nitrogen atmosphere over a temperature range from 298 to 1073K; the loss in the low-temperature region indicates the presence of water molecule of the lattice. TGA profile of Ag-NPLs is shown in Figure 6. It is observed that the TGA curve exhibit a weight loss of a sample as 14.17% occurred in the temperature range from 300 to 700 K due to the water evaporates and the organic components present in the plant extract.
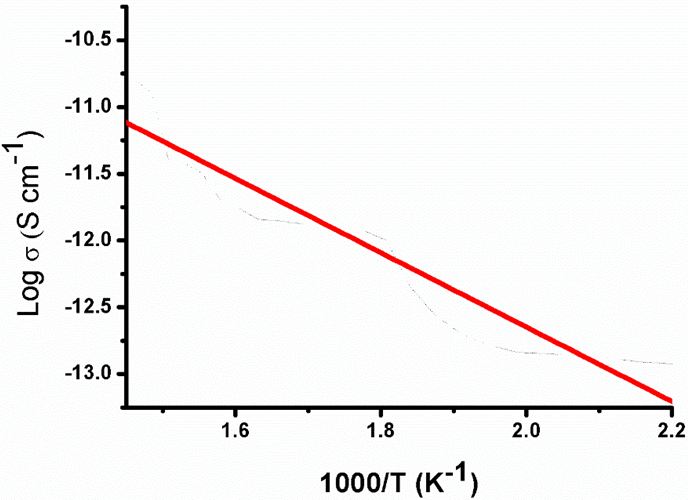
The electrical conductivity of the Ag-NPLs samples in the temperature range of 170 to 430K was investigated; following the Arrhenius relation [38]. Arrhenius plot of log(σ) vs 1/T, where σ is electrical conductivity (S cm-1) and T is temperature (K), has been shown in Figure 7. The slope gives more information about the activation energy. The variation of electrical conductivity with temperature was investigated and indicated the semiconducting nature of the Ag-NPLs with an activation energy = 0.54 eV. The Ag-NPLs exhibits good electrical conductivity value 2.2 x 10⁻¹¹ S cm-1. This confirmed that Ag-NPLs are electrically conductive. Such conducting Ag-NPLs may be used in nanoelectronics and energy storage applications.
Cancer is a complex disease which has the characteristic feature of the uncontrolled growth and spread of abnormal cells and it is treated by numerous treatments including radiation, chemotherapy, and surgery. Cancer research using experimental animals characterized with ethical drawbacks in addition to these tests are costly and time-consuming [39]. Therefore, efforts are put into developing in vitro human cell models for toxicity testing [40]. Cell culture assays are collected from patients’ tumor samples and cultured to grow indefinitely in the laboratory. Cancer cell line derived from human tissue not only provides a fundamental platform to understand molecular biology of neoplasia, also served as a basis for the investigation of specific therapeutic strategies towards cancer types [41]. Several studies have reported that green-synthesized Ag-NPLs using different plant extracts induce cytotoxicity in different tumor cell lines. Generally, Ag-NPLs showed interest because of their therapeutic applications in cancer as anticancer agents [42]. Plant-mediated synthesis of Ag-NPLs showed pronounced toxic effect in human lung carcinoma cells (A549) than non-cancer cells like human lung cells [13,43]. This may be due to stimulation of reactive oxygen species (ROS) by silver nanoparticles and damage to cellular components, which led to cell death [44].
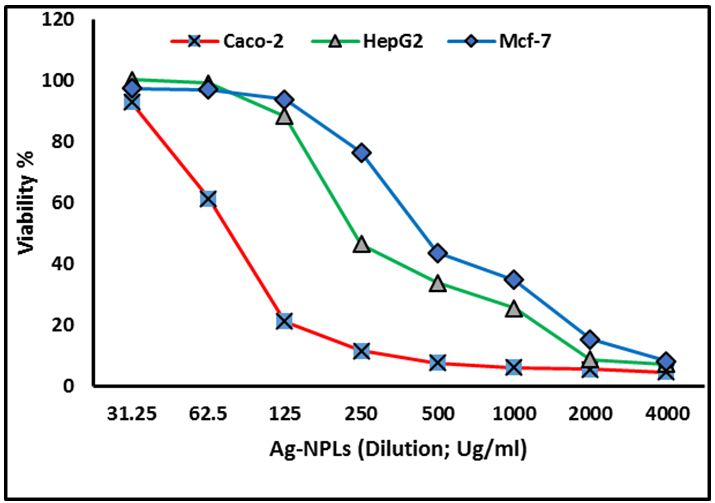
The human epithelial cell line Caco-2 has been widely used as a model of the intestinal epithelial barrier. The Caco-2 cell line is originally derived from a colon carcinoma [45]. MCF-7 is a commonly used breast cancer cell line that has been propagated for many years by multiple groups. Hepatic cancer regarded as one of the leading causes of worldwide cancer mortality. The present in-vitro study of the green-synthesized Ag-NPLs was evaluated against on human colon cancer (Caco-2 cells), human breast cancer (Mcf-7) cells and human hepatic cancer (HepG2) cells and the percentage cell viability was calculated. Our result exhibited that the selected cancer cells responded to Ag-NPLs in a dose-dependent manner (Figure 8). Concerning the human colon cancer Caco2 cells, IC50 was 84.37 μg. Concerning with human hepatic cancer HepG2 cells, the current results conducted that IC50 for Ag-NPLs was 248.84 μg. Finally, regarded to human breast cancer Mcf-7 cells, the present investigation conducted that IC50 for Ag-NPLs was 455.36 μg. The results revealed that Ag-NPLs are promising anticancer agents enhanced the growth inhibition for the three cell lines under investigation, as indicated by marking from IC50 values against the investigated-cells. The obtained Ag-NPLs have potential applications in the biomedical field and this simple procedure has several advantages such as cost-effectiveness, compatibility for medical and pharmaceutical applications.
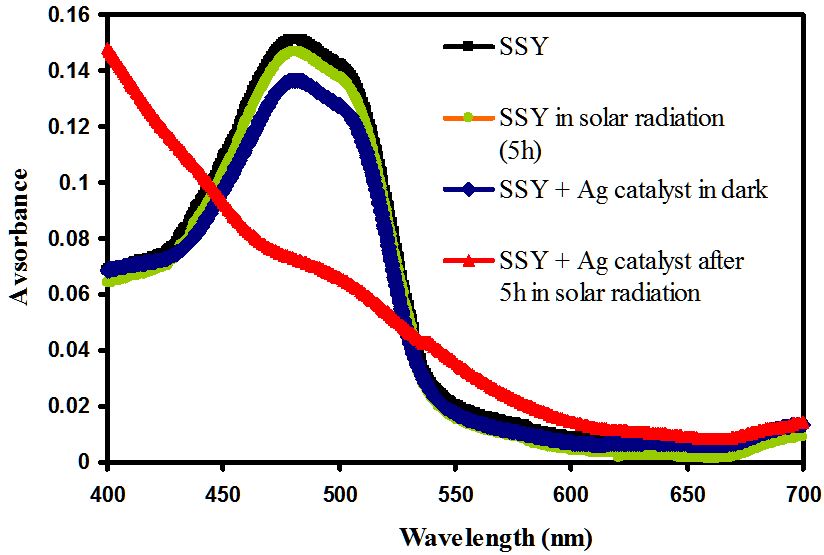
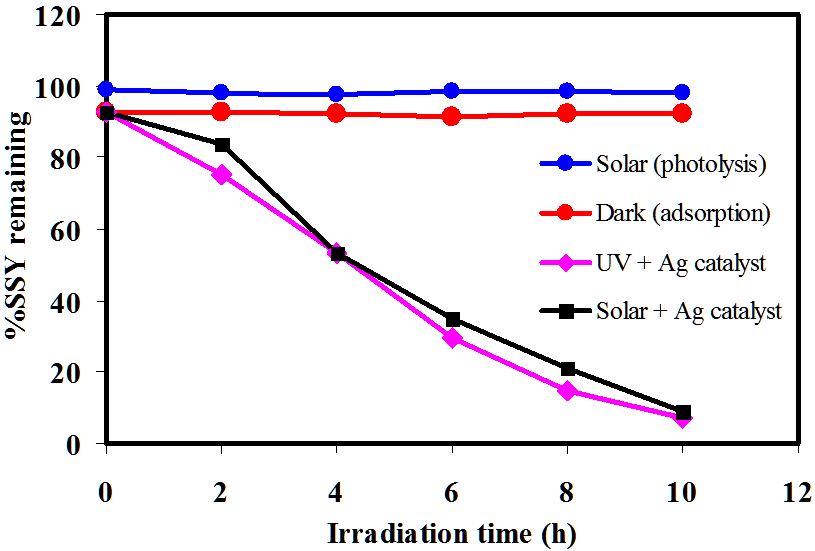
The photocatalytic degradation of sunset yellow (SSY) by Ag-NPLs is demonstrated in (Figures 9,10 and 11). The SSY dye degradation in the presence of Ag-NPLs was verified by the gradual decrease of the characteristic peak intensity at 480 nm during 5 h exposure in sunlight as shown in Figure 9. The decrease of the absorbance values indicates the ability of Ag-NPLs as a photocatalyst to degrade SSY dye. As shown in Figure 10, the efficiency of SSY degradation is very low for both photolysis and dark runs compared to both UV and solar photocatalysis experiments. The photolysis degradation rate was 1.7 %. As for the dark experiment, it also has a low degradation rate of 7.8%. The SSY concentration decreases for the dark experiment due to the adsorption of SSY dye molecules on the Ag-NPLs surface. However, the photocatalysis runs under both UV and solar irradiations accelerate the (SSY) dye degradation. It is observed that the degradation efficiency under UV is slightly higher than that performed under solar irradiation with 92.7 and 91.2 %, respectively. From previous work, it was reported that the photocatalytic degradation under UV light has significant impact on given dye photodegradation rate; shorter wavelengths result in faster decomposition [46].
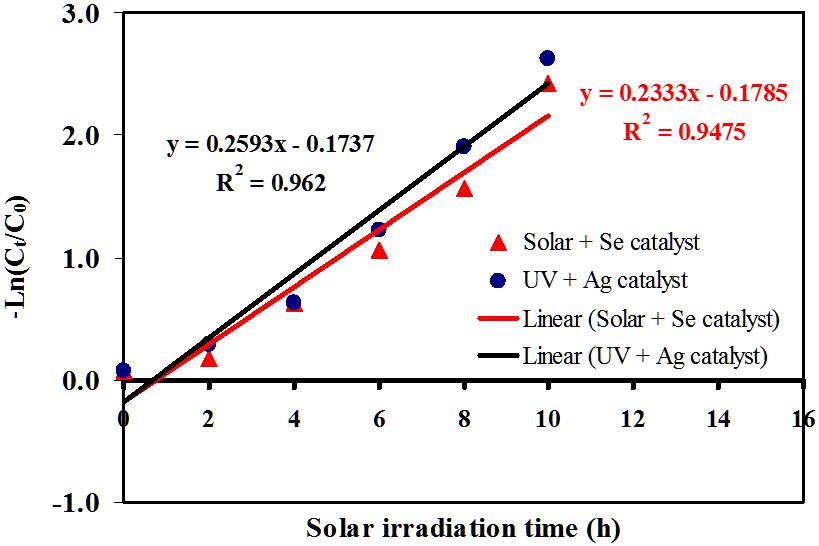
High light intensity irradiates more photons. These photons are absorbed by the catalyst. This leads to the formation of oxidizing radicals for SSY degradation. Thus, high SSY degradation efficiency was obviously observed in the presence of both catalyst and light. Comparing the obtained results of photolysis, adsorption, and photocatalysis, it is indicated that the SSY degradation experiments were performed at a nearly pure photocatalytic condition. The photodegradation kinetics of SSY dye were modeled into a pseudo-first order rate and the plot of -ln(Ct/C0) vs time (t) is depicted in Figure 11. Based on this model, the catalytic rate constant, k, was calculated as 0.23 and 0.25 min-1 for photocatalysis under solar and UV irradiation, respectively.
According to previous studies the photocatalytic activity of Ag-NPLs is not far from those of catalysts used for SSY degradation, but it rather increased [47,48]. The photocatalytic degradation of SSY using Tio2-Pt, Tio2-Pt/graphene oxide, and Tio2- Pt/reduced graphene oxide composites were above 99 % in the presence of natural sunlight irradiation. The rate constants were 0.0319 min-1 for Tio2, 0.0328 min-1 for Tio2-Pt and 0.0317 min-1 for Tio2-Pt/graphene. The photodegradation processes were carried out using 0.2 g/L catalyst loading, 2 x 10⁻⁵ M SSY and irradiation time of 180 min. Comparatively, Ag-NPLs showed faster rate of sunset yellow degradation than catalysts used in previous studies.
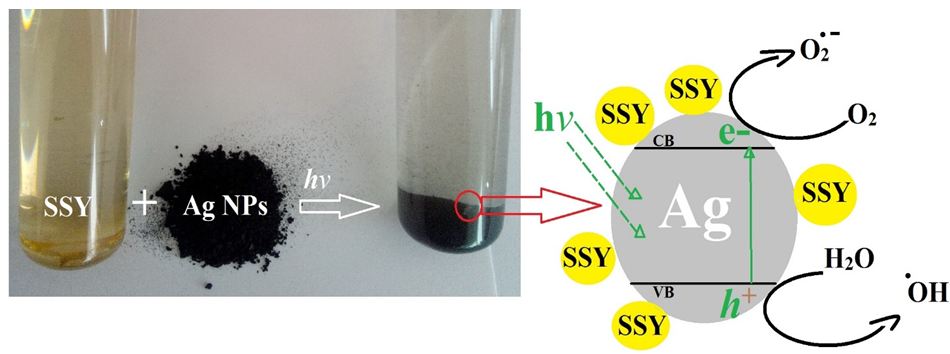
Based on what has been obtained and observed, the photocatalytic mechanism is proposed and presented in Scheme 2. Under light irradiation, Ag-NPLs surface absorbs light photons which leads to electrons excitation to conductance band (CB) and holes formation at valence band (VB). The trapped excited electrons produced superoxide radical anions (O2.-) and at the same time, VB holes of Ag-NPLs react with water to generate highly reactive hydroxyl radicals (.OH). The hydroxyl radicals and superoxide radical anions are the main active species which are used for the degradation of the dye. Therefore, high degradation efficiency of SSY dye was observed in the presence of light source and photocatalyst Ag-NPLs. Previous research conducted that the photocatalytic activity of Ag-NPLs can be strongly dependent on the crystallographic nature, morphology and structure and size of the Ag-NPLs. The present study revealed that Ag-NPLs as a photocatalyst exhibits an awesome performance towards SSY dye. Previous research conducted that the photocatalytic activity of Ag-NPLs can be strongly dependent on the crystallographic nature, morphology, structure and size of the Ag-NPLs [49].
This paper emphasizes on the biosynthesis of Ag-NPLs using Drumstick (Moringa Oleifera) leaf extracts and their applications in photocatalysis and cancer treatment. Ag-NPLs of 5–16 nm size with spherical shape were synthesized. Only a 90 Sec was required for the conversion of Ag ions into Ag-NPLs at room temperature, without the involvement of any hazardous substance. Synthesized Ag-NPLs were studied for their structural, optical, electrical, thermal, morphological properties, photocatalytic and anticancer activities. The dual function of the M. Oleifera plant extract as a reducing and capping agent and the presence of some functional groups was confirmed by FTIR analysis. The optical study showed that the appearance of an SPR peak at 408 nm affirming the formation of Ag-NPLs. Structural studies revealed the good crystalline nature of the FCC structure of Ag crystal and oriented along (111) plane with the average particle size of 17 nm. Some of the Ag-NPLs were roughly circular in shape. EDAX profile affirmed the Ag crystal by the presence of energy peak at 3.0 eV. The present study revealed that Ag-NPLs as a photocatalyst exhibited an awesome performance towards SSY dye. The present in-vitro study showed that the anti-tumor efficacy of Ag-NPLs was carried out on human colon cancer (Caco-2 cells), human breast cancer (Mcf-7) cells and human hepatic cancer (HepG2) cells. Our findings indicated that the as-synthesized Ag-NPLs with M. Oleifera leaf extract have potential application in cancer treatment.
The authors confirm that there is no conflict.
The authors present great thanks to New Valley University for supporting this work under its scientific projects..

.JPG)
.JPG)
.JPG)
.JPG)
.JPG)
.JPG)
.JPG)