Pig Production System of Ethnic Group in Ratanakiri
Ratanakiri is located in the northeast part of Cambodia, has annual temperature in the range from 22-34 ˚C and average precipitation of 2200 millimeters. The density of population was very low only 17/km2 and about 70% of them living in the upland area where they applied subsistence agriculture farming. This study was sampled 3 districts, 3 communes, 9 villages with totally respondents of 126 in Ratanakiri to investigate the small-scale pigs’ production of ethnic people by mainly focusing on the local breeds and available feed resources. As a result of the survey, all the interviewed farmers were interested in local breeds and freely scavenging production system without any tied up and housing, the pigs were fed with local possible resources such as cooked banana stalk or taro and broken rice, mixing with rice bran and sometime only cooked broken rice and rice bran. It was noted that, the feed was done only one time per day in the morning. Breeding and vaccination/deworming program were not completely applied in the sampled targets which led low production and easier to infect any seasonal diseases and high mortality rate because the technical extension service from provincial department of agriculture was not done broadly and local animal medicine shops was far away and village animal health service (VAHS) were also difficult to access. The pigs’ production by ethic people in the targeted areas was actually not economical and profitable as all of them practiced the scavenging system with poor management and malnutritional and inadequate feed supply. These would lead longer production period and higher mortality rate. The main purpose of the production was just to dedicate to the religious symbols they believed on, especially when they infected serious diseases or got a fever and for traditional ceremony.
Keywords: Local Resources; Breed; Vaccination/Deworming; VAHS; Profitable; Scavenging System; Production Period and Mortality Rate
Ratanakiri borders with Laos PDR to the west and Vietnam to the east the annual temperature is in the range from 22-34 ˚C with annual precipitation is approximately 2,200 millimeters. Total population is about 184 000 and population density is very low approximately 17/km2. 70% of them practiced the crops such as rice, soybean, cashew, cassava, banana, mango…etc. The pigs’ production systems there generally are freely scavenging system, challenging poor feeding, no deworming and vaccination programs; resulting to lower productivity and high risk of diseases and mortality as FOA 2010 suggested to keep the pigs in the pen with enough feed supply to avoid any contaminations and infections from other relevant factors. Moreover, most of farmers are the subsistence farmers and the monthly income is about 5 USD per person [1].
The religious belief and living standard of the ethnic groups are currently the obstacle condition in developing the pig production of ethnic residents. Generally, they raised the pig not for income generation or their living standard improvement, but mainly concerning to dedication or praying when they or their relatives are sick. The local breeds, named Kandol, are popular in the region because they are able to scavenging for feed in the forest by themselves as they are generally fed only one time a day in the morning and they are also more resistant to infectious diseases. However, this breed was rejected by people in lowland areas as they are not marketable. Because, land converting from forestry covered to agro-industry land such as rubber farm, soybean, cassava, and so on; less scavenging areas are available and new infectious diseases outbreak, thus the population were not increased.
Small scale farming is the most common way of producing pigs in Cambodia. This type of production often means one or two pigs at the most. It accounted for 98% (2.2 million) of all small livestock production in Cambodia and it was one of the sources of income for farmers (San, 2011). About 49% of pigs were raised in the plain zone, in which 74% were local breeds and hybrid and 19% are exotic breeds and the main purposes of their raising are for breeding and extra income generation after rice production [2]. Small scale pigs’ production in Cambodia generally depends on locally renewable feed resources, only 20% of commercial feed was used in small scale system [3]. Cambodians consume about 3.2 million pigs a year, or about 8,767 pigs a day (personal communication, 2018). However, local production is not enough for consumption in the country and the importing of 1250 heads every day from neighboring countries to meet the local demand [4]. Pig production could be performed sustainably by feeding availably local feed resources, but diseases, lack of technique and low selling price were the most common problems within small scale pig production. Farmers claimed that common diseases were Foot and Mouth Disease (FMD), diarrhea, Classical Swine Fever (CSF) or hog-cholera and parasites [5]. This study is to investigate the small-scale pigs’ production of ethnic people, living in upland areas of Ratanakri province.
The study is mainly focused on small scale pigs’ production system (local breeds) as they could be more sufficient in converting higher fiber feed, especially banana pseudo stem and rice bran. Therefore, one province, named as Ratanakiri, located in the remote northeast of Cambodia with most of farmers still engaged with this system were selected for the study. There were 3 districts, 3 communes, 9 villages (3 for each commune) and 126 families totally (14 families for each village), chosen as representative respondents, following to the arranged questionnaires. The informants at the village level were completely randomized and interviewed.
This survey and interview were conducted completely for one month including questionnaire preparation in upland area of Ratanakiri province with 3 districts, 3 communes and 9 villages where the farmers still raise the local pigs and supplement with local available feed resources as basal diet was selected. Totally 126 informants were sampled for interview. It was noticed that only the residents with pigs’ production would be selected to answer by questionnaire.
The data from the questionnaire was analyzed by using SPSS software program version 16.0 for frequencies of the descriptive statistics.
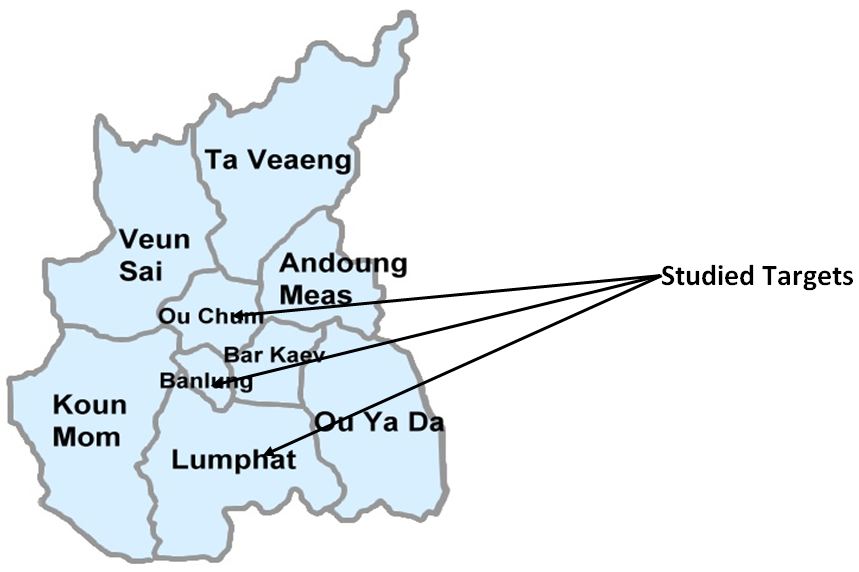
There are totally nine districts, 49 communes and 243 villages, covering about 10,782 km2 with total population of 184 000 in Ratanakiri province. The ethnic minorities form about 75% of the total population, comprising 8 primary ethnic groups: Tampuon, Kreung, Cha Ray, Pnov, Pnong, Ka Vet, Ka Chak, and Lun. However, only 3 districts and 3 communes were selected to investigate the small-scale pigs’ production system of ethnic residents which generally, local breed pigs and renewable resources as feed are applied. Forest area is 967,901 ha and wildlife sanctuary and protected area are 204,183 ha [6].
Three districts of Banlung, Lumphat and Ou Chum with population of 16 999, 10 301 and 11 863, respectively. Banlung has 3 communes and 16 villages, Lumphat has 6 communes and 26 villages and Ou Chum has 7 communes and 37 villages [7]. The subsistence agriculture farming was applied by the residents there to support their living standard. Those activities were mainly focused on rice cultivation, cassava, soybean, cashew, banana, scavenging pigs, chicken, cattle and buffalo production. Moreover, the subsistence farmers also relied on gathering forest product for their livelihood.
The data from this survey indicated that each household had the average member in the average from 5-8 people as reported by Bannister-Tyrrell, et al 2018 that 71% of the households comprised up to 7 members in the average and most households (85.6%) were headed by men in Ratanakiri [8]. The education was quite lower and very small number of populations who could read and write, compared to those who living in low land areas (Table 2). For those who could read and write, even could use communicating words in these areas are generally promoted as community leader, village chief or commune chief or holding other role in developing their communities. As the ethnic group, they generally used their own languages to communicate each other among the group and communities. (CARE-International Cambodia, 2002) also reported that less than 10% of population in Ratanakiri completed primary school and 32% of ethnic minority villages had no schools at all because of long distance to schools, children were required to contribute to their families’ livelihood, different language (they used their own language for communication) and frequently absence of teachers [9]. The education of population there were very low and about 45% of the population were illiterate (https://en.wikipedia.org/wiki/Ratanakiri_Province).
Their main occupation was relied on upland rice cultivation, soybean and cassava farming, subsistence vegetable production and livestock productivities of yellow cattle, buffaloes, local pigs and chicken by freely scavenging system. It was noticed that the extensive agriculture or extensive farming and subsistence agriculture were applied by ethnic people in Ratanakiri province.
Moreover, most of them have been focused on the swidden agriculture practice, but rapid changing recently due to agricultural transition, resulting in the decline of plant diversity [10].
Raising animal was the second agricultural activities of the framers in Cambodia, following to rice and crop cultivation so that it also played an important role in supporting their livelihood and income generation. About 21612 cattle (19,769 breeding cattle and 1,843 ploughing and transportation), 14824 buffaloes (10,819 for breeding and 4,005 for ploughing/transportation), pig of 32 236 heads, poultry of 127 731 heads were raised in Ratanakiri (MAFF, 2014). However, the total numbers of livestock in the targeted areas were different due to their preference, available resources and geographic areas (Table 3).
The result of this study showed that 47% of farmers could own cattle in average of 2-5 heads and only 6% were interested in buffaloes’ production about 1-2 heads per household. The main purposes of the production were for breeding, food security and praying for religious status, especially while they got sick but not for ploughing and transportation. The chicken production was also considered by the farmers there around 3-10 heads per household, but freely scavenging chicken production were applied. 78% of the farmers there had pig in the amount of 2-5 heads and 26% kept the female pigs for continuously breeding, rather than fattening pigs (Table 4). However, mating of the gilts or sows were natural option without any paid, it means the pigs did by themselves in somewhere nearby the house or in the forest. The result from this study was similar to (RUA team, 2014) reported that 76% of the farmers in Ratanakiri raised the pigs ranged from 1-5 heads, 21% had from 6-10 heads and 12% raised over 10 heads.
The main purposes of freely scavenging pig production of the ethnic people in the targeted areas were for meat consumption and dedication to the status for religious belief about 2 times a year and in some case, for treatment of illness or fever of their families’ members. Only 26% of the farmers were able to get some benefit from selling their pigs’ production and all of them sold their animals in the farm gate to the middleman. 74% of the ethnic people kept their pigs for traditional ceremony and dedication to religious statuses, mainly while the families’ members got sick or abnormal condition. However, the female pigs were popular to them, because they could gain more population and careless about payment for piglets. The breeding program was generally unscheduled and unpaid as the pigs did it by themselves with unknown boar in the forest nearby their house or in the farm. Thus, the purposes of raising the pigs of the farmers there were mainly for traditional ceremony, dedication, home consumption and breeding. It was quite similar to what reported by RUA team 2014, 65% of the farmers kept the pigs for traditional ceremony, 21% for breeding and 14% for family income generation, especially selling while high market price. It was very contrast to the people living in lowland areas that their main purpose of raising pigs was to sell for the benefit up to 80.50% [5].
70% of small scale pig production system was the most common way, practiced by smallholders in Cambodia [11]. This type of production often means two or three pigs. The available feeds were approximately from agricultural by-products of rice bran, broken rice and forages and kitchen wastes, were applied. About 85% of the pig smallholders produce local pigs in the lowland areas due to lower investment, resistant to infectious diseases, adaptation to local environment, and were able to rear as scavenging system [12]. According to confinement systems are a common way of raising pigs in rural areas of Cambodia, but free-range systems also occur [5]. Their common breeds were local ones of Kandol, Hinam and Domrey. However, since 2010, local breeds of pigs in lowland areas seem disappeared gradually because the farmers started producing hybrid pigs that could meet the market demand and their growth rate and market price was much higher than local ones. However, amount of pigs in Cambodia was not sufficient and needed to be imported from neighboring Countries.
In 2013, referring to rural livelihood improvement project (RULIP), funded by IFAD (enabling poor rural people to overcome poverty), worked in 6 districts and 30 communes with 101 targeted villages in the purpose of improvement of poor rural livelihood by their existing agricultural farming improvement of livestock, vegetable and crop production. Pig production was one of the agricultural activities in the project that need to be improved, especially introduction of crossbred to meet the market demand, of the confined system rather than scavenging, and the ways of feeding with nutritional feed [13]. However, according to this survey of pig production system in three targeted sites found that all farmers still practiced freely scavenging system due to less feed supply which was only one time a day in the morning before leaving to other farming that was away from their house. The natural resource feed of banana pseudo stem, taro stem, broken rice, rice bran, kitchen waste and very small amount of other agricultural waste generally utilized Moreover, the technical experiences and knowledges in the pig production of the residents there were limited. Their critical thought about pig production was just for praying to ghost or religious status in the region, following to their belief when they got sick rather than for their family consumption and economic improvement. This led them careless of feeding the nutritional feed following to the requirement of the pigs and also of the management. The female pigs were more popular in the production because they were more beneficial. The gilts sows were crossed naturally without any payment for boar as they did by themselves with carelessness of the owners.
The study found that all of indigenous people in the targeted areas applied scavenging pig production system, following to the experience from their ancestors. This was because some mainly constraint factors of more illiteracy, poor technical extension service and most of them just experienced in subsistence agriculture. This system was done for year-round by just feeding one time in the morning. The feed of pigs was typically from scavenging in the forest or the farms of industrial crops such as earthworm, cassava root, leaves of the plants…etc. It was noticed that this non-profitable system is still continued by carelessness of productivities because they did not do business in the pigs’ production and their livelihood was also not depended on the pig raising. In the contract from who reported that the people in low land areas usually kept their pigs freely based on several reasons of avoiding stress, less labor to take care of, and not in the season of plantation…etc [5].
The majority of workers in Ratanakiri were employed in agriculture for the living standard of indigenous people or ethnic groups. The most incomes generated from on farm activities rather than off farm. By the group discussion and individual interview found that the main incomes were come from subsistence agriculture such as rice cultivation, soybean, cassava, cashew, vegetable and livestock productivities (local pigs, yellow cattle and poultry). However, handicraft of clothes and from bamboo of baskets and non-timber forest products generated some extra income. The daily income among three targeted areas were quite similar less than 4 000 riels per person (less than 1 USD). Following to data of the study indicated that most of the residents were interested in feeding livestock for religious belief and their home consumption rather than income generation, only 32% of the respondent were able to make some money from their pigs’ production, even though the price of the fattening pigs there was quite higher up to 2.25$ per Kg of live weight, compared with lowland areas was only 1.75$ in 2017. Due to more stable price and the better flavor and texture of the meat of indigenous pigs, the conservation and promotion of this breed could be integrated into the national strategic plan of general department of animal production and health.
Pigs’ production of indigenous people in the target was dominated by small-scale production and freely scavenging system through additional feed supply of mostly available locally natural resources such as cooked banana pseudo stem and broken rice, taro, kitchen wastes…etc. The mortality rate of pigs was 65%, 53% and 46% in Yeak Loam, Lbang Muoy and Ou Chum commune, respectively. This high rate is due to predators, infectious diseases, unscheduled de-worming, no any vaccination program and poor nutritional feed supply. Menghak, et al, 2014 also mentioned that poor feeding, no deworming and vaccination programs; resulting to high risk of diseases and mortality [14]. Moreover, land converting from forestry-covered to agro-industry land and economic land concession, caused less availability of scavenging areas. 88%, 73% and 86% of small pig producers in Lbang Muoy, Ou Chum and Yeak Loam, respectively produced the fattening pigs for over 8 months to reach the market weight. This fattening period was longer due to poor feeding of approximately one time a day in the morning with cooked banana pseudo stem and broken rice, then mixture with small amount of rice bran and/or sometime included the kitchen waste as well, compared to that just spent from 5-6 month to get the market, but providing enough home-made feed of three times a day [15]. In addition, the linkages between all relevant stakeholders by indigenous people were also very poor from producers to slaughterhouse.
General directorate of animal health and production of Cambodia (GDAHP) is the ruling institution being responsible for guarantee of animal welfare, vaccination, infectious disease outbreak minimization and illegal activities concerning with animals. Since 2016, the law on animal health and production had been approved and applied in the objectives of ensuring animal health and production, protection of human health, animal welfare and environment, prevention and alleviation of infectious diseases outbreak, and ensuring the supply of the quality of products. Moreover, the guideline on how to slaughtering of the animal in Cambodia which was called “108” had also been declared by ministry of agriculture, forestry and fishery [16]. Vaccination program was done annually by GDAHP, mainly for cattle and buffaloes, actually not for pigs that were core labors for supporting the agriculture activities of the farmers. The vaccination of cattle and buffaloes was normally available for all targeted destination with free of charge. The disease which was annually vaccinated for was blackleg disease; following to frequently local disease outbreak and due to less program budget from government and also poor donation from international NGOs, other vaccination program of the animals against FMD and HS were not able to apply for.
The potential villager is generally selected as village animal health worker (VAHW) by district veterinarian to be trained him/her some technical manners of the ways of treatment, diagnosis, vaccination, deworm, castrate and animal production as well. His/her responsibilities are to assist the farmers to improve their animal production and also to report to district veterinarian in case of disease outbreak. Moreover, they also acted as local extension workers to ensure the stability of animal production of the farmers and to inform the farmers, in case of infectious disease outbreak. It is sometime difficult to change the attitude of the farmers to eat the death and sick animals, when their animals got sick and could not be treated; they generally cooked and invited other neighboring residents or relatives to join the meal. This could be one of the cause of diseases infection while the animal production was applied the free system or scavenging system.
This survey was also indicated that village animal health worker (VAHW) did not function very well as the pigs’ production of the ethnic groups were not mainly for income generation, but for praying to the ghost or god symbol in the forest for better health, especially when they were seriously sick. Thus, they were not willing to pay for the vaccination and treatment of their pigs. However, the roles of VAHWs in the villages were very important as they could report any updating of the data of the animals in their villages and critically informed any disease outbreak to district veterinarian to take an action for prevention of more spreading to other animals in the villages or others nearby.
All indigenous breed of pigs in the studied targets were completely local breed-base, named as Kandol. It is popular breed in Ratanakiri due to more reproductive and resistant to infectious diseases. Moreover, they could be fed with lower dry matter content diet and able to scavenge the feed by themselves nearby the house as the freely raising system was applied. This breed was just available in upland areas as dominated by cross-bred pigs in lowland areas, mainly in near urban where was accessible to the market [15]. Deka, et al. 2014 reported that two different aspects of indigenous pigs in southeast Asia and in south Asia: a) Indigenous pigs of SE Asia are fattier compared to that of South Asian pigs and b) Indigenous pigs of SE Asia generally have concave back while indigenous pigs of South Asia have straight back [17]. It was also noticed that indigenous breeds of pigs in SE Asia are more productive than indigenous pigs in South Asia
The survey also found that indigenous people have inadequate knowledge and experiences in breeding program and breeding management, so natural breeding program and no any charge for boar service was still predominant. Indigenous sows and gilts were usually mated by the unknown boars, sometime by wild boars in the forest. Because of this careless behavior on the breeding program, high mortality rate of newborn piglets was the main constraint which need to be improved. In addition, artificial insemination (AI) was not practiced yet by the famers in studied targets. However, pig breeding program in low land areas trends to be improved currently, even by AI or quality boar [5]. However, newborn piglets’ mortality of smallholder pigs farm was higher than of large-scale pigs’ farm [18].
The basal feed of the pigs practiced by farmers in Ouchum and Yeak Laom communes were mainly cooking together between banana stem or jungle taro stem, and rice/broken rice, then mixture with small amount of rice bran and occasionally with kitchen waste before feeding their pigs while others in Lbang Mouy only relied on rice soup and rice bran (Table 5). The feed was typically chopped, mixed, and cooked before feeding to their pigs. It was noticed that only one time feeding in the morning was generally practiced. Other complement feed was from their scavenging, the pigs generally were finding out the feed by themselves in the farm and in the forest. The feeds from scavenging were mainly plant roots, plant leaves, weeds, earthworm, duckweeds…etc. The feeding style of the ethnic people was different, depending on the local availability of the feed and experiences. With this behavior of feeding system, their pigs’ production would take longer period to reach the market weight, compared to the production done by someone in low land areas [19].
Notice: Banana stem, jungle taro, rice, rice bran and kitchen wastes were mainly basal feed of the pigs of the ethnic people in the selected targets while others were from scavenging. Only one time feeding a day in the morning.
This study found that common diseases affecting the pigs’ production were classical swine fever, food and mouth disease (FMD), Salmonellosis and parasitic infection of both internal and external. Vaccination and de-worming program were actually not applied. These infectious diseases were mainly negative effect on pigs’ production of the targets. (Borin et al., 2012) indicated that 70% of the smallholders in lowland areas vaccinated their pigs, but 59% still got infection in their pigs [3].
By personnel communication with agriculture officers, estimated demand of the pigs in Ratanakiri town was ranged from 40-50 heads a day while about 5-8 heads per day were needed in the district town. However, the demand would be increased in some important traditional ceremony such as Khmer traditional wedding, Pchum Ben day (religious ceremony) and Khmer New Year. CP Cambodia was the main supplier of pigs in Rattanakiri markets, covered between 1,500-2,000 head per month and about 70% of total market demand and Vietnam pig is the second one of about 20% while only 10% are from local smallholders [20]. Pork was the favorite meat among Cambodian people (WFP, 2010). They consumed about 9.29 kg of pork a year, and pork market demand has increased from year to year due to higher growth rate of population [12].
The no any different constraint among the targets on the animal production of indigenous people. Common challenges of infectious diseases, parasite and malnutritional and inadequate feed supply were the big concern for the scavenging pigs’ production system of them. As result of this survey, their pigs usually were fed only one time in the morning with the locally available resources of rice bran, milled rice or together with rice soup plus some vegetable occasionally, because they obligately worked away from their house for other crops and vegetable farming, so the pigs were needed to look for the extra feed by themselves in the rest of the time in somewhere nearby the house and other farms (Table5). Diseases outbreak, the parasite infection and predators among the targets were also significant challenging as all of indigenous producers of the pigs applied scavenging system, causing poor management and diseases control. Poor extension services on the intensive animal production or some innovation from provincial department of agriculture and limited access to market information were also involved into low productivity. 58%, 51%, 46% of respondents in Yeal Loam, Ou Chum and Lbang Muoy were able to access the technical service and market information about the pig’s production, mainly from extension officers of the provincial department of agriculture and middle men and their neighbors as their living sites are closed to the relevant stakeholders. The linkage closely between producers with the traders/slaughterhouse could be the important structure to better updating the market information and also to increase the pig productivity of indigenous people for their livelihood improvement as well rather than for traditional ceremony and for magic purposes to be better health in case of affecting diseases.
The study found that small scale pig production by ethnic people in Ratanakiri was mainly scavenging-based productivity with locally indigenous breeds which led lower production. Breeding program was not interested by allowing their adult pigs crossed each other naturally as the owners usually did not know their animals got pregnancy or the time of giving the birth at all. Feeding system behavior was completely distinguished from the people who living in low land areas which only one time of feeding was offered in the morning with local available resources of cooked banana stem or taro and broken rice, rice bran…etc. In addition, prevention or vaccination and deworming schedule were not applied as well that were easier to be infected by some seasonal illness and parasite. Together with some several issues above, encouragement to the farmers to adaptation of new technology in pig production for the market demand and for improvement of their living condition rather than just for traditional ceremony, of linkages between farmers and local animal specialists and the traders to produce healthy animals and to share market information, respectively were very necessary.