Prevalence of Gingival Stippling among 4-8 Years Old Children
Introduction: Gingival stippling is a characteristic of the healthy attached gingiva and its diminution or loss has been considered as a sign of gingival disease. No studies are conducted regarding the presence or absence of stippling in children as searched by EBSCO host, PubMed, Google, Science direct, Willey’s online library until 8th July, 2016. And hence there is need for the best evidence in this field.
Aim: To determine the presence or absence of gingival stippling amongst 4-8 years old children.
Materials & Method: The proposed study was conducted as an observational study. 600 children between chronological age of 4-8 years who reported to the Department of Pedodontics and preventive dentistry, Vadodara were included in the study.
Result: In 151 (51.2%) male and 156 (51.1%) female stippling was seen. Stippling (Visual) was seen in 307 (51.2%) children.
Conclusion: Gingival stippling was seen as a normal characteristic in both male and female.
Keywords: Stippling; Prevalence; Gingiva; Children
Gingival stippling, that's “orange peel” look of healthy gingival surface is a distinguishing feature of the attached gingiva [1]. Usually this stippling from the gingiva is lost in cases of gingival inflammation extending to attach gingiva from marginal gingiva1
Nevertheless, as soon as the gingival health is re-established, gingival stippling can be appreciated as well. There is sparse literature about the use of gingival stippling in regard to a diagnostic aid [2]. The presence of gingival stippling is unique presentation in every individual; however its configuration, size, and its quantity may vary according to age, gender of a person and site of stippling [2]. Therefore, to use gingival stippling as a diagnostic aid, it is necessary to determine the characteristics of an individual’s gingiva [3].
The presence of stippling contributes to the microscopic elevations and depressions on the surface of the gingival tissue owed to the connective tissue projections within the tissue [3]. The extent and degree of keratinization and the prominence of stippling appear are closely associated. More precisely, stippling is present at the sites of fusion of the epithelial ridges (also known as rete pegs/ridges) and resembles to the fusion of the valleys created by the connective tissue papillae [4].
The stippling, however, is only present in about 40% of adults 68.2% of children, so the texture of gingiva can be highly stippled or smooth, or have intermediate texture between these two limits [4].
Stippling results by alternate rounded protuberances and depressions in the gingival surface varies with age [1]. It is lacking in infancy, appears in certain children at about 5 years, upsurges until adulthood and starts to disappear at old age [2]. The stippling is usually more prominent on the facial surfaces when compared to the lingual ones [2]. Also in some individuals, stippling can be absent as well. The pattern and extent of stippling highly varies among children, and different sites in the same oral cavity. Attached gingiva is stippled, marginal gingiva is not. Stippling is best viewed by drying the gingiva Similar to orange peel (stippled) [4].
Reviewing back the literature in terms of prevalence of gingiva, lead to sparse and anecdotal information. Therefore, the need of the present study was to determine the prevalence and distribution of gingival stippling in children of various ages.
The proposed study is an observational study. Subject selection and data collection was initiated after IEC approval. The IEC approval number was SVIEC/ON/DENT/SRP/16186. The data collection was done on the prepared proforma after examination of each patient. The purpose and nature of the study was explained to the participants and their parents prior to the study through the information sheet. Informed written consent and assent form was obtained from participants and their parents before examination.
Total 600 children between chronological age of 4-8 years reporting to the Department of Pedodontics and preventive dentistry KMSDCH were included in the study. The age 4-8 years were chosen as according to most of the literature on gingival stippling, it states that stippling occurs after age 5 [5]. However there are many cases in which we observe gingival stippling before the age of 5 years. Hence to affirm this fact the present age group was chosen. Also the children participating in camps conducted by the department were included. Informed written consent was taken from patients/guardians in English/local language (Gujarati).
Children aged 4-8 years with healthy gingiva were included in the study. Children with medical conditions or behavioural problems like ADHD (Attention deficit hyperactive disorder), systemic/medical/physical disabilities, parents not willing to give informed written consent and children having poor periodontal health were excluded from the study.
First the demographic details were collected and entered in the proforma. Principal investigator conducted the oral examinations. For data recording purpose an observer was trained who helped the Principal investigator during data recording. The principal investigator was calibrated for the oral examination by the co-investigator in the department.
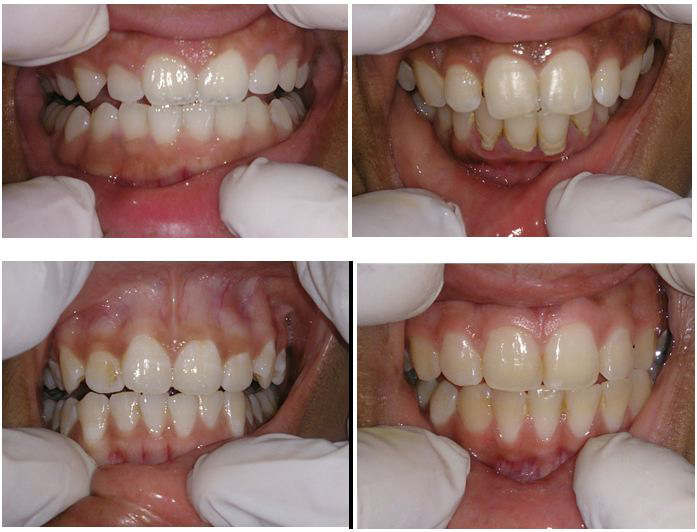
The child was seated in upright position. Gingival index was recorded as per the proforma. Stippling was checked in natural day light in maxillary anterior attached gingival after drying the gingiva with cotton or gauze piece. Photographs of clinical intraoral examination were taken for photographic evaluation. Data was entered in the proforma.
Data collected was entered into a computer and analyzed using the SPSS software. Level of significance is fixed at p=0.05 and any value less than or equal to 0.05 is considered to be statistically significant. Chi square analysis is used to find the significance of study parameters on categorical scale. Analysis of variance (ANOVA) is used to find the significance of study parameters between the groups (Inter group analysis). The Statistical software IBM SPSS statistics 20.0 (IBM Corporation, Armonk, NY, USA) was used for the analyses of the data and Microsoft word and Excel were used to generate graphs, tables etc.
The demographic characteristics of the children who participated in the study is shown above in Table 1. The sample consisted of 295 boys & 305 girls. The difference in age between boys and girls in the study population was not statistically significant( Figure 1).
On clinical examination gingival stippling is found in 51.2% children, whereas it was absent in 48.8%. Similar result was obtained after viewing the photographic data which was also collected demonstrated above (Table 2).
On comparing the presence of gingiva between two genders, it was noted that males (n=151) showed 51.2% gingival stippling and females (n-156) showed 51.1% gingival stippling. There were no statistically significant differences in the distribution of gingival stippling by gender in the whole sample. The results are demonstrated in Table 3
Considering the age, it was noted that gingival stippling is present from 4 years old child. Table 4 demonstrates age wise distribution of children and presence or absence of Gingival stippling.
Gingiva is a fibrous investing tissue, covered by keratinized epithelium, that immediately surrounds a tooth and contiguous with its periodontal ligaments and with mucosal tissues of the mouth. According to Glossary of Periodontal Terms 2001; attached gingiva is the portion of the gingiva that is firm, dense, stippled, and tightly bound to the underlying periosteum, tooth and bone, while gingival stippling is the pitted, orange-peel appearance, frequently seen in attached gingiva.
Gingival stippling is a characteristic of the healthy attached gingiva whereas its attenuation or loss has been considered as a sign of gingival disease. The clinician must take in consideration that pattern and extent varies in every mouth, among persons and with age.
Stippling also varies with age. It is absent in infancy, appears in some children at about 5 years of age, increases until adulthood, and frequently begins to disappear in old age.
The present study confirms the fact that gingival stippling is usually evident from 4 years of age. One of the study confirms the fact that gingival stippling may be evident in infancy, from age 3 years [1]. Studies done on gingival stippling in children are few and provide inconsistent data on the age of onset of gingival stippling in children. Greene and Glickman were first to describe that it is evident at age 6 years [2,3]. The differences between the studies may be the result of different criteria, material and methods.
As reported the prevalence of gingival stippling in adults indicated that it may normally be evident in 40% of adults. Carranza indicated that the prevalence of gingival stippling in children aged 5 to 13 years is 35% [4].
Reported prevalence values for gingival stippling in adults indicate that it may normally be evident in 40% of adults. Similarly, Carranza indicates that the prevalence of gingival stippling in children aged 5 to 13 years is 35%. The difference in the prevalence values may be related to differences in population characteristics or methodology.
The presence or absence of gingival stippling can lead to early diagnosis of clinical gingivitis which can be stopped from further destruction and progression towards periodontal diseases. Presence of gingival stippling is a sign of a healthy gingiva which corresponds to absence of gingivitis. In this way the gingival stippling can be of a valuable diagnostic element [10-12].
Gingival stippling may normally be absent in healthy attached gingiva. Therefore, only absence of stippling cannot be a sole indication of disease state of gingiva. In the present study however, we did not find evidence of an increase in the prevalence of gingival stippling with age, and no statistical significant difference was found in prevalence between boys and girls. These finding however, may be related to the fact that the number of individuals in each age group in the present study was small. Therefore, a larger study group is required to reach definitive conclusions on these issues.