Residents’ Perception and Response to Natural and Industrial Environmental Hazards and Risks in Coastal Towns of Nigeria: The Niger Delta Experience
Purpose: The purpose of this paper is to examine residents’ perception of natural and industrial environmental hazards and risks and their reactions to these hazards in their environment. This came about based on the recognition that environmental hazards and risks do not give notice of their occurrence but are tackled through careful planning and preparedness. Perception studies become imperative because many environmental problems require that solution be sought from various point of ignorance therefore information from people’s knowledge and reaction to environmental hazards and risks aid policy makers in making enlightened decisions on management of disaster.
Design/methodology/approach: The study used household survey through questionnaire administration. Three coastal towns were randomly selected. These are Sapele, Oghara and Koko. Across the three towns, a total of 211 residents were systematically sampled on which designed questionnaire were administered.
Findings: Variation existed in residents’ level of awareness and severity attached to each type of hazards across the three towns, however, residents attached more severity to threats emanating from industrial activities than natural events. Also, the study found out that the principal response to threats from industrial hazards was agitation/protest while respondents employ ‘do nothing’ approach in response to natural hazards.
Research implications: The study is capable of generating hypotheses for future research in the area of disaster management and environmental studies, especially in the developing world.
Practical implications: The research results and recommendations can provide information on future policy making, review and implementation on disaster management and other related issues in environmental studies both in the city and others with similar setting.
Originality/value: This paper is based on primary data from a survey of residents of Sapele, Oghara and Koko, Delta State Nigeria in December 2017. Its significance lies in its capacity to suggest policy responses for enhanced liveable environment through perception studies, a bottom-up approach to policy making.
Keywords: Environmental Hazards; Environmental Risks; Natural Hazards; Industrial Hazards; Environment; Degradation
The enhanced pace of developmental activities and rapid urbanization globally have resulted in stress on natural resources and quality of the environment. These developmental activities have made many urban centres an abode for environmental hazards. The impacts of these developmental activities are strongly felt in the urban centres of the developing world. Urban centres in developing countries contain some of the world’s most life-and health threatening human environments [1,2]. The risks in urban centres in the developing world can be attributed to inadequate attention usually given to environmental hazards by all concerned stakeholders [1,3-5]. The presence of environmental hazards in the living environment is adverse to improved health and attainment of potentials. Environmental hazards are potential threats posed to man or nature by events originating in, or transmitted by, the natural or built environment. Hazards and risks are Siamese twins in environmental context [6]. As such, environmental hazards are strongly associated with corresponding environmental risks. Thus, environmental risk is a probability of occurrence of a particular adverse effect on human health or on the environment as a result of exposure to hazard [7]. Of particular concern to this study are environmental hazards and risks manifesting in the coastal towns (intersection between land and sea) of Nigeria. Coastal environmental hazards are described as the natural and man-made events that threaten the health of coastal ecosystems and communities [8,9]. They arise from natural processes that are hydro-meteorological, geophysical and human actions. Hydro- meteorological hazards include tropical cyclones, storms and floods, geophysical hazards include earthquakes, tidal waves and tsunamis while man-made hazards peculiar to the coastal towns, especially in Nigeria, are oil spills, gas flaring, dumping of waste, among others [9]. Oil exploration, exploitation and transportation had begun for several decades since its discovery in 1956 in Oloibiri a coastal town in the south-south part of Nigeria. These activities have had hazardous impacts on the environment in the region and have adversely affected people inhabiting that region. The region is rated one of the most oil-impacted environment and hazardous area in the world [5,10-12]. The hazardous environmental condition can be attributed to various industrial activities carried out during the oil drilling process such as gas flaring, oil spillage, dumping of hazardous waste, noise, heat, soil contamination, among others etc. Coupled with these are natural environmental hazards such as erosion, flood, and cyclone among others which are prevalent in the region. The risks associated to these environmental hazards are offensive odour, air quality reduction, increased cancer rates, respiratory illness, skin diseases, alteration of micro-climate, poisoning of aquatic animals and breeding of pests and diseases (including marine infested diseases) [13].
The coastal environment of this region is fast becoming an ecological waste land. This is because, the resultant impacts of the natural and industrial environmental hazards has manifested in different forms of sufferings such as in land displacement, economic backwardness, social unrest, diseases, and violent protestation in many towns etc. Industrial activities become environmental hazards when they become threat to people and life-support systems which arises from their mass production of goods. Although Nigeria is experiencing economic gains from industrial activities in this area, the proper management of the wastes, by-products and other natural events triggered by oil exploration are not adequately attended to.
Existing works on environmental hazards and risks in coastal environment especially in the oil producing areas of Nigeria are numerous. For instance, studies on the impact of environmental degradation on the socio-economic wellbeing of the people are (Abegunde, Olayiwola & Adedokun, 2006; Etuonovbe, 2009; Kadafa, 2012; Raji & Abejide, 2013; Okpako & Berewai, 2014; Omorede, 2014) [4,14-18]. Studies that examined the impact of oil exploration on the environment had been examined by (Kadafa, Zakari & Othman, 2012; Oteh & Eze, 2012; Ubani & Onyejekwe, 2013; Ogwu, Badamusuiy, & Joseph 2015) [5,16,20,21]. Also, Ologunorisa (2009) Efe (2010), Etuonovo (2011), Ojeh & Ugboma (2012) and Inyang (2014) examined strategies to mitigate natural environmental hazards and risks while the health implication of natural and industrial hazards on people had been examined by (UNEP, 2000; Olajuyigbe, Rotowa & Durojaye, 2012; Omorede, 2014) [13,27,18]. Although, in the discussion of these components, the impacts environmental hazards and risks have on the environment has not been jettisoned; it has not been extensively discussed with respect to how residents perceive these environmental hazards, the severity they attach to the risks and their reactions to the threats in the environment.
Perception is the individual awareness and processing of raw data received from the environment. Perception of the environment helps man to understand and react to his environment.The basis for the introduction of perception in this study is premised on the fact that perception data can be a tool in proffering solution to different problems in different human endeavours [28]. People’s knowledge and reaction to environmental hazards and risks are central to limiting the effects of environmental hazards and risks. It links the concern of human activity with the need to practice and anticipate future situations. This is because better information on how people perceive and react to environmental issues may lead to more enlightened decisions. Thus perception involves the examination of people’s awareness, emotions and behavior with regard to their environment or any other perceived object [29].
The findings of environmental perception studies could be helpful in designing education and enlightenment programs to mitigate environmental hazards and risks in the study area. Efforts aimed at mitigating environmental hazards will improve the environmental quality, environmental health and prevention of diseases, among others. Perception studies also reflect the public concern of their environment, by which issues and cries which may lead to crisis, uproar, and disaster can be averted. Information from perception studies could guide policy makers in making enlightened decisions. Therefore, this study could also serve as a model to militate against environmental hazards and risks in areas with similar geographical and socio-economic characteristics. Based on the for egoing, this study empirically investigates into the background of the people, in relation to their perception and reactions to inherent environmental threats in the study area.
The three coastal towns under focus are Sapele, Oghara and Koko, all in Delta State of Nigeria. Delta State is one of the coastal and oil producing states in Nigeria. It is located approximately between latitude 5° 00’ and 6° 30’ North of the Equator and 5° 00’ and 6° 45’ East of the Greenwich Meridian. The state is the second major oil producing state in Nigeria and it supplies about 35% of Nigeria’ s crude oil and some considerable amount of natural gas [30]. The town of focus for this study are Sapele, Oghara and Koko. Sapele is one of the most important industrial port towns in Nigeria. It is the administrative headquarters of Sapele Local Government Area (LGA). It lies along the Benin River just below the confluence of River Ethiope and River Jamiesan.Sapele Township has for long become a cosmopolitan town of mixed Nigerian tribes and other people from different parts of West Africa due to the high level of commercial activities operating in the town. The population census of Sapele as at year 2000 was 184,766 [31]. At a growth rate of 3.1%, the estimated population of Sapele is 320,094 persons and a total landmass of 291.37km.
Oghara is a town and the administrative headquarters of Ethiope West Local Government Area (LGA) of Delta State, Nigeria. The population of LGA according to the National Bureau of Statistics (2011) is estimated to be 247,620 persons. Also, Oghara is the hub for commercial activities in Ethiope West LGA. The town is rich in human, mineral and forestry resources and also one of the major clans of the Urhobo ethnic group. Oghara is almost surrounded with water and is inhabited by the Urhobos, Itsekiris and Ijaws. The major occupations of the people are commercial fishing, salt production, and lumbering and rubber production.
Koko is a cosmopolitan town and a sea port in Delta State, Nigeria. Koko is the administrative headquarters of Warri North Local Government Area. It is predominantly riverine and it is inhabited by the Itsekiris, Urhobos, Ijaws and Izons. It serves as an agricultural trade centre for the Itsekiri people [32]. At a growth rate of 3.1%, the estimated population of Koko is 81,975 persons. The major occupation of the people are fishing, carving of canoes, net weaving, hunting, clothes dyeing, trading and farming. Koko came into the limelight in 1987, when Italian businessmen shipped toxic waste from Italian factories to Nigeria for storage in the backyard of a Nigerian businessman in the town. This toxic waste dumped raised the consciousness of the government to protect the environment. This led to the creation of Federal Environmental Protection Agency (FEPA) in 1988 and the promulgation of Harmful Waste (Special Criminal Provisions) Act, 1988. Despite the confirmation that the substances dumped in the community was toxic, the people of Koko resisted attempts by the federal government to relocate them to an improvised settlement (National Mirror, 2015) [33]. This is because the people of Koko have a different perception about the toxic waste delivered in the town.
This study was based on a field survey via questionnaire administration. Multistage sampling procedure technique was employed to arrive at the target respondents. First is the adoption of political wards in the three selected towns. Sapele comprised seven wards; Oghara comprised five wards and Koko comprised three wards. One ward was selected randomly out of every three wards in each town. Thus, three wards were selected in Sapele, two in Oghara and One in Koko. This stage is preceded by the determination of the number of streets in the selected wards. Reconnaissance survey revealed that there are 183 streets in Sapele, 127 in Oghara and 44 in Koko. Based on selection of one out of every ten streets, eighteen streets were selected in Sapele, thirteen in Oghara and five in Koko. The sample frame for the study was all the buildings on the selected streets.
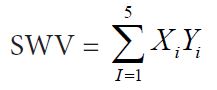
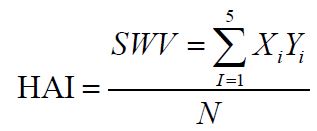
Following this, is the determination of the number of buildings in the selected streets. Reconnaissance survey revealed that there are 546 buildings on the selected streets in Sapele, 343 in Oghara and 187 in Koko. Using systematic sampling technique, every 5th building was sampled. Thus, 110 buildings were sampled in Sapele, 70 in Oghara and 38 in Koko. Thus a total of 218 households’ heads were sampled from the 218 buildings selected. The focus was on an adult resident in each of the selected buildings. Issues addressed in the questionnaire included socioeconomic attributes of the residents, those pertaining to residents’ perception of natural and industrial environmental hazards and risks as well as residents responses in their towns. Variables on level of awareness of environmental hazards were obtained using a 5-point Likert scale. Residents were to express their opinions using any of not at all aware (NA=1), slightly aware (SA=2), somewhat aware (SMA=3), moderately aware (MA=4) and extremely aware (EA=5). The respondents were likewise requested to rate the level of severity of the risks associated with the identified environmental hazards on a 5-point Likert scale using any of not at all severe (SS=1), slightly severe (SS=2), somewhat severe (SMS=3), moderately severe (MS=4) and extremely severe (ES=5). Mean index was used to analyse level of awareness of hazards and level of severity of risk attached by households with the results likewise presented using tables. The analysis of the responses evolved ‘Hazard’ Awareness Indexes’ (HAIs) and ‘Risk Severity Indexes’ (RSIs). Also computed are the mean Hazard Awareness Indexes’ (HAI) and mean Risk Severity Indexes’ (RSI). The Sum of Weighted Value (SWV)for each item was obtained through the sum of the product of number of responses of each item and the respective weighted value attached to each rating. This is expressed mathematically as:
Where:
SWV = summation of weight value,
Xi = number of respondents to rating i;
Yi = the weight assigned a value (i = 1, 2, 3, 4, 5).
The HAI for each item on the scale was arrived at by dividing the Summation of Weighted Value (SWV) by the total number of respondents (N=218), mathematically expressed as:
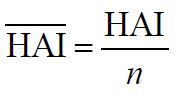
The(HAI) later was computed by summing hazard awareness and dividing by the number of the identified hazard type (n), mathematically expressed as:
Hazard type with the actual value of the HAI indicated a moderate level of awareness of hazard by households. Values with positive deviations indicated high level of awareness while those with negative deviations indicated low level of awareness by households. The ranks of the index values were likewise provided.
The deviation about the Mean Hazard Awareness Index (HAI-HAI) for each of the Hazard Awareness Indexes was also computed. The deviations were representative measures of dispersion that provided information on the level of awareness of environmental hazards as perceived by the residents. The variables with positive deviations had high level of awareness while those with negative deviations indicated low level of awareness. For more understanding of the dispersion of the distribution about the mean indexes, the standard deviation (SD) for each town was computed. The standard deviation measured the degree of spread or dispersion of the level of awareness within the same distribution. A small value of the standard deviation indicated that HAIs clustered around the HAI. In further establishing the above fact and also ascertaining the reliability of the HAI based on the data distribution for each of the institution, the Coefficient of Variation (CV) for each town was computed.
The same procedure that was used in computing the hazard awareness indexes and mean hazard awareness indexes was followed in computing the Risk Severity Indexes (RSIs) and mean Risk Severity Indexes (RSIs) for the three towns. Deviations about each of their Mean Risk Severity Indexes (RSI-RSI), as well as their Standard Deviations (SDs) and Coefficient of Variations (CVs) were computed. Variables with the actual value of the (RSI) indicated moderate level of severity of environmental risks; those with positive deviations had high level of severity while those with negative deviations indicated low level of severity of environmental risk.
This section discusses the socioeconomic characteristics of respondents, sources of awareness, level of awareness of environmental hazards and the level of severity they attach to natural and industrial environmental risks across the three towns.
The socioeconomic attributes of respondents discussed in Table 1 are age, gender, income, educational attainment, type of residency, number of years of residency and household size. These variables have been identified in literatureas factors that influence the perception of people about their environment thus they can be used to predict peoples’ perception of environmental hazards and risks El-zien, et al. (2006), Sonja (2013), Daramola and Olowoporoku (2016), Afon (2011), Olowoporoku (2018) [34-36,28].
Age has been found to be positively correlated with perception of environmental hazards and risks [37,38].The age of the respondents was grouped into four: teenagers (those with less than 20 years); young adults (20 to 39 years); elderly adults (40 to 59 years) and old people 61 years and above. Findings revealed that majority (81.1%) of the respondents were adults (20 to 59 years), 2.8% were teenagers and 16.1% were old people (60 years and above). Respondents within the age group of 40-59 years had the largest proportion (42.2%), followed by those within 20-39 years which accounted for 38.9% Household heads older than 61 years constituted 16.1% while respondents younger than 20 years accounted for the least proportion which was 2.8% the overall mean age in the study area was 44 years. The predominant age groups were adults as such they could give credible information about environmental hazards and risks across the three towns.
The gender distribution of respondents revealed that females accounted for the highest proportion of respondents (65.4%), compared to the proportion of male respondents (34.6%). This implies that among the household heads surveyed, females were more available than males. This might be influenced by home trading and other activities practised by women whereby their trades or businesses are established around or in their residences. In essence, having more of women opinions could be helpful in assessing perception of environmental hazards and risks. Furthermore, Jonkman, Vrijling & Vrouwenvelder (2008) and Xiao &Mcright (2015) established that women are more risk-averse than men. This suggests that men have, on average, a lower risk perception than women. Also they likewise have more information about their dependants (children and old adults) [39,40]. Income is an attribute that shape people’s behaviour and their perception on specific environmental attributes [28,36]. The initial quantitative data were grouped into three: low, medium and high. Incomes below ₦ 20,000 were categorized as low income. This is based on the prevailing Civil Service Salary Scale in the country. The minimum wage at the federal level in Nigeria is ₦ 18,000 while it ranges from ₦ 15,000 to ₦ 20,000 in the states of the federation. The medium monthly incomes were categorized as from ₦ 20,000 to ₦ 70,000 while residents earning above ₦ 70,000 were categorized as high income earners. These mean monthly incomes were further converted to US Dollars for better understanding. Incomes below 55 US Dollars were categorized as low income. This is based on the prevailing Civil Service Salary Scale in the country. The medium monthly incomes were categorized as from 55 US Dollars to 195 US Dollars while residents earning above 195 US Dollars were categorized as high income earners. Based on this categorization, variation in income classes existed across the three coastal towns. Further findings revealed that the average monthly income computed for Sapele, Oghara and Koko was 160 US Dollars, 200 US Dollars and 170 US Dollars respectively while the overall mean income in the study area was 175 US Dollars.
Educational status has a salient contribution in environmental awareness [41]. In Sapele, 38.3% had secondary education, 33.6% had tertiary education while 28.0% had primary education. In Oghara findings showed that 58.8% had secondary education, 23.5% had primary education while 17.6% had tertiary education. Investigation from Koko revealed that 47.2% had primary education, 30.6% secondary education and 22.2% tertiary education. It can be concluded that all the respondents had basic formal education with over two third of them having secondary education and above. These levels of exposure will likely aid the judgment of environmental hazards and risks among households.
Another identifiable factor in assessment of environmental awareness is the type of residency of respondents. Lindell & Hwang (2008) opined that staying permanently in a hazardous place could amplify risk perception. Findings revealed that majority of the respondents in Sapele, Oghara and Koko were permanent residents which constituted 83.2%, 88.2% and 80.6% respectively [38]. For all the three towns, more than three quarter of the respondents (84.4%) were permanent residents in the study area. This implies that they are mostly capable of understanding issues of environmental hazards and risks in their towns and have experience to narrate about the issues. Findings were also made into the number of years of residency of respondents in the study area. As postulated by Eisenman, et al., Reininger, et al. that length of residence of respondent influence environmental awareness [42,43]. This is because the longer the period people live in an area; the more they are likely to understand the prevailing environmental challenges in their area. For this study, the length of residence is divided into four categories of 1 to 10 years, 11 to 20 years 21-30 years and above 30 years.
Table 1 about here
Across the three towns, 14.2% of the respondents have spent less than 10 years in their place of residence, 24.6% spent between 11-20 years, 34.1% spent between 21-30 years while 27.0% have spent above ten years in the study area. Further findings revealed that over two third of the respondents have spent over 10 years in the study area, thus they are likely to have a good experience of the prevailing environmental hazards and risks in the study area. With respect to information on household size, 21.8% of respondents across the towns had household members between 1 and 5 persons and 78.2% of respondents had household members between 6 and 10 persons. More than three quarter of the respondents in the study area had a household size more than five; this indicates that the study area is densely populated as a result of its location, which is an oil rich region.
This section examines sources and the level of awareness of environmental hazards in the study area. Respondents selected multiple options as source of awareness could be more than one. Information on Table 2 showed that the most predominant source of information across the three towns was mass media which constituted (39.7%). The mass media include television, radio and newspapers. This is followed by close associate (members, friends, peer groups and neighbours) (15.0%), internet (9.2%), religious bodies (9.1%) while the least source of awareness was through the NGOs. From the analysis it can be deduced that the presence of NGOs and government agencies in environmental protection is insignificant.
Table 2 about here
Sequels to the findings on the sources of awareness of environmental hazards, investigation were made into residents’ level of awareness of environmental hazards in the study area (Table 3 and 4). Investigations were made on the combination of the two types of environmental hazard identified in the study area. As contained in Table 3 is the HAIs for environmental hazards emanating from natural event in Sapele, Oghara and Koko were respectively 3.336, 3.284 and 3.170. From the findings, erosion and flood were the two predominantly known environmental occurrences in the study area. Across the three towns, level of awareness of erosion was rated highest as it weighted 4.476, 4.485 and 4.222 respectively. This is followed by flood with a weighted average of 4.261 in Sapele, 4.000 in Oghara and 4.027 in Koko. However findings revealed that across the three towns, level of awareness of cyclone was very low. The standard deviation (SD) for Sapele, Oghara and Koko were 0.582, 0.713 and 0.535 respectively. The high level of awareness of these natural occurrences could be attributed to high volume of rainfall in the area coupled with the fine sandy nature of the soil which is poor in water retention.
Also presented in Table 3 are the HAI of industrial environmental hazards in the study area. The HAIs for industrial environmental hazards in Sapele, Oghara and Koko were 4.747, 4.825 and 4.473 respectively. Impliedly residents’ level of awareness of industrial threats to their environment was higher than awareness of natural occurrence in the environment. Industrial environmental threat that residents were mostly aware of in Sapele and Oghara was oil spillage and they respectively rated 4.878 and 4.926 while in Koko dumping of hazardous waste was the hazard with the highest level of awareness (4.722). However, industrial hazards arising from oil exploration and exploitation activities had high level of awareness in the study area. This could be attributed to the physical experience of residents on the subject matter and the high level of concern environmental hazards associated with these activities has gained from both international and national interest groups. Also, the history of residents of Koko with dumping of toxic waste could be responsible for the high level of awareness of toxic waste in the town.
This section focused on the level of severity of that residents attach to environmental risk in the study area. Presented in Table 4 are results of the level of severity attached to natural environmental risk in the study area. The RSIs for flood in Sapele, Oghara and Koko were 4.117, 4.132 and 4.250 respectively while the RSIs for erosion in Sapele, Oghara and Koko were respectively 4.020, 4.029 and 4.227 respectively. From the computations across the towns, it is evident that floods ranked first, a deviation from the mean residents’ severity index (RSI-RSI) of 0.049 in Sapele, 0.052 in Oghara and 0.012 in Koko. Erosion ranked second with a deviation from the mean residents’ severity index (RSI-RSI) of -0.048 in Sapele, -0.051 in Oghara and -0.011 in Koko. These positive deviations indicate that house heads perceived their experiences with flood with high level of severity. These negative deviations from erosion indicated that respondents perceived their experiences with erosion as low in severity compared to flood. Findings on the level of severity that residents attach to industrial environmental hazards revealed that residents of Sapele attach high severity to smoke from gas flaring as it weighted highest. In Oghara, residents attach high severity to odour from industrial plants while in Koko contact with hazardous waste was rated highest in severity attachment in the study area. The severity residents of Koko attach to contact with hazardous waste could be attributed to either their history or personal experience with hazardous waste. The Coefficients of Variation (CVs) shows that data distribution of Koko was most reliable as 78.6% of the risk severity indexes clustered around the mean risk severity index RSI in Sapele 75.6% clustered around the mean while in Oghara 75.4% of the severity indexes clustered around the RSI.
The section provides analysis of residents’ responses to environmental hazards and risks (Table 5). Responses were examined in relation to natural and industrial environmental hazards in the study area. In Sapele, 29.4% constituted respondents that claimed the oil spillage/pollution of aquatic life had led to agitations/protests, 27.8% of the respondents responded through appeals to concerned bodies, 15.1% claimed it had led to the migration of other residents, 12.0% of the respondents claimed it had culminated into change of occupation while respondents that claimed litigation and vandalism of oil facilities constituted 6.7% and 9.1% respectively. In Oghara, 30.0% of the respondents indicated that oil spillage/pollution of water bodies had led to agitation/protest, 28.3% constituted respondents that had appealed to concerned bodies, 17.9% claimed it had caused migration of other residents, 13.2% claimed it had led to change of occupation, 5.3% of the respondents claimed they had sought litigation and vandalism of oil facilities constituted 5.3% The case was similar in Koko, 23.0% of the respondents claimed oil spillage/pollution of water bodies had led to agitation/protest in their community, 19.5% indicated that it had caused migration of residents and 18.6% indicated appeal to concerned bodies. Other respondents in the town that claimed it had led to change of occupation, vandalism and litigation which constituted 16.8%, 15.0% and 7.1% respectively. The results of the reactions of respondents to odours emanating from industrial activities revealed that in Sapele, Oghara and Koko the odours from industrial activities were agitation/ protest (41.7%, 40.3% and 41.3%) respectively. This is followed by appeals to concerned bodies (31.7%, 34.9% and 31.2%). Respondents from Sapele, Oghara and Koko that claimed odours from industrial plant has led to the migration of people constituted 12.4%, 17.4% and 18.9% respectively. Other reactions by respondents in the study area were litigations and vandalism.
Table 5 about here
The results of respondents’ reactions to smoke/noise from industrial activities in the study area are also presented in Table 5. The presence of smoke in the area could make residents susceptible to develop lungs and skin ailments and may reduce visibility thus causing vehicular accidents in the area. Also in situations whereby these smoky compounds react with other gases in the atmosphere they can condense and fall as acid rain in the area thus exposing respondent to skin cancer, make their properties prone to quick corrosion and could be toxic to flora and fauna . The noise could cause headaches and other form of nuisances in the study area. In Sapele, Oghara and Koko the major reactions of respondents to smoke/noise from industrial activities were agitations/protest 38.2%, 42.6% and 37.9% and appeal to concerned bodies 34.1%, 39.2% and 28.7% respectively. In general 39.5% of the respondents indicated agitation/protest as reactions to smoke/noise while 34.8% of the respondents claimed they had appealed to concerned bodies to act on disturbance from smoke from industries in the study area. Other reactions include migration 10.5%, litigation 10.3% and vandalism 4.9%. The results of respondents’ responses to event of fire outbreak from industrial activities revealed that in Sapele, Oghara and Koko 35.7%, 45.5% and 33.4% of the respondents respectively claimed fire outbreak had led to agitation and protest on their towns while 31.0%, 33.3% and 27.9% of the respondents in Sapele, Oghara and Koko claimed they had appealed to concerned bodies because of fire tragedies. Other reactions that fire outbreak had generated in the study area include intra-urban migration of residents and litigation. On reactions of respondents to contact with hazardous/toxic waste emanating from industrial activities, 40.0% of respondents from Sapele claimed that contact with hazardous waste had led to agitations/protests in their area, 27.5% had appealed to concerned bodies, 22.5% claimed it had led to the migration of other residents while 10.0% claimed it had resulted into litigation. In Oghara, 38.5% indicated that contact with hazardous waste had led to agitation/protest in the town, 34.6% had appealed to concerned bodies, and 23.1% claimed it had caused migration, while 3.8% of the respondents claimed contact with hazardous waste had caused litigation in the study area. In Koko, 30.0% of the respondents claimed that contact with hazardous waste had led to litigation, the proportion of respondents that had appeal to concerned bodies on contact with hazardous waste constituted 30.0%, 27.0% of the respondents claimed that it had led to agitation/protest while the remaining 13.0% claimed it had caused migration of residents in the study.
Residents’ response to natural environmental hazards and risks were likewise contained in Table 5. Findings of respondents’ reactions to flood/erosion in the study area revealed that the principal reaction in Sapele, Oghara and Koko were do nothing approach (37.0%, 43.8% and 40.5%) respectively. This is followed by appeals to concerned bodies (30.6%, 26.7% and 33.3%). Other prominent response of respondents to flood/erosion in Sapele, Oghara and Koko was construction of drains in their neighbourhood which respectively constituted 25.6%, 22.7% and 17.9% other reaction by respondents in the study area was construction of embankments.
This study assessed residents’ perception of natural and industrial environmental hazards and risks in terms of level of awareness of hazards and severity attached to the hazards (risks) in three coastal towns of Delta State, Nigeria. Based on the findings from the study, it is concluded that residents were more aware of hazards and risks emanating from industrial activities than those emanating from natural events. There were variations in level of awareness of the two categories of environmental hazards across the three towns, however, the contributions of government agencies and non-governmental organizations in creating awareness about environmental hazards and risks were little. On severity, residents attached more severity to risks emanating from industrial environmental compared to natural environmental hazards. Residents’ high level of severity could be attributed to their experience of health threats emanating from these industrial activities. The most predominant response to all type of technological hazards across the towns was agitation/protest followed by appeal to concerned bodies. These damaging effects of industrial activities on the environment could be responsible for the short lived peace of the area. On natural hazards, the predominant response of residents is to do nothing during natural events.
Based on these findings the study recommended that government and all concerned agencies to synergize efforts to dissemination of information on how to handle threats posed by environmental hazards and risks in the study area. A variety of media such as the local radio and television stations, the internet, newspapers, pamphlets and posters and exhibitions can be used to disseminate this information. Also environmental hazards and risks campaign should be introduced to all categories of people in the study area. Also, strategies such as adherence to town planning laws, construction of embankments and drainages should be also be put in place to combat the events of natural hazards such as flood and erosion.
Furthermore, since the presence of environmental hazards, risks and vulnerable population leads to disaster which are intrinsically linked to other sustainable development issues such as poverty, hunger, health, education, ecosystems integrity, climate change and national sustainability appropriate measures involving all relevant stakeholders should be formulated to aid hazards and risks management [44,45].
The government should show more political will to address environmental problems remains in the study area. This includes promulgation and enforcement laws guiding the activities of industrialist in the study area. This entails strict measures to control of harmful substances generated by these industries. Added to this is the payment of compensation by the multinationals in these areas to the residents for destruction of their environment. Also, the government should empower and review the scope of the existing agencies related to hazards and risks management in the area. Furthermore, emergency management agencies should be located at various parts of the towns in order to gather information and aid proper coordination during disaster events [46,47].