
Selection of Elite Rice Varieties from BCF3:4 Population from OM10252/Pokkali//OM10252 for Salinity Tolerance in Rice
Selection of elite rice varieties was on backcross method as well as on the basis of quantitative genetics and interaction of rice varieties evaluated through genetic index in breeding at HATRI. The analysis of hybrid generations of each BCF2, BCF3:4 populations have gained new knowledge and horizons in the number of genes controlling agronomically important traits such as yield and insect disease. A population was developed from a cross between OM10252 (high yielding variety and short duration from Cuu Long Delta Rice Research Institute (CLRRI) as female parent and Pokkali as male parent (a donor in many breeding programs and salinity tolerance related studies from Indian). Introgression from Pokkali variety into the hybrid population was recorded with 12,90% recognition for salinity tolerant gene at the survival level of rice plant in salt concentration of EC=8DS/ m and 4,30% of survival rice plant at the concentration of EC=15 dS/m. Analysis of 100 individuals from the BCF3:4 population of OM10252/Pokkali//OM10252 cross, the height trait, root length, dry weight of stem, dried weight of roots had the positive and high correlation with the survival time of rice plants at EC = 0,8 and 15 dS/m. This demonstrates the expression of traits affecting closely when analyzing the BCF3:4 population tolerance varieties with various salt concentrations. Through generation, the salt tolerant lines will continue to grow to be evaluated in the field evaluated vegetative and growth stages, and be taken some lines such as: BC3F4-17, BC3F4-18, into breeding programs [1].
Keywords: Introgression; Breeding Programs; Salt Concentrations
Find keys: Backcross Method Evaluated Vegetative and Growth Stages
Rice (Oryza sativa) is sensitive to salinity, which affects one fifth of irrigated land worldwide. Breeding for salt tolerance has been reviewed by several workers. Progress in salinity tolerance breeding is slow due to the following: limited knowledge in the genetics of tolerance, complexity of the several tolerance mechanisms involved, inadequate screening techniques, low selection efficiency and poor understanding of salinity and environmental interactions. Through recent developments in molecular marker analysis, it is now feasible to analyze both the simply inherited as well as quantitative traits, and then identify individual genes controlling the trait of interest [2]. Several studies indicated that rice is tolerant during germination, become very sensitive during early seedling stage and the difference score salt tolerance between vegetative and productivity stage in the case 19.4% at and 13% the plants survival at reproductive stage from Doc Phung [3]. Tolerance to salinity is desirable at both the vegetative and reproductive stage, and tolerance at the two stages does not seem to be correlated. At the vegetative stage, large differences have been observed in tolerance levels. A major QTL named Saltol controlling 64–80% of the phenotypic variability from the tolerant cultivar Pokkali was identified on chromosome 1 [4], and the QTL seems to be present in other varieties [5,6]. Lang, et al. reported that salt tolerant genes tagging based on SSR markers with advanced backcross populations (BC2F2) of IR64/ Cheng Hui 448, IR64/ OM1706 and IR64/ FR13A derived alleles nearly located at on chromosome 1 while in the population of IR68552-55-3-2/ OM1706, the alleles are linked with RM223 on chromosome 8 [7].
The major gene for salinity tolerance (Saltol) was mapped on chromosome 1 and chromosome 8 [3,8]. RM223 linked to salt tolerance gene at the distance of 6.3 cM on chromosome 8 at vegetative stage under EC = 10 dS.m-1 from F3 population of IR28/ Doc Phung [8].
Bonilla, et al. mapped Saltol locus linked to major QTLs for Na+ and K+ uptake and Na+/ K+ ratio on chromosome 1 explaining 64.3% phenotypic variance [4].The plants were then harvested after 45 days to assess various parameters:
Ammar, et al. reported 25 QTLs for salt ion concentrations (Na+, K+ and Cl− measured in the leaf tissues at the reproductive stage) on rice chromosomes 1, 2, 3 and 8 [9]. This selective and screening some lines from of tolerance at the seedling stage are still underway. The current focus on screening selected salt tolerance should result in identification of an increasing number of gene salt tolerances in rice. Takahashi (1974) reported that new improved indica and japonica varieties had similar germination trends under 1.5% NaCl but no germination at 2.5% NaCl; the traditional indica varieties had higher germination percentage than improved varieties.
Early seedling stage (from 3-15 days): Rice plants were more sensitive during the early seedling stages than at later stages [10]. Significant decrease in growth parameter such as dry matter, seedling height, root length and emergence of new roots was observed at an electrical conductivity value of 5-6 dSm-1 (Hennan et al 1998). Salt stress at early seedling stage shows severe reduction in effective leaf areas as the first symptom. In low stress condition, the dry weight of some cultivars often increases for some time and then decreases due to reduced leaf area. At higher stress, dry weight of shoot and root decrease almost proportionally. The objective of this study is to investigate the effect of salinity stress at seedling and reproductive stages in development of salinity and tolerance. This study is also needed further selection and identification of salinity tolerant varieties, good shape and high yield which need attention.
The population 100 plants of BC3F3 were developed from OM10252/Pokkali//OM10252 of Lang, et al. [3]. Each plant harvested a panicle and selected two seeds for BC3F4 generation.
Experiments of screening salt in nutrient solution [11].
On each spongy tray we drill the holes with diameter 1cm, length 10-hole and width 10-hole. Below was covered by nylon mesh (to keep the grain). The meshes were glued carefully with spongy tray by bandage.
Preparing plastic tray has a capacity of about 3-5 liters of water with a diameter of 40 × 50 × 4cm to put into spongy tray.
Preparing correctly solution components is extremely important to avoid a lack of nutrients and forming minerals toxins affected the salinity of salt. The solutions can be stored for 3 months at room temperature and if we want to use long term, we storage at 4 °C. Saline solution was created by adding NaCl to the nutrient solution and adjusting desired electrical conductivity EC (0, 8 and 15 dS/m), nutrient solution culture needed for each tray is 3-5 liters following (Lang) [7].
Experiments of screening salt in nutrient solution Yoshida (by method IRRI) [12].
Designing spongy tray to keep the grains floating on the water:
Spongy tray rectangle with size of 30 × 30 × 2cm.
Tray we drill the holes with diameter 1 cm, length 10-hole and width 10-hole.
Below was covered by nylon mesh (to keep the grain). The meshes were glued carefully with spongy tray by bandage.
Preparing plastic tray has a capacity of about 3-5 liters of water with a diameter of 40 × 50 × 4cm to put into spongy tray.
Checking and adjusting the pH medium is very important. If the pH of the nutrient medium skewed significantly compared to 5 would make the medium become toxic and deficiency of other components. So should have a pH meter and pH adjusted regularly is essential Lang NT, et al. Due to supplement ammonium and nitrate as nitrogen source therefore pH reduced in a few early days because ammonium ions associated with nitrate ions. Then the pH would be an increase when the ammonium ion was off and excess nitrate ion was absorbed by plant. So we have to change the nutrient solution 7 days 1 times. During the experiment, there were the water evaporates made liquid volume in the tray deficiency therefore add distilled water 3 days 1 times.
Seeds had treated in an oven for 5 days at 40 °C to break seed dormancy. This is a very important step in screening techniques.
After breaking dormancy of seeds, seed has surface sterilized with fungicide and rinsed with distilled water. Soaking seeds in petri dishes lined with moist paper and incubated at 30 °C, about 48 hours for seed germination.
Sowing two seeds germinated in each hole of the foam float. The roots were put into nylon mesh. During this process the roots would be hurt but we can not see.
In 3-4 days early the nutrients in endosperm of seed enough for normal plant development. After 3 days, when the plants have adapted, add distilled water and nutrient medium, at the same time for NaCl in the experiment tray to achieve EC = 8 dS/ m and EC = 15 dS/ m.
The confirmed extremes, 13 lines tolerant, were tested to determine the Na and K concentration and Na-K ratio in the shoot. (Low Na-K ratio in the shoot is tolerance and height Na-K ratio is susceptible. The mechanism for salinity tolerance in rice is the ability to absorb less of the toxic Na+ and take up more K+ to maintain a good Na-K balance in the shoot.
Field trials: Two experiments with three replications each were conducted at the experimental station at Mekong delta. In the first experiment, 15 varieties were established to test submergence tolerance within the cropping system of three crops per year. The seeds were planted using with 20 × 20cm spacing. The fertiliser application included 100 kg of N/ ha, 40kg k2O per hectare and 60 kg of P2O5 per hectare. Weed control was done by applying a post-emergence herbicide.
Trait evaluations: Each experiment was evaluated for eight agronomic traits, including days to heading, plant height, panicle length, and number of panicles per plant, percent sterility, grains per plant, 1000-grain weight and yield per plant. Evaluation was as follows:
Days to heading was evaluated as the average number of days from seeding until 10% of the panicles had headed.
Plant height was measured as the average height of the ten plants in cm from the soil surface to the tip of the tallest panicle (awns excluded).
Panicle length was measured as the average number of cm from the panicle neck to the panicle tip (excluding the awns) based on an evaluation of all panicles from the ten plants.
Number of panicles per plant was calculated as the average number of panicles on the ten plants (panicles having less than five seeds were not counted).
Percent sterility was the number of empty spikelets divided by the total number of spikelets per panicle evaluated for each panicle on all ten plants.
Number of grains per plant was measured as the average number of filled spikelets per plant calculated for ten plants.
1000-grain weight was the average weight of 1000 filled spikelets, measured in grams, averaged over three samples taken from bulk harvested grain from the ten plants.
Yield per plant was the average weight per plant, measured in grams of bulked harvested grain from the 5 m2/ plot.
Salty is a factor multi-gene, was greatly influenced by environmental conditions, so the salt gene screening analysis must combine evaluation of phenotype and genotype.
Using two backcross hybrid populations and OM10252/Pokkali//OM10252 with 93 lines to evaluate tolerance to disadvantageous conditions (salt).
Distribution of experiment with completely random type with 3 replications.
The phenotype is the result of influence between genotype and environment. Therefore, it is very important how to accurately measure phenotypes. It used a population which allows phenotype repeated, this is benefit to increase the accuracy of measurement, particularly for traits susceptibility to environmental change. Any case, the analysis of the phenotype is the largest investment)
The number of survival day.
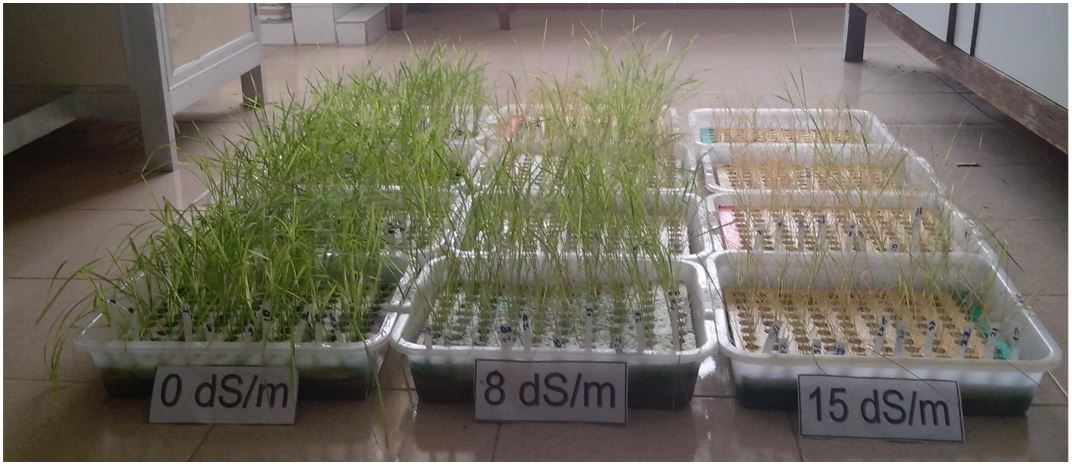
Rice dry fire 70% upwards is considered dead. The number of survival days of a variety was calculated as average number of days survival of the individual rice in three replications. Through salt screening at 3 environments EC=0, 8 and 15 dS/ m, the results noted as the following:
Analysis of the survival day of varieties after salt screening with concentrations EC= 8dS/ m and 15dS/ m showed that survival day of different varieties have highly significant difference. The variance between 3 replications was significant in the environment 8dS/ m of 2.77 and the EC=15dS/ m of 3.81.
Through the results the first round of screening was 84 rice lines with a clearly difference in survival time in the EC=8 dS/ m and 15 dS/ m. The highest survival in the EC=8 dS/ m was 28.7 days and in the EC=15 dS/ m was 27.7 days. Lowest survival in the EC=8dS/ m was 22 days and in the EC=15 dS/ m was 21 days.
Overall, the varieties were survival in the environment 0 dS/ m more than at 8 dS/ m, and at 15 dS/ m most of the varieties died through 30 days salt screening in nutrient medium.
In environment 0 dS/ m all varieties survived through 30 days of screening. And the EC=8 dS/ m and 15dS/ m were a difference in survival time.
Environment 8dS/ m survival time was 21-23 days with 13 lines, 23-25 days with 7 lines, 25-27 days with 29 lines, 27-29 days with 35 lines.
Environment 15dS/ m survival time from 21-23 days with 34 lines, 23-25 days with 28 lines, 25-27 days with 20 lines, 27-29 days with 2 lines.
Overall, the varieties were survival in the EC=0 dS/m more than at EC=8 dS/m, and at EC=15 dS/m most of the varieties died through 30 days salt screening in nutrient medium.
A salty environment affects rice growth and development. Individual plants affected by salinity stress expressed yellow leaves, stem and roots were less developed than usual, and more severe infection could make the rice plant sick, even dry fire and died. The average mean score ranged from 1 (tolerant) to 9 highly susceptible Figure 1 and 2. Under EC conditions, the level showed a significant variation at EC=8 dS/m of NaCl. Most of the lines through 30 days of screening in salt environment expressed dried leaf levels in a level of 7 to 9 (45 lines). There were 35 lines with a level of 5 to 7, 14 lines a level of 3 to 5 and one line a level of 1 to 3. While at EC=15 dS/ m, more lines were susceptible compared with the 8 dS/m. Twenty-three lines had levels of 5 to 7 and 5 lines had a level of 3 to 5, no lines with expression of resistance (level 1-3).
The salt injury level at EC= 8 dS/m and 15 dS/m showed identical responses for the lines, indicating that 14 lines and 5 lines are moderate salt tolerance (level 3-5), while other varieties were classified as susceptible.
In salt EC=8 dS/m, through 30 days of screening have a lot of dried fire rice, green part of the plant only remaining <30%, even a lot varieties died 100%. Most of the lines in this environment are expressed very high levels of dried leaves with 31 lines with expression of dried leaves from level 7 to level 9, 41 lines with level of dry leaves at level 5 to level 7. 14 lines from level 5 to level 3 and had no any lines of expression of dry leaves in level 1 to 3.
In salt EC=15 dS/m, the lines dry fire and died a lot, compared with EC=8 dS/m, only a few lines survival, but they also were fired leaves. Most of the lines in this environment were expressed very high levels of dry leaves, level 7 to level 9 with 78 lines, at level of the dry leaves from level 5 to level 7 with 7 lines.
The number of survival day.
Through it the lines better salinity tolerance is recommended as lines of BC3F4-17, BC3F4-18, BC3F4-23, BC3F4-28, BC3F4-40, BC3F4-46, BC3F4-53, BC3F4-54, BC3F4-56, BC3F4-60, BC3F4-68, BC3F4-80, and BC3F4-81.
Analysis of plant height of lines after salt screening in environments EC= 0dS/m, 8dS/m, 15dS/m with a clearly difference in the concentrations, expressed difference with statistically significant at 99% (**).
At the higher salt concentrations, the more plant height decreased, at salt concentrations 15 dS/m most of the lines with height decreased compared with concentrations EC=8 dS/m and at concentrations EC=8 dS/m most of the lines with plant height were a decrease compared with concentrations 0 dS/m.
In EC= 0 dS/m, plant height was majority concentrated in the range of 14-16 cm, whereas at EC=8 dS/m was in the range of 12-14cm, at EC=15 dS/m was 8-12 cm. This suggests salt conditions will limit the growth and development of rice. To adapt to salt conditions, rice plants resistant to stress, the growth will be very fast to break out stage sensitive to salt, gradually adapting to harsh environments. As the saline lines will grow slowly, gradually dry fire and death Figure 3.
Salinity tolerance score, Na and K concentrations and Na-K ratio of shoot of the population from OM10252/Pokkali//OM10252at concentrations EC= EC= 8dS/m.
Through analyzing Na, K of shoot of plant at concentrations EC= EC= 8dS/m showed that differences with a statistically significant at 99% (**), Continue to evaluate varieties for good tolerance results in the seedling stage, flowering stage, and maturity. Evaluate whether some ions such as Na, K, affect the population with 13 lines and parents checked at EC= 8DS/ m.
13 extreme line with salinity score of 1 and 3 (Pokkali type) and 9 (OM10252 type) were selected (Table 1). The Na and K concentrations and Na-K ratio in the shoot of these selected extremes are presented in Table 1. Salinity tolerance in rice was associated with Na exclusion and increased absorption of K to maintain a good Na-K balance in the shoot under saline condition. These Na and K concentration and Na-K ratio data were in agreement with scoring based on visual symptoms (Table 1).
Conduct revaluated of yield and yield components in normal condition of the line recorded compare with parents do control.
After screening 100 lines only 13 lines good for salinity and continued conduct revaluated of yield and yield components in normal condition of the line recorded compare with parents do control.
Performance stability is one of the most important properties of a genotype to be released as a variety to ensure wide adoption. To ensure this, we tested 13 lines BCF3:4 populations from OM10252/Pokkali//OM10252 at 6 different locations during the wet seasons of 2018, using a randomized block design with three replications in each case. With salinity control 3-4% duration, grain yields (t ha-1) were presented in Table 2. The experiment was conducted in 6 provinces, long An, BacLieu, Soc Trang, Ben Tre, Kien Giang, Hau Giang.
To assert the BC generation have brought salinity were used 100 lines at screening phase. Only 13 lines good for salinity. To find the target breeding tolerant to salinity and short-term high yield. The rice varieties are grown and observed growth period of rice varieties. In the rice varieties single cross the generations evaluation recorded the varieties had rate of segregation reselected and remained 13 lines from BCF3:4 populations OM10252/Pokkali//OM10252. The lines multiplied to assess the yield and yield component of the varieties. For 13 lines recorded the yield and the yield component (Table 3). Grain yield in rice is a complex trait multiplicatively determined by its three component traits: number of panicles, number of grains per panicle, and grain weight and good during condition normal, Table 3 yield and yield component of the varieties recorded 13 lines. Through evaluation results of yield and yield component recorded only 3 lines had high yield were line number BC3F4-17, BC3F4-18 and BC3F4-53 and had time of short day less than 100 days. The number of grains per panicle is usually highly proportional to the spikelet number. To understand the making of the number of grains per panicle, it is essential to understand the basic biological processes of panicle development, as well as the differentiation of meristems into spikelet at salinity in rice. From an agronomic perspective, the number of spikelet per panicle can be attributed to two components: the duration of panicle differentiation and the rate of spikelet differentiation [13]. This result gives one line BC3F4-17, BC3F4- 18 and BC3F4-53 good for height yield. These lines also give good survey during 3% salinity condition. A final comment is that both field management and improved cultural practices are also extremely important for salinity in rice.
Through phenotypic evaluation of populations OM10252/Pokkali//OM10252 about the level of response tolerant to salinity with three different salt concentrations EC = 0 dS/m, 8 dS/m, 15 dS/m can be divided into three different groups: Group of salt tolerant lines, slight susceptible lines and susceptible lines. The ability to respond to salty of rice lines with a greatly difference. However, judging about the growth of lines showed: the higher salt concentrations, the lower survival day, percent of plant height decrease, the more increase of root length, the more decrease of dry weight of stems and roots. These criteria are also closely correlated with each other. This suggests that salinity conditions greatly affect the survival, growth and development of rice. Lines of good salinity tolerance in populations OM10252/Pokkali//OM10252 include: lines BC3F4-17, BC3F4-18. These lines need confirm with genotype with ability to good tolerance to saline conditions at the fields [14].
The authors are grateful to Ministry of Science and Technology, Vietnam (Tay Nam Bo program) and Cuulong University for funding this research on rice. Appreciation is expressed for the HATRI provided for the project, and to our colleagues in Genetics and Plant Breeding Division (HATRI) for their support and valuable suggestions.

.JPG)
.JPG)