Sepsis and Tachycardia: Etiologic Factors and Effects on Prognosis
Background: Patients with sepsis predispose cardiac arrhythmias because of excessive inflammation and circulating stress hormones. The present study aimed to identify etiologic factors of tachycardia in critically ill patients with sepsis. We also investigated effects of tachycardia on prognosis.
Methods: A prospective observational study was conducted in adult patients who were diagnosed with sepsis and followed over than 48 hours in intensive care unit. Demographic data, comorbid diseases, and clinical and laboratory data were collected prospectively. Patients were followed up until death or hospital discharge. Early goal-directed therapy used to achieve hemodynamic optimization.
Results: We observed tachycardia in all patients during follow up. The time of heart rate greater than 100 bpm was 34.6±39.7 (%95 CI 23.3-45.9). There was correlation between tachycardia and pH, mean arterial pressure (MAP), base excess, temperature, and procalcitonin level (p<0.05). When these factors were analyzed with linear regression, it was found that MAP, temperature, and procalcitonin levels were associated with increased heart rate (p<0.05).
Conclusion: We identified that low mean arterial pressure, high body temperature and high procalcitonin levels were important factors in tachycardia etiology. According to our findings, there may be also a relationship between inflammation and tachycardia. This study also showed that duration of tachycardia may be related with mortality.
Keywords: Tachycardia; Sepsis; Shock; Prognosis
Despite advances in medical science, especially researches have focused on early detection and treatment of sepsis, it is still a serious medical condition triggered by infection, characterized by uncontrollable systemic inflammatory response that frequently leading to mortality and morbidity in intensive care unit (ICU) [1,2].
Patients with sepsis predispose cardiac arrhythmias because of excessive inflammation and circulating stress hormones [2,3]. Surviving Sepsis Campaign advices using early goal directed resuscitation goals to guide their treatment and has clear recommendations except tachycardia [4].
Association between tachycardia and sepsis is independent from other predictors of fatality [5]. The management of tachycardia and converting to sinus rhythm have advantages in patients with sepsis [6]. Severe infection induces sympathetic nervous system, leading supraventricular tachyarrhythmias [6]. In some cases it is observed that tachycardia continues despite adequate volume resuscitation [7]. The present study aimed to identify etiologic factors of tachycardia in sepsis patients in intensive care unit. We also investigated effects of tachycardia on prognosis.
We aimed to determine the causes of tachycardia despite adequate volume replacement in patients followed-up with sepsis diagnosis in intensive care unit. We also planned to investigate the relationship between tachycardia and intensive care unit, length of stay in hospital and mortality.
This study is a single center; prospective-observational study and it was approved by the ethical committee Institute of Health Sciences of the Marmara University and was registered under issue number 29.04.2015-8. Informed consent was obtained from all patients’ relatives.
Medical reports of patients with sepsis were observed and recorded by a single intensivist a tertiary academic medical center from July 2015 to December 2015. Patients were included in this study if they met the following criteria: 1) systemic inflammatory response syndrome score ≥ 2 with clinically suspected infection; 2) ≥ 18 years of age; 3) supraventricular tachycardias with heart rate ≥ 100 b-pm for 1 hour; 4) no history of chronic supraventricular tachyarrhythmias; and 5) tachycardia continued within 6 hours after diagnosis 6) 48 hours passed after intensive care unit admission.
For patients with multiple admissions, only the first data set was included in the data analysis.
Exclusion criterias were pregnancy, severe valvular diseases and coronary artery disease, extracorporeal membrane oxygenation usage and patients who do not need mechanical ventilatory support. We excluded HIV-positive patients with a current (suspected or -identified) opportunistic disease and/or AIDS- defining illness currently or within the past 6 months; solid-organ or bone-marrow transplant recipients; children <18 years; suspected travel infections or tuberculosis.
Baseline variables such as laboratory findings, vital signs and severity of disease; Acute Physiology and Chronic Health Evaluation (APACHE) IV and Sequential Organ Failure Assessment (SOFA), were assessed at the 6th hour after sepsis diagnosis (after early goal directed treatment has been applied). It was also recorded such as gender, age, demographic data, comorbidities, and the final outcome. Hemodynamic support, antibiotic treatment and adjunctive therapy was initiated and continued according to recommendations from early goal directed resuscitation research and Surviving Sepsis Campaign advices.
By using a software package (G-Power© 3.0.10 PC; by Fraz Faul, Universtat Kiel, Kiel, Germany), with a correlation coefficient of 0.4 or greater between the causes of tachycardia and heart rate, a power of 90% and type 1 error of 5%, we calculated that 50 subjects would be required. Statistical analysis was performed using Statistical Package for Social Sciences for Windows version 21.0 (SPSS Inc., Chicago, IL, USA). Continuous variables are presented as mean ± standard deviation (SD). The Kolmogorov-Smirnov test was used to assess the data normality. Patient characteristics and hemodynamics were compared using an independent t test for continuous variables and with either Fisher’s exact test or a chi-square test for categorical variables. Other data were analyzed by repeated-measures analysis of variance. To test linear correlations between etiological factors of tachycardia and heart rate and other correlations, we used Spearman’s method. To show independent predictors of the increased heart rate, we used a stepwise linear regression analysis. Data were presented as mean ± standard deviation (SD). Statistical significance was set at a P value < 0.05.
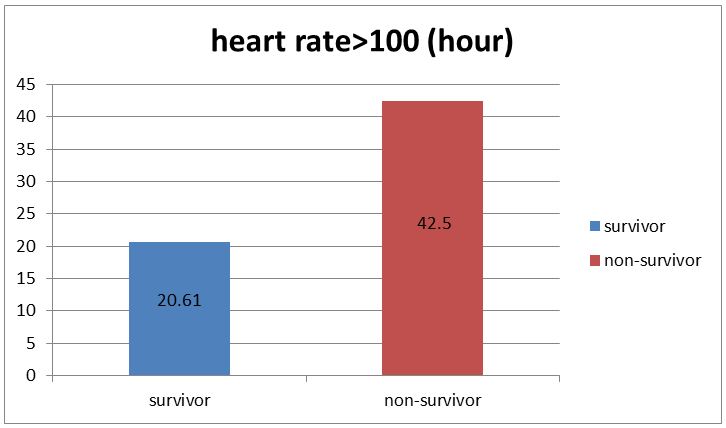
In this study, all patients with sepsis who met the inclusion criterias of the study, was observed at the intensive care unit between June 2015 and December 2015. Sixty-three patients with sepsis suffered from tachycardia. Among 63 patients, 13 patients excluded because they had not got tachycardia at the 6th hour of the diagnosis. 30 were male (60%), and the mean age was 58.0±17.86 (95% confidence interval [CI]:52.92-63.07). During follow up period, there were 18 (36%) patients who had survived and 32 (64%) patients who had died. Patient characteristics and baseline hemodynamics are summarized in Table 1. Substantial reduction of heart rate was observed in the survivor group (Figure 1, P < 0.05).
A statistically significant correlation was established between heart rate and mean arterial pressure (MAP), pH, base excess, body temperature and procalcitonin values (Table 2). Linear regression analysis showed that MAP, body temperature and procalcitonin level are independent risk factors for increased heart rate (Table 3).
Our major findings are as follows: 1) there was a connection between continuing (ongoing) tachycardia and MAP, pH, base excess, body temperature and procalcitonin values. 2) We determine MAP, body temperature and procalcitonin values as independent risk factor for increased heart rate. 3) Duration of tachycardia was longer in non-survivor group.
Houwink, et al. showed MAP and ICU mortality has independently related to ICU and hospital mortality [4]. In this study we observed that MAP plays a role in the etiology of tachycardia. Hypotension in patients with sepsis results sympathetic nervous system activation and increase in heart rate [8].
Development of tachycardia with hypotension and the increase in cardiac output are considered to be normal response to serious infection [9].
In sepsis patients, who was under a defined MAP threshold caused disrupted autoregulation in critical vascular beds, and perfusion becomes completely dependent on the pressure [10]. “Survival Sepsis Campaign” suggests that MAP should be kept at >65mmHg in septic patients [10]. However, this is not the recommendation for every patient but this recommendation is affected by comorbid diseases of the patient [10].
Parker, et al. showed that, patients, who admitted ICU and a heart rate <106 beat / min within the first 24 hours had a better prognosis [11].
It has been known since the very beginning that fever has increased heart rate. However, contradictory reports have been reported the effect of fever on intensive care patients’ mortality [12]. Although the heart rate of patients with fever is higher, our findings indicate that fever alone does not constitute a risk factor for mortality.
In a retrospective study in children it has been shown that every 1oC increase in body temperature may result in an increase in heart rate of about 10 beats / min. Furthermore, the fact that the tachycardia is higher than a certain point according to the body temperature is also important in terms of suggesting that the patients may be in a septic shock [13].
Separately, it has been reported that fever may cause more physiological stress in patients with fever. It has been reported that the effective methods used to lower the fever of patients did not make a meaningful difference in survival [14,15].
Leibovici, et al., observed increased mortality when heart rate was above a certain rate relative to body temperature. They also emphasized that this ratio is an independent risk factor for mortality. However, this ratio did not make any changes in septic shock patients [5].
Procalcitonin has been reported to be measurable in serum shortly after the onset of bacterial infection [16]. It is stated that the sensitivity and specificity of procalcitonin are higher than many other mediators in defining the severe sepsis [17]. Tachycardia is a result of endogenous mediators induced by inflammation like sepsis [18].
Especially procalcitonin is said to play a very important role in the identification of bacterial infections. It has been reported that the low value of procalcitonin may be associated with lower heart rate in culture-negative patients [19].
There is no clear research that explains the association between procalcitonin value and tachycardia. In this study, we observed a causational relationship between the values of procalcitonin and tachycardia. This reinforces the view that inflammation or inflammatory mediators may also play an important role in the etiology of tachycardia.
There were not many studies investigating the relationship between pH, base excess and heart rate [20].
Many studies have shown that severe metabolic acidosis worsens the cardiovascular system by increasing myocardial dysfunction and reducing vasopressor response [21]. Jazrawi, et al. showed that, metabolic alkalosis was associated with decreased mortality [22].
Changes in electrolyte and pH can cause important changes in the cardiovascular system. Acid-base impairment and changes in pH also affect myocardial contractility [23]. Severi, et al., also reported similar relationship between pH and heart rate found in our study [23]. Changes in electrolyte and pH can cause important changes in the cardiovascular system [23]. Factors affecting pH in our study (SID, Atot, PaCO2) were also evaluated separately, and these factors were not independently associated with tachycardia. That is, the high incidence of tachycardia is directly dependent on the pH, regardless of the factors that lower the pH.
There was not statistically significant difference between tachycardia and discharge from intensive care unit and discharge from hospital.
We could not determine the incidence of tachycardia or mortality with inotropic or vasopressor agents used in this study. Since this is not our primary goal, the design of our work was not suitable for determining this relationship. There is a need for randomized control large sample sized studies to investigate this topic.
Our study had some potential limitations. First, our small sample size is a limiting factor. When the sample size was calculated, calculations were made on the number of cases required to determine the relationship between heart rate and the factors that might cause tachycardia. However, variables such as the effect of tachycardia on mortality, the effect of inotrope and vasoactive drugs on heart rate were investigated and sample size of this research may be insufficient. More mediator studies may be needed to evaluate hemodynamic response in different phases of inflammation (proinflammatory and anti-inflammatory). In addition, more valuable information could be obtained if the intravascular volumes and cardiac output of the patients could be monitored by further monitoring tools.
Also, being a single center study, there is a possibility of bias due to ICU admission policies. The incidence of tachycardia is very high in cases followed up with sepsis in intensive care unit. According to our findings, low mean arterial pressure, high body temperature and high procalcitonin values were independent factors in tachycardia etiology. The relationship between heart rate and arterial blood pressure and body temperature is already well known. But this study showed that there may be also a relationship between inflammation and tachycardia. Also there was no statistically significant relationship between tachycardia and intensive care unit and hospital stay. New studies are needed to investigate changes in heart rate during different periods of inflammation (proinflammatory-anti-inflammatory). This study also showed that duration of tachycardia may be related with mortality.
BO and KA were involved in final approval of the version to be published. BO and KA provide references. All authors read and approved the final manuscript.
The authors declare that they have no competing interests
Ethical committee Institute of Health Sciences of the Marmara University and was registered under issue number 29.04.2015-8.
On behalf of all authors, the corresponding author states that there is no funding for this research.