Sexual Dimorphism and Bilateral Asymmetric Variability in Percutaneous Foot Anthropometry of Adolescent Nigerian Schoolchildren in Lagos, Southwest Nigeria
Background: Percutaneous anthropometry of body dimensions is increasingly being adopted in forensic anthropology, child and adolescent growth and nutritional assessment, ergonomics, garment and other related studies. The scientific literature on the normal adolescent foot anthropometry in West Africa is sparse. This study assessed anthropometric variability in selected foot dimensions of adolescent Nigerian school children in Lagos, South-West Nigeria.
Materials and Methods: 523 volunteer Nigerian adolescent school children (260 males and 263 females) aged 10-17 years randomly recruited from the Nigeria Air Force Secondary School, Ikeja, Lagos State assessed for length and width of both feet according to the protocols recommended by the International Society for the Advancement of Kinanthropometry (ISAK). Statistical analysis was carried out with the SPSS (version 25.0) and Microsoft Excel statistical packages while the data was presented as tables and charts of descriptive (mean ± s.d) and inferential statistics (t-test, p-values), with a significance level of p<0.05 fixed. Male foot lengths and breadth were significantly larger than females, but the patterns of timing and symmetry in both sexes varied significantly in all age-matched and sex-pooled samples.
Conclusion: The patterns of variability and sexual dimorphism suggests the need for an own database for anthropometric foot dimensions among Nigerian adolescent schoolchildren in Lagos. These findings may be useful baseline for further investigation relevance to clinical medicine, forensics, the workplace and shoe design.
Keywords: Foot anthropometry, sexual dimorphism, bilateral asymmetry, adolescents, Nigerian
The patterns of sexual dimorphism and bilateral asymmetry in foot morphology and anthropometry in adult Nigerians have been highlighted and elaborated in [1-3] also reviewed current metric approaches to predictive regression in their report on the pattern of variation in foot anthropometry and their correlation with stature in young adult Nigerians while [4] attempted to predict sex from foot anthropometry using the discriminant function analysis model in Nigerian adults. However, available data on foot anthropometry in Nigerian sub-adults (children and adolescents) is sparse. Furthermore, extrapolating measurements based on data derived from adult studies is generally considered inappropriate given that fundamental differences exist within the theoretical and conceptual framework for research among adolescents [5], hence the current study.
While oldest studies on the growing foot and lower limb considered the diversity in the morphological and evolutionary patterns of development as well as their clinical implications [6-7], more recent studies on foot anthropometry have enabled clearer under- standing of the prevalence of age-old clinical disorders such as the flat-foot [8-10] and the arched-foot [11-13] and other forms of foot postural disorders [14]
The garment industry, through its drive for better understanding of shoe-fitting and sizing accounts for a significant portion of research documentation [15-17], while a growing interest in the correlation of foot dimensions with athletic performance has increased demand for original data from many regions [18-22]. Increased demand for local or regional foot anthropometric data also arises from their wider applications for sexual dimorphism and stature determination of personal identification of individuals in forensic anthropology.
In a review of scholarly research from across the globe, [3] observed that in adults, foot length and breadth measurement predicted stature in a rather robust manner. Foot length performed consistently better than foot breadth in this regard, an observation than was corroborated by previous work by [23]and contemporary work by [24] in Indians.
In Nigeria, anthropometric studies in childhood and adolescence generally focus on basic growth and nutritional status assessment [25-28] as well as adolescent sexual development especially during puberty [29-31]. Some studies relate to economic planning and health policy management [32-33] while a few more have evaluated anthropometry for ergonomics [34-37]. Some studies evalu- ated foot anthropometry in the context of investigations of foot abnormalities such as pes planus [38-40] or in the assessment of risk factors for footwear-related clinical deformities [41-42]. Furthermore, in several studies, the results of foot length and breadth are not presented as individual age groups but reported as a group summary, thus making direct comparisons impossible [43-44].
In all these instances, the anthropometric protocols used for percutaneous foot dimensions estimation are inconsistent, making direct data comparison a serious challenge. Percutaneous presents a number of advantages. It is relatively easy to obtain data sets from live subjects from a variety of population groups, obviating the development of regression models for predictive regression analysis for such target populations [45].
The record citing literature describing the normal distribution of age- and sex-variation in percutaneous foot dimensions in healthy Nigerian adolescent school children is sparse. With over 450 language groups distributed over a wide and diverse geographical and ecological terrain, the milieu for bio-diversity in foot anthropometry in Nigeria is intense and the demand for predictive regression models is potentially huge. The adolescent population in Southwest Nigeria, which includes the Lagos “mega-city,” is an intense ethnic and sociocultural mix which approximates the Nigerian adolescent population [46]. This study, therefore, evaluated sex- and age-differences in percutaneous foot anthropometric dimensions of healthy adolescent Nigerian population in urban Lagos, South-West Nigeria.
In conducting this anthropometric study, ethical clearance was obtained from the Health Research Ethics Committee (HREC) of the College of Medicine of the University of Lagos, prior to the commencement of sampling and measurements in all location. This included the consent forms. Approval was also obtained from the Authorities of Nigerian Air Force (NAF) Secondary School Sam Ethnan Air Force Base in Ikeja Local Government Area of Lagos State, located in the South–Western part of Nigeria.
We ensured strict compliance with institutional rules regarding consent for every individual participating child. Each participant received a consent form in which the purpose and procedure of measurement was carefully explained. The right of the child to withdraw at any stage of the study was clearly stated. Since these participants were minors, consent included the signed authorization of their parents/guardians in the form. All the children received a guarantee of preservation of their personal space throughout the measurement exercise. Only measurements belonging to those who returned signed informed consent form were recorded and processed.
The participants selected for this cross-sectional anthropometric study included 523 (263 female and 260 male) volunteer 10–17-year-old students of the Nigerian Air Force (NAF) Secondary School Sam Ethnan Air Force Base in Ikeja Local Government Area of Lagos State, located in the South–Western part of Nigeria. Oral interview indicated that the children in the sample were from Christian, Moslem or traditional African religious and sociocultural backgrounds. The “caste system” of marriage, which restricts intermarrying across “caste” barriers, is rarely practiced in West Africa and marriage laws in Nigeria do not restrict conjugal relationships across ethnic groups or social class [47-48]. Thus, the participants in this study were offspring of conjugal relationships that do not restrict transmission of genetic traits from parent to offspring in any special manner; hence a heterogeneous Mendelian population.
By a general physical examination, participants were in a satisfactory state of good health. The ethno-cultural distribution of the biological parentage of the subjects showed individuals from Yoruba, Ibo, Edo, Urhobo, Itsekiri, Ijaw, Ibibio, Efik, Annang, Igala, Hausa-Fulani, Nupe, Idoma and Tiv. Pure-bred Caucasian, African and Near East Semitics (Jews and Arabs) and Far East Asian participants were excluded alongside the acutely-ill, the physically challenged, persons on any form of continuous medication. Individuals with poor health conditions that manifested with overt signs of stunted growth or physical emaciation, or anyone with history or evidence of handicapping injuries and surgeries of the foot and ankle. Individuals with congenital musculoskeletal anomalies of the foot and ankle were also excluded.
At the outset of measurements, all anatomical landmarks were determined and marked using a felt-tipped, non-toxic and non-permanent marker. Each participant was required to be measured and then each test repeated “blind”. This is to allow for the determination of the intra-observer (intra-class) technical error of measurement or intra-class correlation (ICC) for each measurement.
a) Anthropometry Equipment
The Equipment used for this study included the following:
1. Cescorf Sliding Calipers calibrated in centimeters,
2. Digital Vernier caliper (Mitutoyo™ Japan).
3. Other materials included Latex hand gloves and non-permanent site-marking pens
4. Anthropometric proforma for collection of the participants’ data
5. A customized Anthropometric box
b) Subject Selection and Preparation
Subject selection for the research was done at the NAF Secondary school premises. All measurements were carried out in carefully selected clean, well-lit and well-ventilated room within the school premises between 9.00 a.m. and 3.00 p.m. daily. The personnel consisted of a tester/measurer (the 1st author), an observer and a recorder. These were fellow colleagues in the MSc Anatomy programme at the University of Lagos.
c) Anthropometry Techniques
The length and breadth of both feet along with the stature of each individual were measured using the anthropometric protocols recommended by the International Society for the Advancement of Kinanthropometry [49]. All the measurements were taken by one observer in order to avoid inter-observer bias. All measurements were taken during the 0900-1300 hours to avoid error due to diurnal variations. Anthropometric measurements defined below include:
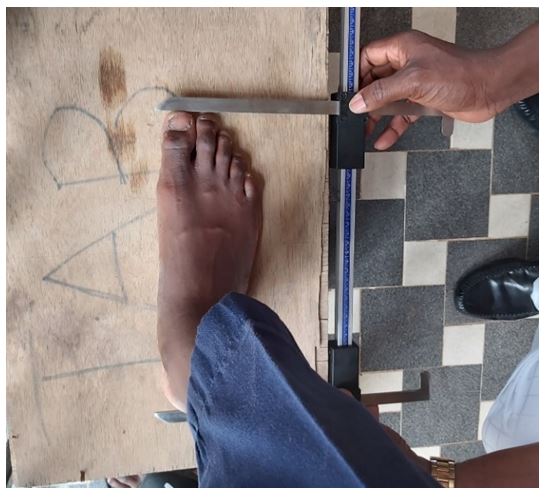
1. Foot length: This was measured as the perpendicular distance between the coronal planes of the pternion (heel) and the Akropodion, the longest toe of the foot.
2. Foot breadth: This was measured as the transverse distance between the most prominent point on the medial side of the metatarsals (metatarsal–tibiale) and the most prominent point on the lateral side of the metatarsals (metatarsal–fibulare).
N.B: To facilitate accurate measurement, the caliper scale was aligned parallel to the long axis of the foot. The long axis of the foot runs through the second digit. Foot breadth was measured perpendicular to the long axis with vernier calipers as a straight distance between the metatarsal fibulare and metatarsal tibiale, with the foot in a fully stretched position.
Tester/ Measurer Preparation
The preparations for anthropometry included the training of the tester/measurer in anthropometric techniques to competence level consistent with anthropometry technician Level 1 according to the protocol recommended by the International Society for the Advancement of Kinanthropometry (ISAK). This training was undertaken by the second author, who is an ISAK-certified Anthropometry Technician Level 2.
The tester/measurer and assistants were post-graduate students (all co-authors except the 2nd author) in the Department of Anatomy, College of Medicine of the University of Lagos. The measurer had reliability testing as part of the training, aimed to achieve technical errors within internationally accepted limits. All measurements were taken by the trained tester/measurer.
Measurement Error
The validity of the predictive regression models depends on the reliability of the measurements used. To determine measurement error intrinsic to this study, the two measures of validity given below were used: 1) Technical Error of Measurement (TEM) and 2) Intra-Class Correlation Coefficient (ICC).
Technical Error of Measurement (TEM): This is a measure of precision or replicability of measurement. The Intra-tester TEM was determined by taking six measurements: stature, foot length and foot breadth, repeated by the tester on 2 participants. The measurements were then repeated “blind”. The six “pairs” of measurement were compared using the equation given as follows:
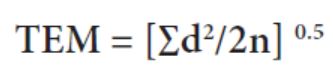
Where ‘d’ is the difference between the first and second measures of each measurement used and ‘n’ equals the number of measurement sites on the subjects.
The Intertester TEM was determined from six measurements each being taken by both the tester (2nd author) and the quality assurance person (1st author). This “pair” of measurements was also compared using the equation given above. The subjects, variables and measurement procedures used for the two types of TEM were the same but the tests had to be carried out independently. Since one of the testers is a certified anthropometrist, the intertester TEM was used as a measure of accuracy. The TEM provides an estimate of the measurement error in the units of measurement of the variable. This value indicates that two thirds of the time a measurement should come within +/- of the TEM.
This is a measure of accuracy of the test measurements. The equation for intra-class correlation coefficient of reliability, r, is given below:
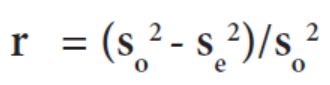
where so is the observed measurement variance and se is the error variance. In this equation, the factor (so2 - se2) represents the true measurement variance. For this study, the ICC approximated 0.90 which was considered adequate.
Analysis was carried out using the Statistical Package for Social Sciences (SPSS) version 20.0 to develop the linear regression equations and to compute the multiplication factors.
Normality of the sample was tested by employing the Kolmogorov-Smirnov test. Mean, standard deviation, coefficient of variation, independent and paired t-tests were used as statistical tools to analyze the data. Paired sample t-test was performed to estimate the differences between the right and left side in foot dimensions among males and females. The significance testing for sexual dimorphism was carried using the Student’s t-test. The alpha value, set at p< 0.05 was considered significant.
Numerical data obtained were collated and entered into a computer system and analyzed using the Statistical Package for the Social Sciences (SPSS) for Windows, version 25.0, Armonk, New York: IBM Corporation. The participants were grouped into 10-, 11-, 12-, 13-, 14-, 15-, 16-, and 17-year age groups respectively, using their biological ages (based on a 365-day calendar).). Descriptive and inferential statistics including mean, standard deviation and standard error as well as minimum and maximum values of the anthropometric dimensions were calculated. Two-sample t-test was conducted to test the existence of sexual dimorphism in the study sample.
A total of 523 made up of 263 females and 260 males participated in the study and all were considered in the data analysis (Table 1). The mean right foot length across all age groups in the female ranges from 21.07±2.6cm to 24.63±2.85 cm while in the male the figures range from 22.84±2.68 cm to 26.30±2.5 cm. Those of right foot breadth ranges from 8.43±0.65cm to 9.62±0.68cm in female and 8.57±0.59cm to 10.39±0.58cm in male. The mean left foot length in female ranges from 21.12±2.62cm to 24.59±2.76cm and in males from 22.83±2.66cm to 26.22±2.6cm, while mean left foot width in female ranges from 8.58±0.48cm to 9.55±0.8cm and from 8.46±0.56cm to 10.34±0.58cm in males. Across all the age groups, the male had statistically significant larger foot length and width than the females (p<0.05), as shown in Table 1 and Table 2 respectively). Result of two-sample t-test shows the existence of sexual dimorphism in the foot variables between the male and female samples (p<0.05).
The overall mean right foot length was 23.43±3.3 cm in the females and 24.50±2.9cm in males while the overall mean right foot width was 9.15±1.4cm in females and 9.53±0.9cm in males. The overall mean left foot length was 23.52±3.0cm in females and 24.566±2.9cm in males while overall mean left foot width in females was 9.16±1.3cm and 9.48±0.9cm in males. The effect of age and sex were observed in the foot variables.
This study was carried out to examining patterns of bilateral asymmetry and sexual dimorphism in foot morphology by percutaneous estimation of the foot length and width of adolescent Nigerian school children resident in Lagos state by observing the strict protocols recommended by ISAK as adopted previously in [50] to ensure that the data generated could become useful reference data, not previously available for this section of the Nigerian population. Linear distances were measured from anthropometric landmarks and compared for sex and sidedness.
To our knowledge, there are no studies in the literature on Nigerian adolescent populations that reported foot length and breadth measurements based on individual age-groups comparisons. This has been a major challenge for forensic anthropologists as well as shoe designers whose protocols frequently require these age-wise categorizations.
Most, if not all, previous studies in the adolescent period summarized and analysed their data altogether, with results that tended to be of little further assistance for forensic investigation [26,44]. For instance, some studies on the Nigerian adolescent foot compared the normal foot with flat-foot deformities in the two Nigerian ethnic nationalities- among the Yoruba (Umar and [39,42] and among the Hausa [40]. [32] assessed sexual dimorphism in several anthropometric dimensions among the Igbos. In our recent study of prevalence of flat foot among Nigerian children aged 6-15 years [10] we did not report the absolute measures of foot length and width. When anthropometric dimensions among adolescent Nigerian children have been assessed especially for nutritional assessment, the feet are hardly considered relevant [25,28,29,33,35].
Thus, [51] indicated in their study among Glaswegians that establishment of growth reference values is needed in pediatric practice where pathologic conditions can have a detrimental effect on the growth and development of the pediatric foot. This has been re-emphasized in [5 ], in their recent study of regression modeling of anthropometric dimensions among Nigerian adolescent schoolchildren.
In the current study, we used basic descriptive and inferential statistical tools including the t-test to evaluate the effects of simplest anthropometric predictor variables (age and sex) on anthropometric characteristics of the peripubescent foot. As is to be expected, the study observed that foot length and breadth, as estimated by the mean and standard deviation and compared using the coefficient of variation (CV), varied with age among Nigerian adolescents aged 10 to17 years (see Table 1). While a growth peak, the measure of maximum growth in the foot length, was observed in the boys at the age of 15 years, no significant bilateral asymmetry was observed. This was indicated by the low coefficient of variation of 10.32-10.94% when the mean and standard deviations were compared on both sides. This finding is quite significant as a related and recent study among adolescent Chinese boys aged 13-18 years by [52], reported the growth peak in foot dimensions occurring at the age of 13–14 years, suggesting that during the adolescent period in Chinese boys, growth in foot length must have ceased up to 2 years earlier than their Nigerian counterparts. Genetic constitution, lifestyle habits such as physical activities and shoe-wearing habits as well as environmental factors such as nutrition and socio-economic factors are some of the known factors that affect the overall growth of a child [53-55]. These factors could account for the differences in the growth peak of the foot dimensions of the Chinese and Nigerian adolescent populations. The absence of significant bilateral asymmetry observed in our study agrees with the findings of [51] who studied Glaswegian children aged 9-12 years and that of [56] who studied Spanish school children aged 6-12 years.
Our study further noted that at the age 15 years in adolescent girls, the right-sided foot length was 23.71 ± 2.12 cm (CV= 8.94%) while the left side was 23.73±2.01cm (CV=8.47%). This finding showed clearly that significant sexual dimorphism existed between Nigerian adolescent boys and girls at this age at a probability level of p<0.001(see Table 2). However, the very low coefficient of variation (<10%) in the mean and standard deviation of the foot length measures indicates non-significant bilateral asymmetry in Nigerian adolescent girls at age 15 years. However, it was observed that the Nigerian girls in our study did not attain peak growth in foot length until the age of 16 years. Again, the maximum foot length of 24.4±2.72cm (CV=11.15%) on the right side as compared with the left side values of 24.51± 2.62cm (CV=10.69%) indicates that there was a non-significant bilateral asymmetry.
In a related study by [57] among adolescent North Indian girls aged 13-18 years, it was reported that North Indian adolescent girls attained their peak growth in foot length by age 14 years with no significant bilateral asymmetry. On the other hand, peak growth in foot width was attained at age 13 years, with a highly significant bilateral asymmetry. However, a similar study among Chinese adolescent girls aged 13-18 years by [52] found a growth peak in foot dimensions occurring at the age of 14–15 years.
Peak growth in foot width in our study indicated that adolescent males did not attained peak growth until the age of 17 years. The difference between the right side (10.39±0.58 cm, CV=5.58%) and the left side (10.34±0.58 cm: CV= 5.61%) was not statistically significant. Although female adolescents attained maximum foot width at about the same age 17 years as males, sexual dimorphism in this group was highly significant at p<0.001 (see Table 1). The difference between the right side (9.62±0.68cm; CV=7.07%) and the left side (9.55±0.62 cm; CV=6.49%), also revealed non-significant bilateral asymmetry. While our study of adolescent Nigerian girls showed significantly smaller values in absolute foot measurements compared with adolescent boys of the same age, when the foot measurements were compared and analyzed, gender differences decreased as indicated by the relatively small coefficient of variation (CV<15%).
The process of maximal growth in height, limbs length, and foot length vary in time in childhood and adolescence [58].
[7] found that the maximal growth in foot length was found to occur at 4–12 years and that foot length ceased to increase at 16 years of age, while the maximal growth in individual height was found to occur at 4–14 years of age and ceased by 18 years of age in male Americans. These findings indicate that maximal foot length developed at a younger age than maximal individual height. In the current study, the feet of adolescent girls reached maturity earlier than for adolescent boys, according to the analysis of foot measurement data. Most foot measurement variables reached ceased to increase by the age of 15 years of age in adolescent girls and by 16 years of age in adolescent boys. These findings are supported by a study of children and adolescents in Japan reported by [59] who found that the foot length ceased to increase at 13 years of age in girls and 14 years of age in boys.
Thus, the finding of the current study showed that Nigerian adolescent boys had greater absolute variables for foot measurements when compared with adolescent girls of the same age. Several previously published studies have reported similar results for gender differences in foot measurements and morphology among children and adults. [56] reported that Spanish boys had longer foot lengths, wider foot widths, and a higher instep when compared with girls. [60] showed that the foot lengths of preschool boys were significantly greater when compared with girls of the same age. [61] found that foot measurements of boys were significantly greater compared with those of girls of the same age for 11 out of the 15 variables studied including foot length, breadth, height, and girths.
Some authors have reported that onset of adolescent growth spurt usually occurs at about 11 years in boys and 9 years in girls with peak height velocity occurring about 2 year later in both sexes [62] and this period coincides with mid-adolescence. Further, during this period, height velocity is approximately 9.5 cm/year in boys and 8.5 cm/year in girls [54] with growth occurring concurrently (albeit at varying rates) in other parts of the body, including the foot. Thus, when the foot growth of adolescent girls is slowing down, the foot growth of adolescent boys persists resulting in greater foot dimensions in the boys. This may explain the significant sex differences in foot anthropometry of participants in this study especially in 14-17 years period. In fact, it has been suggested that the commencement of adolescent growth spurt at 9 years of age in females (one year before its commencement in males), reaching its peak velocity at about 2 years later may account for females having larger foot width than males in the 10- and 13-year age groups in this study [63]. In addition, the statistically significant difference between male and female foot dimensions could be attributed to environmental factors and differences inherent in the genetic constitution of male and female [53-55,64]. This difference necessitates further studies and the formulation of different regression equations for the two sexes.
This study had several limitations. The body mass index (BMI) and physical activity of the study participants, which may influence foot shape, were not considered in the current study. Other important measurements of foot morphology including arch height and heel breadth were not measured in this study. This study did not distinguish between individuals with flat-foot from individuals without flat-foot in the study population, flat-foot being a factor that was likely to influence the findings. Also, no distinction was made whether the children were habitually barefoot or shod. These limitations should be considered in the design of future studies.
This study has provided data on foot anthropometry of Nigerian adolescent children who were born at about the beginning of the current millennium and resident in Lagos State South-West Nigeria. The study showed that there is a statistically significant age-related variability and sexual dimorphism in anthropometric foot dimensions in Nigerian adolescent schoolchildren in Lagos. The findings from this study could serve as useful baseline data for more advanced studies by anatomists and forensic scientists in personal identification of human remains. The findings could also be beneficial to ergonomists in the garment and footwear industry.
1. Further studies on anthropometric foot dimensions are desirable among Nigerian adolescent children population in different tribes and ethnics.
2. Regression modelling for sex determination and estimation of Nigerian adolescent children population should become statutory for all ethnic nationalities in Nigeria.