Simulation of Electrical Fields in Cardiac Resynchronization Therapy and Temperature Spread in HF Ablation
Background: The electrical field (E-field) of the biventricular (BV) stimulation is important for the success of cardiac resynchronization therapy (CRT) in patients with cardiac insufficiency and widened QRS complex. The 3D modelling allows the simulation of CRT and high frequency (HF) ablation.
Purpose: The aim of the study was to model different pacing and ablation electrodes and to integrate them into a heart model for the static and dynamic simulation of atrial and BV stimulation and high frequency (HF) ablation in atrial fibrillation (AF).
Methods: The modelling and simulation was carried out using the electromagnetic simulation software CST (CST Darmstadt). Five multipolar left ventricular (LV) electrodes, one epicardial LV electrode, four bipolar right atrial (RA) electrodes, two right ventricular (RV) electrodes and one HF ablation catheter were modelled. Selected electrodes were integrated into the Offenburg heart rhythm model for the electrical field simulation. The simulation of an AV node ablation at CRT was performed with RA, RV and LV electrodes and integrated ablation catheter with an 8 mm gold tip.
Results: The right atrial stimulation was performed with amplitude of 1.5 V with a pulse width of 0.5. The far-field potentials generated by the atrial stimulation were perceived by the right and left ventricular electrode. The far-field potential at a distance of 1 mm from the right ventricular electrode tip was 36.1 mV. The far-field potential at a distance of 1 mm from the left ventricular electrode tip was measured with 37.1 mV. The RV and LV stimulation were performed simultaneously at amplitude of 3 V at the LV electrode and 1 V at the RV electrode with a pulse width of 0.5 ms each. The far-field potentials generated by the BV stimulations could be perceived by the RA electrode. The far-field potential at the RA electrode tip was 32.86 mV. AV node ablation was simulated with an applied power of 5 W at 420 kHz and 10 W at 500 kHz at the distal 8 mm ablation electrode.
Conclusions: Virtual heart and electrode models as well as the simulations of electrical fields and temperature profiles allow the static and dynamic simulation of atrial synchronous BV stimulation and HF ablation at AF. The 3D simulation of the electrical field and temperature profile may be used to optimize the CRT and AF ablation.
Keywords: Cardiac Resynchronization Therapy; Electrical Field; Biventricular Stimulation; 3D Modeling; Computer Simulation Technology; High Frequency Ablation; Electrode Model; Atrial Fibrillation
The development of innovative types of electrodes and the further development of existing products account for a large part of the resulting costs for a company. With the help of suitable software, changes of the constructions can be recorded and certain simulations, e.g. the occurrence of interactions in the electric field, can be carried out before the actual prototyping. Barold and Kucher evaluated far-field atrial oversensing by left ventricular electrode displacement in CRT-D patients with left ventricular undersensed activity during the blanking periode [1]. Lewicka-Nowak and co-workers found 11% far field R-wave sensing by atrial electrode at the right atrial appendage versus 1% at the Bachmann’s bundle [2]. Taieb and co-workers analysed left atrial far-field sensing by left ventricular electrodes in 8.5% of CRT devices with potential hazard in CRT [3]. Atrioventricular nodal ablation in CRT patients with atrial fibrillation is a class IIa and level B indication for ablation and Aune and co-workers found a significant improvement of ventricular capture from 68% to 98% after atrioventricular nodal ablation [4]. Barold and Herweg analysed after atrioventricular ablation an improved risk of device failure and death in pacemaker dependent patients [5]. The aim of the study was to model different pacing and ablation electrodes and to integrate them into the Offenburg heart rhythm model (HRM) for the static and dynamic simulation of biventricular stimulation and HF ablation in atrial fibrillation using the CST STUDIO SUITE® (CST Computer Simulation Technology AG, Darmstadt).
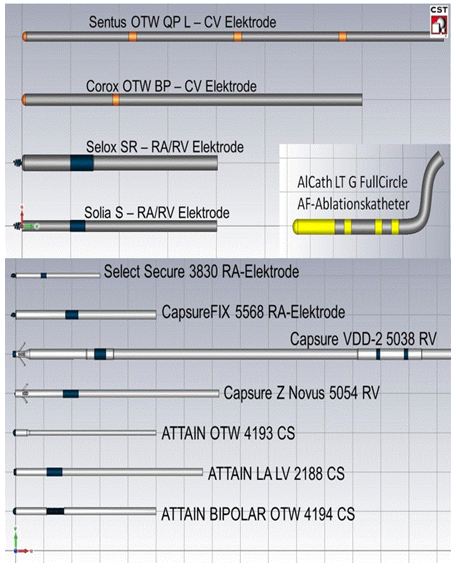
The modelling and simulation were carried out using the CST (Computer Simulation Technology, Darmstadt) design and simulation software. A total of five multipolar left ventricular electrodes, one epicardial left ventricular electrode, four bipolar right atrial electrodes, two right ventricular electrodes and one HF ablation catheter were modelled on the basis of the technical manuals of the manufacturers Medtronic and Biotronik (Figure 1).
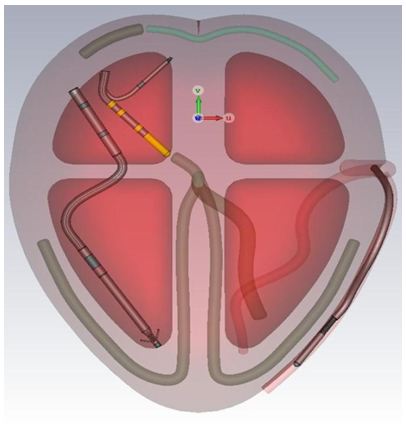
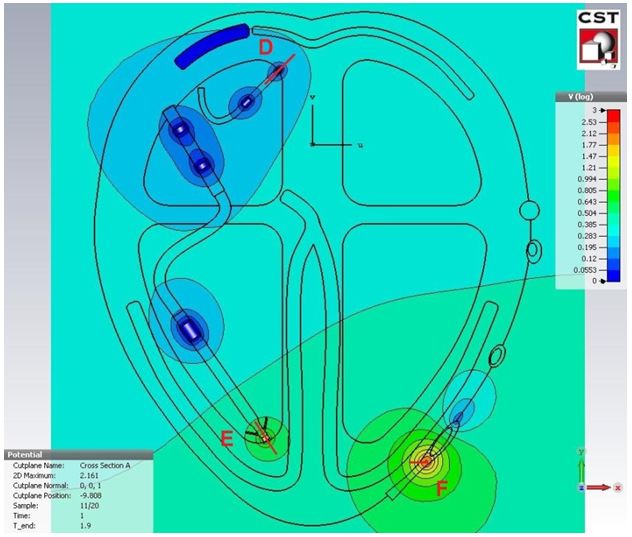
The SelectSecure 3830, Capsure VDD-2 5038 and Attain OTW 4194 (Medtronic) were integrated into the Offenburg heart rhythm model for the simulation of the E-field during atrial and biventricular stimulation [6]. The simulation of an AV node ablation at CRT was performed with right atrial, right ventricular and left ventricular electrodes and the integrated ablation catheter AlCath LT G FullCircle (Biotronik) (Figure 2). Electromagnetic simulation and calculation of temperature spread was performed with CST STUDIO SUITE®.
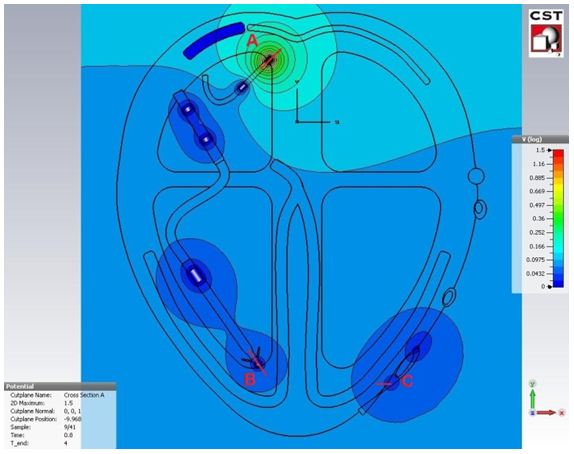
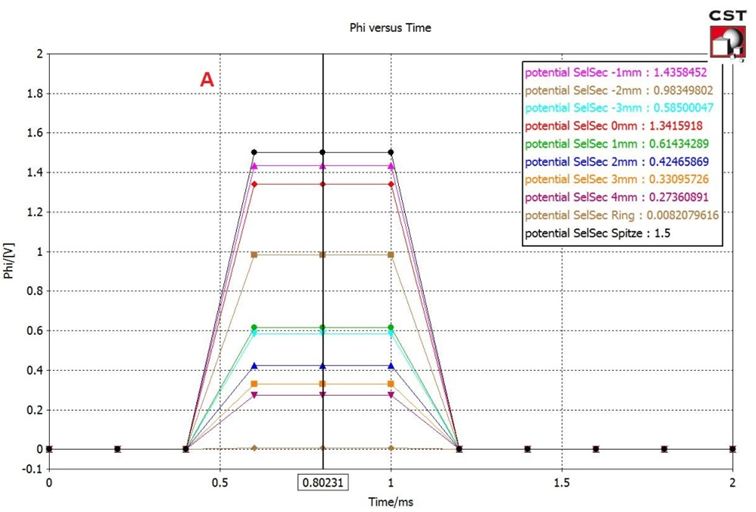
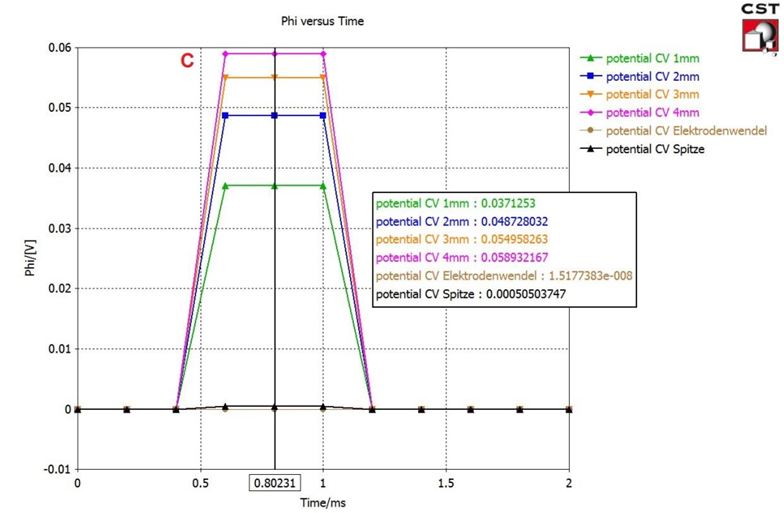
The right atrial stimulation was performed with an amplitude of 1.5 V with a pulse width of 0.5 (Figure 3). The far-field potentials generated by the atrial stimulation were perceived by the right and left ventricular electrode (Figure 4a,Figure 4b and Figure 4c). The far-field potential at a distance of 1 mm from the right ventricular electrode tip was 36.1 mV (Figure 4b). The far-field potential at a distance of 1 mm from the left ventricular electrode tip was measured with 37.1 mV (Figure 4c).
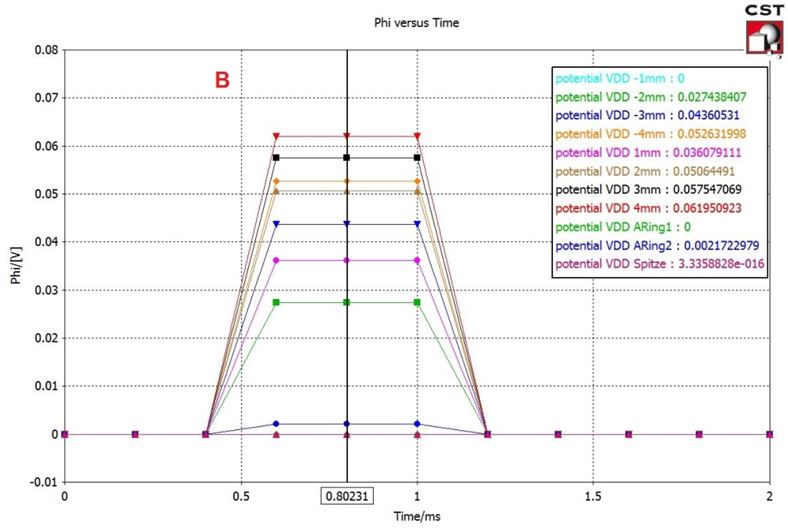
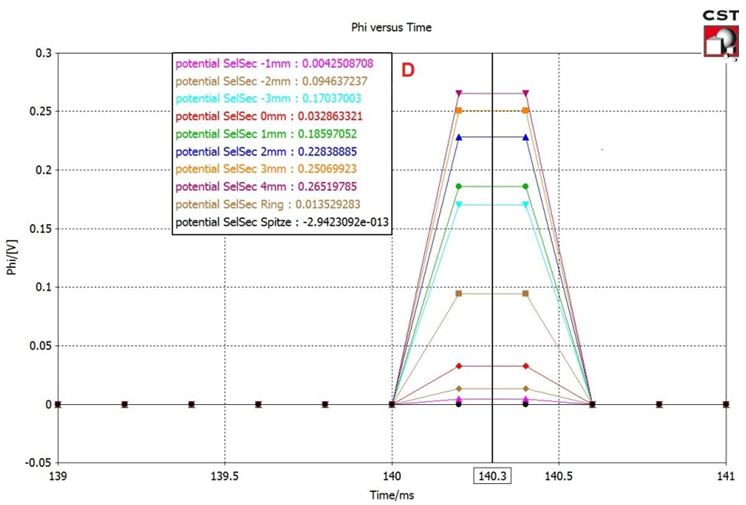
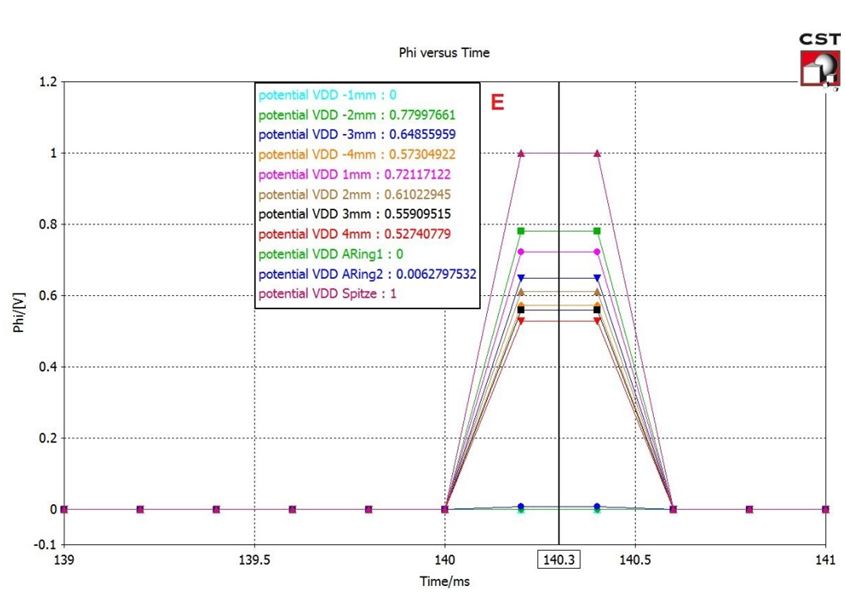
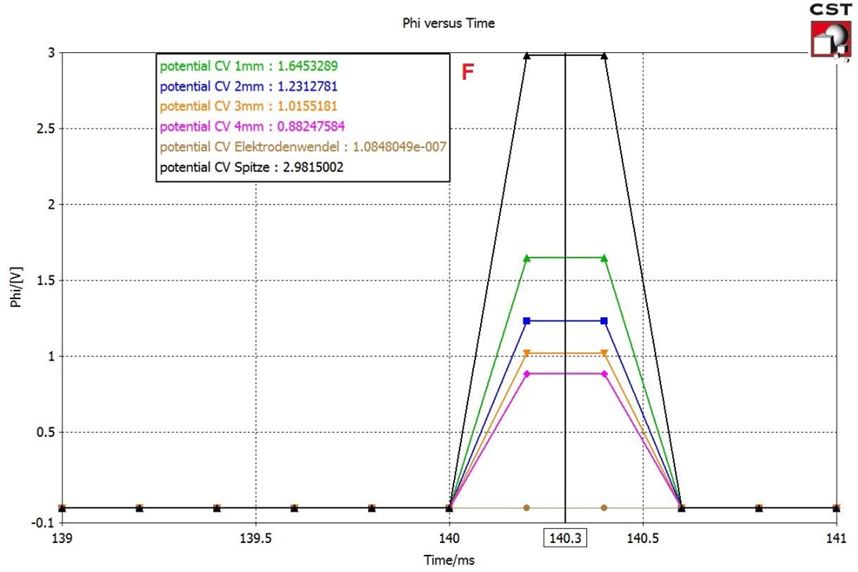
The right ventricular and left ventricular stimulations were performed simultaneously with an amplitude of 1 V at the right ventricular electrode and 3V at the left ventricular electrode with a pulse width of 0.5 ms each (Figure 5). The far-field potentials generated by the biventricular stimulation were perceived by the right atrial electrode. The far-field potential at the right atrial electrode tip was 32.86 mV and at a distance of 1 mm from the right atrial electrode tip was 185.97 mV obtained (Figure 6a, 6b and 6c).
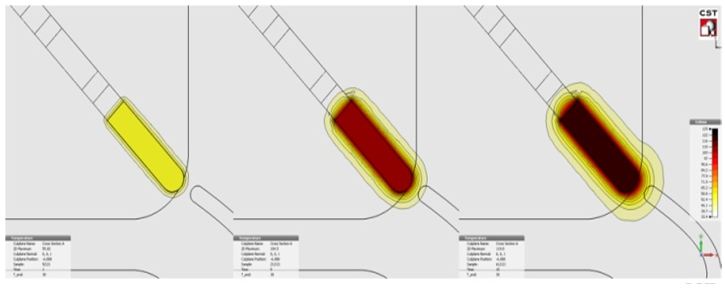
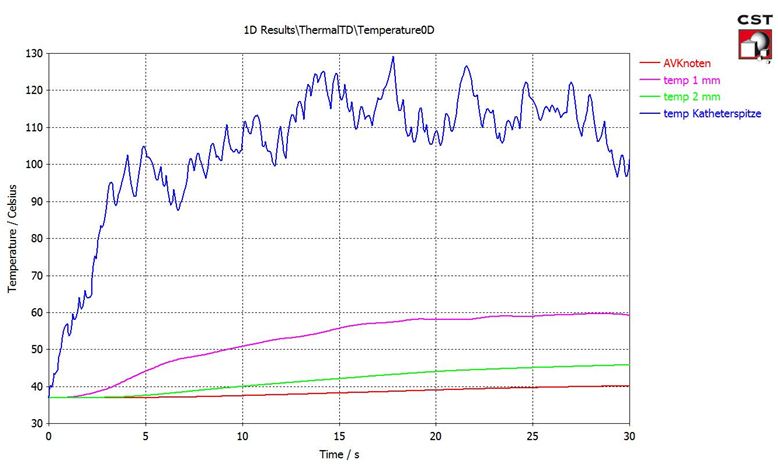
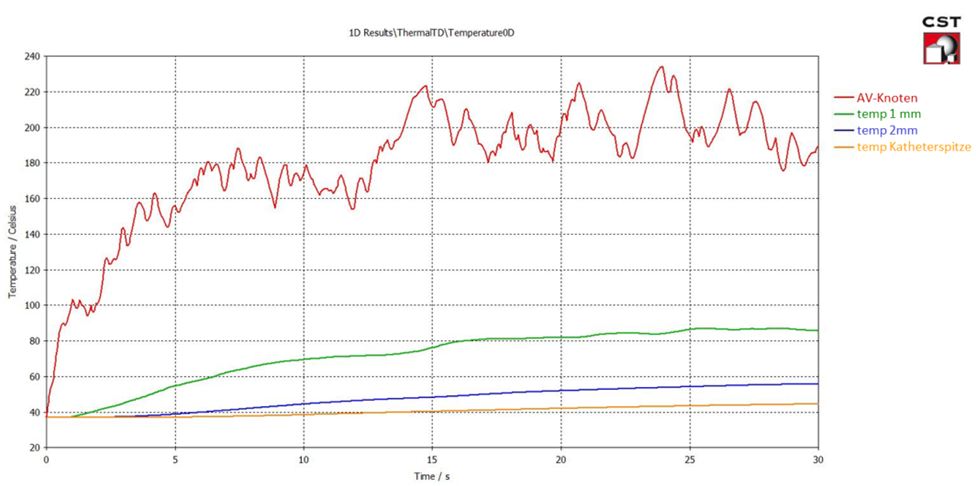
AV node ablation was simulated with an applied power of 5 W at 420 kHz at the distal 8 mm ablation electrode. The temperature at the catheter tip was 103.87 °C after 5 s ablation time, 44.17 °C from the catheter tip in the myocardium and 37.61 °C at a distance of 2 mm. After 10 s, the temperature at the three measuring points described above was 107.33 °C, 50.87 °C, 40.05 °C and after 15 seconds 118.42 °C, 55.75 °C and 42.13 °C. Figure 7a and 7b shows the temperature spread in the tissue graphically after 1 s, 5 s and 15 s and the temperature profile over the total ablation time of 30 s at the four measuring points. Another AV node ablation was simulated with an applied power of 10 W at 500 kHz at the distal 8 mm ablation electrode. Figure 8 shows the temperature profile over the total ablation time of 30 s at the four measuring points.
Virtual heart and electrode models as well as the simulations of E-fields and temperature profiles allow the static and dynamic simulation of atrial-synchronous biventricular stimulation and HF ablation at atrial fibrillation. It should be noted that during a realistic AV node Ablation, a temperature detector in the ablation catheter tip controls the temperature spread automatically when a temperature of 40 to 55 °C at the catheter tip is achieved to prevent carbonation of blood and tissue. The future use of the virtual heart and electrode models should be to 1. identify the optimal sites of bipolar RV and LV stimulation and sensing vectors, 2. Optimization of multi point LV stimulation and sensing vectors of quadripolar LV electrodes in ischemic and non-ischemic heart failure and 3. use the model in the preparation to ventricular arrhythmias’ ablations and simulation of arrhythmogenic substrate modification of ventricular tachycardia. There are other voxel models on the market which can be used for simulations. These are, for example, the VHP Female V. 3.0 or HUGO from CST, which were created on the basis of the Visible Human Project® [7]. The Offenburg heart rhythm model was preferred because it represents all relevant anatomical structures as well as the cardiac conduction system. The many possibilities of individual adaptation of the simulations and the integrating real-life models with realistic parameters could be completely new possibilities for optimizing CRT and AF ablation on the patient may be feasible to reach. With the help of MRI or CT scans of the Patients may it´s possible to create a heart model and in advance the most favourable position for the AV ablation or CRT stimulation. This could reduce the treatment time of the Patients and also the exposure of the patient to harmful radiation be reduced.