Socioeconomic Inequalities in the Adoption of Antimalarial Resistance-Promoting Behaviours: A Quantitative Study of the Use of Mixed Drugs for Malaria Treatment
Antimalarial drug use behaviours remain critical drivers of drug resistance as they can affect some of the other important factors implicated in the development of resistance. The overall aim of this study is to investigate the use of mixed drugs for malaria treatment and how (if any) the prevalence is patterned along the socioeconomic stratification of the population. A cross-sectional survey of 415 malaria patients was analyzed using multivariate logistic regression models to examine the effects of the socioeconomic factors in the use of mixed drugs for malaria treatment; and the association between the use of mixed drugs and the experience of treatment failure. Household income, living in a rural area, and the type of health facility used were associated with the use of mixed drugs for malaria treatment. Patients who used informal health facilities were 70% more likely to get mixed drugs compared to those who used formal health facilities. The use of mixed drugs for last malaria treatment was associated with the experience of treatment failure. The fact that the use of mixed drugs for malaria treatment is socially patterned is the corollary of the determinant effect of socioeconomic factors on this behaviour.
Keywords: Mixed Drugs for Malaria; Socioeconomic; Inequalities; Malaria; Resistance; Drug use Behaviour; Antimalarial
The global burden of malaria is well represented in the literature [1,2]. In 2017, There were estimated 219 million malaria cases with about 435,000 deaths associated with malaria globally [3]. The African region still accounts for most of the global malaria burden (about 92% and 93% of malaria cases and deaths in 2017) [3]. Nigeria accounted for 25% of the global burden of malaria in 2017. This means that one in every four global malaria cases and deaths in 2017 occurred in Nigeria [3].The last two decades have seen increased interest in malaria research and control programs leading to significant reduction in the global incidence and mortality (21% and 29% reduction in incidence and mortality respectively between the years 2010 and 2015) [2]. This reduction is partly due to the increase in access, availability, and affordability of artemisinin-based combination therapies (ACTs)–the recommended first-line treatment for malaria- in malaria-endemic regions [2]. Given the important role of ACTs in reducing malaria incidence and mortality, it is expected that factors that affect the efficacy of this first-line treatment for malaria will invariably affect the present success in malaria treatment. One of such factors is the development of drug resistance.
Evidently, the development and spread of resistance to antimalarial drugs by Plasmodium parasites have been a major challenge to achieving a malaria-free world [4,2]. The present era of intense globalization has favoured the spread of resistant malaria parasites from one part of the world to another in short periods of time [4,5]. Artemisinin resistance by Plasmodium parasites has been confirmed in five countries of the Greater Mekong Subregion[6-8]. Although resistance to artemisinin drugs has not been confirmed in Africa, there are indications of a repeat of history as resistance against other antimalarial drugs in the past–like Chloroquine, Sulfadoxine-Pyrimethamine and Mefloquine - first emerged in the South East Asia (SEA) and subsequently spread rapidly to other parts of the world, particularly Africa [9]. As such, the effectiveness of ACTs as the first-line treatment for malaria is in jeopardy.Resistance poses a major threat to the global efforts to control and indeed, eradicate malaria [10,11]. Infections with resistant strains are usually characterized by prolonged morbidity and infective period, and worse outcomes in relation to illness experience and mortality [4,2].
This threat to malaria control becomes more pronounced given the new development in malaria incidence with stalled, and in some cases reversal, of the progress recently achieved in reducing the incidence of malaria reported by the World Health Organization in its latest World Malaria Report [1].
Indeed the mechanism behind the development and spread of resistance is a complex one with multiple factors (such as drug use practices, drug half-life, transmission intensity, clone multiplicity, parasite density, host immunity, within-host dynamics and the genetic basis of drug resistance) in play [5,11-15]. The effects of these factors have been reported in the literature, but their exact impacts are not well established [14]. Importantly, drug use behaviours have played a key role in the development and spread of antimalarial drug resistance [14,16]. Antimalarial drug use behaviours that can promote drug resistance such as presumptive diagnosis/treatment, drug overuse, use of sub-therapeutic doses, are very important and well reported in malaria literature. Nevertheless, these known resistance-promoting drug use behaviours are not exhaustive; our previous study which, to the best of our knowledge, is the first to report another important resistance-promoting antimalarial drug use behaviour –the practice of mixing drugs for malaria treatment- is evident to this [17]. Mixing of drugs for malaria treatment was described as the practice of ‘combining different drugs to treat malaria’. It involves the combination of single doses from each of the included drugs to form a mixed dose. Apart from the fact that they contain at least one antimalarial drug, there is no standard regarding the number or type of drugs used in the mixture for malaria treatment. The dangers of this practice become more pronounced given that the drugs are dispensed in single doses (removed from their original packets and divided into individual doses) rather than as a complete course and then mixed with other classes of drugs like antibiotics, analgesics and multivitamins. As such this practice becomes important in promoting the exposure of the parasites to subtherapeutic doses, and the use of expired and fake antimalarial drugs (given that the original packagings of the drugs are removed before being mixed) [17].
The practice of mixing drugs for malaria treatment is different from co-prescription and polypharmacy which have been reported long ago in malaria treatment in Nigeria) [18]. Although in both practices, one of the rationales for adding other non-malaria therapies is the treatment of the symptoms of malaria (like vomiting in the case of co-prescription with anti-histamine [18]. Nevertheless, unlike in mixing, the complete course of the drugs, especially the antimalarial drug, is usually acquired in co-prescription. But with mixing, the drugs (including the antimalarial) are all dispensed as single doses that are put together to form a mixed dose; with users having the option of buying as many mixed doses as they want or can afford [17]. In polypharmacy, individual drugs are used as multiple treatments for multiple conditions, whereas in mixing, the drugs are all used for the treatment of one disease condition, in this case, malaria.
As an important aspect of malaria treatment, understanding the factors that can predict the distribution of important antimalarial drug use behaviours is important to malaria control. This study therefore aimed at evaluating the relationship between socioeconomic factors and drug use behaviours that can promote the development and spread of antimalarial drug resistance. Reported as a coping strategy by most of those who used the mixed drugs for malaria treatment, there is need to understand the association between this important drug use behaviour with measures of socioeconomic position. This need formed the focused of this study [17]. As such, this study adopted a social epidemiological stance in investigating the role of socioeconomic factors in predicting the use of mixed drugs for malaria treatment [19,20].The overall aim of this study is to investigate the use of mixed drugs for malaria treatment in two states in Nigeria, and how (if any) the prevalence is patterned along the socioeconomic stratification of the population.
A cross-sectional survey was conducted with participants who were seeking malaria treatment from different types of health facilities -formal (private and public hospitals or clinics) and informal (drug vendors/chemists and pharmacies)- in the study sites covered by our previous study [17]. To reduce recollection bias, only those who were currently seeking malaria treatment were included. Data was collected using a questionnaire developed for this study based on the findings of our previous qualitative study [17]. Questions were asked on participants’ current and last malaria treatment experiences. To ensure that those who can provide accurate information on their antimalarial drug use behaviours and socioeconomic position are recruited, only household heads or their proxy were included in this study. The primary outcome variable in this study is the use of mixed drugs for malaria treatment which is indicated by participants’ use of incomplete courses of different drugs, including an antimalarial drug, for malaria treatment. The use of incomplete courses of medications in mixed drug differentiates this practice as investigated in this study from other practices like co-prescription.
Participants were recruited from health facilities in Imo state and Abuja while seeking malaria treatment (see Figure 1 on Map of Nigeria showing study areas). Data were collected from facilities in both urban and rural areas in these locations so as to include the experiences and treatment seeking behaviours of people from different socioeconomic backgrounds. Both states had some similar population characteristics and differ in terms of predominant culture, language, and religion. A simple random sampling method was used in the selection of facilities to recruit participants from, while a systematic probability sampling method was used in drawing participants from each facility.
Four hundred and fifteen (415) participants were recruited in this study. In determining the sample size, the Slovin’s formula was used in calculating the sample size at 5% (0.05) margin of error using the total number of households in Abuja and Imo state from the National Population and Housing Census [21].
Reliability of the instrument used in this study was assessed using a test-retest, and interrater exercises. Internal validity was assessed using face validity, construct validity, and content validity approaches. The piloting of the questionnaire (which involved the dissemination of the questionnaire to 10% (40) of the desired sample size for their critique of the design, wording, terminologies and languages used in the questionnaire) was a very important aspect of the study design as it was used to test and demonstrate the questionnaire’s validity as a good instrument in achieving the study aim and objectives.
Multivariate logistic regression models were built to investigate whether socioeconomic inequalities exist in the use of mixed drugs for malaria treatment while adjusting for important covariates like the type of facility antimalarial drug was sourced from, the use of diagnostic test prior to malaria treatment, patients’ age and gender amongst others. The association between the use of mixed drugs for malaria treatment and the outcome of treatment failure was also assessed using a multivariate logistic regression model. Patients’ report on their last two malaria treatment experiences, including whether or not a parasite-based diagnostic test was conducted to confirm malaria prior to the last treatment, the type of antimalarial drug used, the time between the last two episodes, and treatment outcomes were all used to compute a dummy variable on ‘suspected’ treatment failure.Participants who have taken an antimalarial drug within the last 14 days for the current malaria episode were identified as suspected cases of treatment failure. This classification is based on evidence that the reappearance of the Plasmodium parasites within 14 days of treatment with antimalarial drugs is more likely a case of treatment failure than reinfection [5]. All statistical tests were significant at a p-value of 0.05 or less at a 95% confidence interval. Analyses were undertaken using SPSS version 24.
This study was approved by the University of Sunderland Research Ethics Committee (approval number: 16/300); and the Federal Capital Territory Health Research Ethics Committee, Nigeria (approval number: FHREC/2016/01/40/23-05-16). Before completing the questionnaire, a participant information sheet was given to all participants (this was also followed by verbal explanations of the study protocol, especially for those who were not literate), and verbal informed consent was obtained.
Four hundred and fifteen participants were included in this survey. The participants were recruited from formal (private hospitals, and public hospitals) and informal (chemists and pharmacies) health facilities in the study sites. Sixty-four percent of the participants were females. Half of the participants were from urban areas. The mean household monthly income was N120,769 (£292.9 using an exchange rate of N412.39 (Nigerian Naira) for £1 (British Pounds) as at the time of data collection), with 14.2% earning below the national minimum monthly wage of N18,000 (£43.6).The sociodemographic distribution of the participants by the use of mixed drugs, parasite-based diagnostic test and source of the antimalarial drug used are presented in Table 1. The
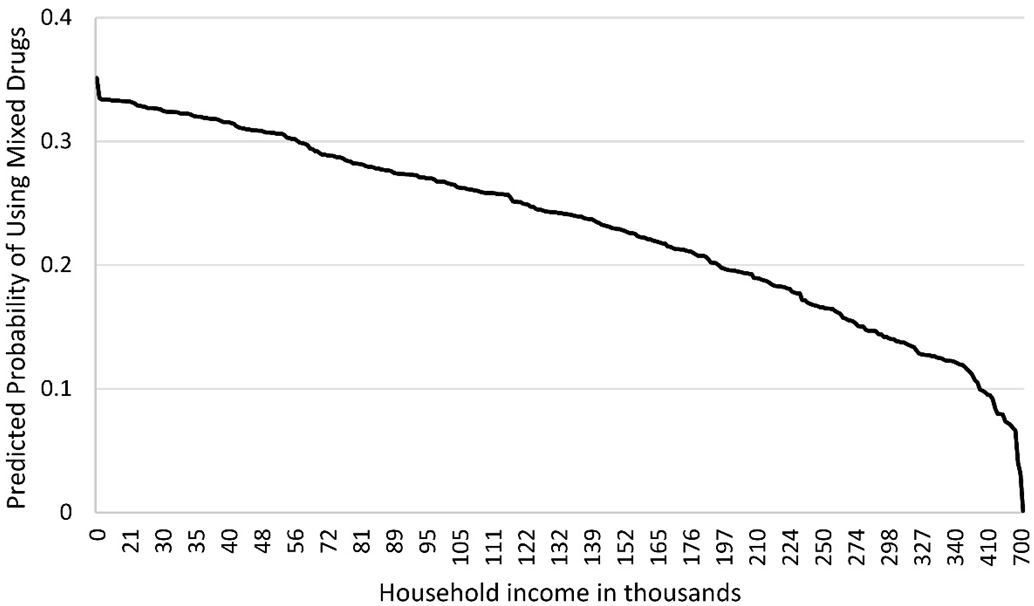
Participants’ household monthly income, educational level and type of settlement were tested for association with the use of mixed drugs. The odds of using mixed drugs for malaria treatment differed by household income and type of settlement. The odds of using mixed drugs for malaria treatment reduces by 4% per ten thousand naira increase in household income (OR: 0.96; 95% CI: 0.94-0.99) (Figure 2). Those in the rural areas had higher odds of using mixed drugs for malaria treatment compared to those in urban areas (OR 7.23; 95% CI: 3.00-17.78).
Another significant predictor of the use of mixed drugs for malaria treatment was the type of health facility where the malaria treatment was sought. Those who used informal health facilities had 73% higher odds of using mixed drugs compared to those who used formal health facilities (OR: 1.73; 95% CI: 1.08-2.76).
The use of mixed drugs for last malaria treatment was associated with the experience of treatment failure. Participants who used mixed drugs for last malaria treatment were four times more likely to experience treatment failure than those who did not (OR: 4.00; 95% CI: 1.52-10.47). Also, using diagnostic test prior to treatment reduces the odds of experiencing treatment failure by 48% (OR: 0.52; 95% CI: 0.29-0.95).
Household income and type of settlement were the two socioeconomic factors that predicted the use of mixed drugs for malaria treatment in our study. There is a consistent downward trend in the probability of using mixed drugs for malaria treatment with an increase in household income. Seeking malaria treatment from informal health facilities increases the odds of using mixed drugs for malaria treatment.
In settings like Nigeria where the cost of healthcare is relatively high, and healthcare expenditure accounts for most of the household domestic spending, the use of appropriate treatments becomes challenging for households with low income [17]. The adoption of treatment options such as the use of mixed drugs subsequently affects treatment outcomes as demonstrated by the increased odds of experiencing treatment failure among those who used mixed drugs for malaria treatment in this study.
Malaria treatment experience, with regards to the use of mixed drugs, differed among individuals from different types of settlement. Living in a rural area significantly increased the odds of using mixed drugs for malaria treatment. Furthermore, this trend is related to the inequalities in access to quality healthcare that exists between different types of settlements in Nigeria; that is the disparity in the availability of formal health facilities to the disadvantage of those in rural areas who rely mainly on the less regulated informal health facilities [23]. Most of the mixed drugs reportedly used were obtained from informal health facilities, most of which were in rural areas. The consequences of such drug use practice transcend the risk of treatment failure at the individual level.
Importantly, the mixing of drugs paves the way for different factors that can promote the development and spread of antimalarial drug resistance thereby constituting a public health issue. It does so by exposing the parasite to sub-therapeutic dose, as such encouraging the development of drug resistance [5,15]. In addition to this, mixing of drugs for malaria treatment affects patients’ access to information relevant to ensure adherence, and can also promote the sale of expired and fake antimalarial drugs to unsuspecting users as the mixed drugs are not dispensed in their original packaging.
Furthermore, the practice of mixing drugs can also aid the degradation of the drugs considering that the drugs when removed from their original packaging during dispensation, are usually placed in an unsealed paper envelope rather than a container similar to that in which the manufacturers used to package the drug, as required [17,24]. This issue is further highlighted by the high rate of poor quality antimalarial drugs in Nigeria. In their study investigating three thousand antimalarial drugs purchased in Enugu state, Nigeria Kaur, et al. found that 1 in 10 malaria drugs of the antimalaria drugs tested was of poor quality [25]. Another compelling issue with mixing is the composition of mixed drugs. The drug vendors interviewed in the qualitative study listed drugs like antimalarial, analgesics, and antibiotics as components of the mixed drugs for malaria treatment [17]. As the practice of mixing drugs for malaria treatment is relatively new in malaria literature, there is no evidence of the outcome of the interaction of the drugs used in the mixture; nevertheless, there are indications that the interaction of these drugs when administered together might affect their potency. Some studies have reported that concurrent treatment involving the use of antimalarial drugs and other drugs can affect the efficacy of the drugs [5,26].
One of the limitations of this study is that treatment failure was determined using variables from self-reported treatment experiences and outcomes rather than a laboratory test for the level of parasitemia.
In addition, caution should be exercised in the generalizability of the findings to the entire Nigerian population given that data was collected from two states (one state each from the northern and southern regions) of Nigeria. Although the northern and southern regions in Nigeria differ in relation to important factors to malaria treatment (like educational level, climatic conditions), further differences also exist between the different states and ethnic groups within each of the regions in terms of socioeconomic and sociocultural practices. Nevertheless, this does not disprove the external validity of this study. With a rigorous and appropriate sampling method and adequate sample size, the findings of this study are generalizable to the study population (Abuja and Imo State).
The fact that the use of mixed drugs for malaria treatment drugs is socially patterned is the corollary of the determinant effect of socioeconomic factors on this behaviour. The adoption of such drug use behaviour will persist in malaria-endemic populations in the presence of a high rate of poverty. Indeed, the persistence of these behaviours can render artemisinin less effective in malaria treatment; thereby prolonging the morbidity and infectivity while increasing the mortality attributed to malaria infection.
With the persistence of high levels of poverty in malaria-endemic countries like Nigeria and the relatively high cost of the first-line treatments for malaria (ACTs), the prevalence of detrimental drug use behaviours like the use of mixed drugs, will continue to be skewed to the disadvantage of those at lower levels of the socioeconomic gradient. To protect the efficacy of antimalarial drugs, like artemisinin, efforts should be made to address the clustering of the resistance-promoting drug use behaviours like mixing of drugs among the socioeconomically disadvantaged groups. There is a need for malaria control programs to incorporate strategies geared towards improving the standard of living, access and availability of good quality healthcare services in under-served areas in malaria-endemic countries. As the practice of mixing is relatively new in malaria literature, to explicitly understand its impact on malaria treatment and control, there is an urgent need for more studies on various aspects of this practice, such as the interaction of the drugs used in the mixture.