Structural and Optical Characteristics of Cu Doped Sno2 Nanostructures
Copper doped tin oxide nanostructures were prepared by sol-gel method. Before that tin oxide and copper nanoparticles were synthesized using sol-gel and their structural and Optical properties were studied. The XRD analysis reveals that the Cu doped SnO2 nanoparticles. The crystallite sizes were also calculated. It has been proved from optical absorption measurements by FTIR that the nanometric size influences the energy band gap.
Keywords: Cu; SnO2; Sol-gel; Optical; Structural
Metal oxide nanoparticles have wide applications, primarily in the technology field, including their use as a semiconductor, electroluminescent or thermoelectric material, but they are also used in biomedical applications as drug delivery systems for treatment and diagnosis and in environmental decontamination applications. The classical methods for obtaining metal oxide nanoparticles are based on chemical and physical techniques that employ hazardous and expensive chemicals with high energy input and a negative effect on the environment. The production of metal oxide nanoparticles via biogenic synthesis has received increasing attention recently because it is a novel process for the development of engineered materials. Biogenic SnO2 nanoparticles demonstrated antibacterial activity against E. coli and antioxidant properties, as assayed by scavenging the free radical of 2, 2-diphenyl-1-picrylhydrazyl hydrate [1]. These particles demonstrate biomedical applications. Cu concentration on the SnO2 affects the sensibility which is not investigated as Nano sensor in the literature.
Before going to study about about copper doped tinoxide nanostructures, copper and tinoxide nanoparticles are prepared and their structures are studied. The synthesis of Copper nanoparticles by mixing 4 gm of CuSO4 to 0.9 gm of polyvinyl pyrolidone after 1/2 hr stirring and keeping at 50 °C for 30 min. Then 2.5-3 ml hydrazine hydride was added dropwise. Colour changes observed from blue to copper. After that kept for stirring for 2 hrs. The synthesis of SnO2 nanoparticles is started with one gm of stannous chloride dehydrate SnCl2. 2H2O in a mixture of 11 ml deionized water and 5 ml carbanol in a beaker and stirred for one hour. Later 1 ml of HCl is added dropwise. After 1 hour, solution is fixed at PH=11 by dropwise to the above solution. This solution is stirred for 2-3 hrs at 80 °C. The Cu doped SnO2 nanopowder is achieved by adding dropwise solution of CuSO4 while stirring in the above solution. All the prepared nanoparticles are annealed at 600 °C [2,3].
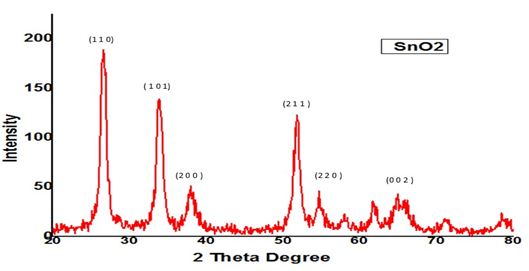
The structural characterization was performed using X-ray diffractometer (type Bruker Advance-D8 with CuKα 1.54 A°) .XRD revealed that powder formed is tin oxide which is an n-type semiconductor with a crystal structure of tetragonal lattice and a wide band gap of 3.6eV. This plays prominent role in surface acoustic wave gas sensors (Figure 1 and 2).
The miller indices (1 1 0), (1 0 1), (2 0 0), (2 1 1), (2 2 0) and (0 0 2) for pure SnO2 XRD confirmed that the powder formed is FCC nano copper
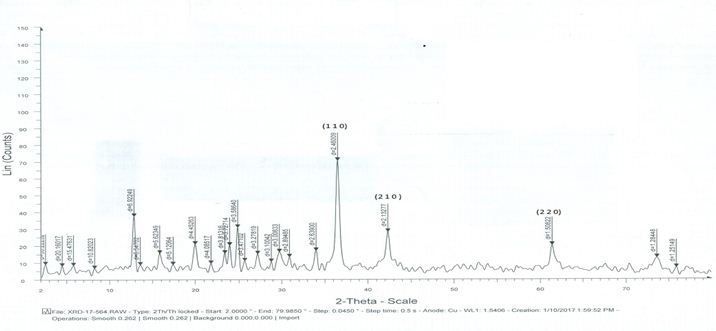
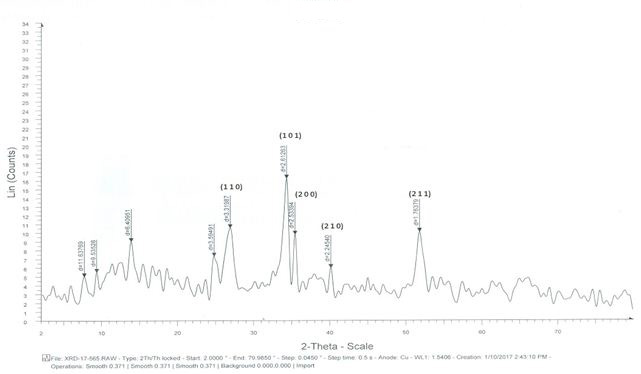
The XRD of Cu doped SnO2 samples are shown above [4]. Using the inter planar distance values, their corresponding miller indices have been identified and located in Figure 2 and 3. It is clear that the Cu2+ions are acting as dopants in the SnO2 structure. For tin oxide, suitable crystal face orientation is (1 1 0). Tin forms an interstitial bond with oxygen and exists either as SnO or SnO2, which has valency +2 or +4 respectively. During the process, the Cu substituted on Sn4+ sites act as dopants and releasing excess electrons into the conduction band. Thus the band gap decreases with the addition of Cu. The mean crystallite size was calculated by Debye-Scherrer’s formula D=Kλ/βcosθ where K is a grain shaping factor 0.9, λ is the wavelength of the incident Cu-Kα beam, θ is a Bragg’s angle and β is the full width at half maximum. It is observed that the crystallite size of copper doped tinoxide nanoparticles have less crystallite size (Table 1).
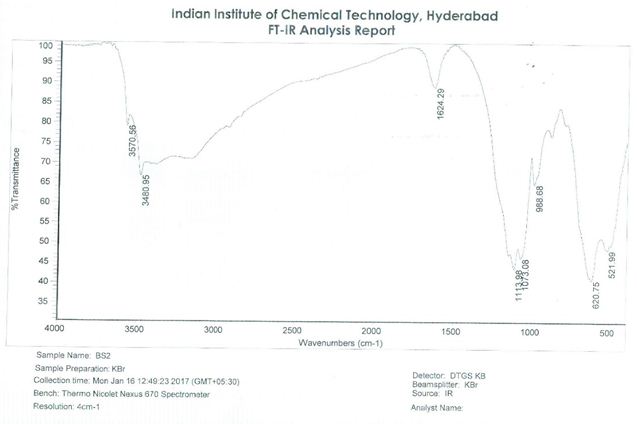
From the above spectra it is clear that the variations indicate that Copper has incorporated in SnO2 host lattice. The absorption peak at 521.99/cm and 3670/cm arises from the bending variation of Sn-O-Sn. At 3480.95/cm the sample shows the broad band which is due to the stretching vibration of surface hydroxyl groups. This is most likely due to reabsorption from the ambient atmosphere. The peak appeared at 1624.29/cm and 620.75/cm gives the bending mode of OH bonds (Figure 4).
In this paper, copper, tin oxide and copper doped tin oxide nanostructures were synthesized by the sol-gel method. The structural and optical properties using XRD and FTIR were studied. Further, there is a scope of study of other properties like conducting, other morphological properties and the sensing applications.