The Effect of Computer Guided Occlusal Adjustment on Radiographic Outcome and Masticatory Efficiency of Implant-Supported Overdentures
Objective: The objective of this study was to evaluate the effect of digital occlusal adjustment on the radiographic outcome and masticatory efficiency of mandibular implant-supported overdentures.
Material and Methods: Fourteen edentulous male patients were selected for this study. Four implants were inserted at the interforaminal area for all patients as guided by preoperative cone beam computed tomography (CBCT). After three months of ossteointegraton period, all patients were recalled for denture construction and loading the implants with ball & socket attachments. Patients were divided into two groups: Group I received their dentures after occlusal adjustment by selective grinding method using articulating paper only, while group II received their dentures after an additional step of occlusal adjustment using the T-scan III before articulating paper. Patients were recalled for follow up at 1 week, 6 months and 12 months to evaluate bone loss, bone density differences and the masticatory efficiency using ViewGum® software. Two Trident® chewing gums of different colors were asked to be chewed by the patients for 5, 10, 20, 30 and 50 cycles. The specimens were flattened, scanned and uploaded to the View Gum software for analysis. The data of this study were collected, tabulated and statistically analysed by V.22-SPSS statistics software.
Results: There were significant differences in bone loss around the implants during the follow up period which was less with dentures underwent occlusal digital adjustment than using articulating paper only. The bone density from the 1 week baseline showed to be increasing in the T-scan III group (Group II) but insignificantly except at the distal and mesial surfaces of both implants at the premolar area compared to their counterpart in the other group. Regarding the ViewGum analyses, 20 chewing cycles showed to be the most reliable cycles test as it was the only test producing realistic results. Accordingly, T-scan III group (Group II) showed less variation of hue value which indicates higher degree of homogeneity of both gums colour and better of mixing ability.
Conclusion: T-scan III aided significantly in the process of occlusal load distribution which resulted in less marginal bone loss, more bone density gaining around the implants and better mixing ability of the food intake which enhance the masticatory efficiency.
Keywords: T-scan III; Implant Overdenture; View Gum
Edentulism is currently one of the most common dental conditions occurring among our patients especially the elderly people. Treating edentulism was proven to solve a major daily life problem to our patients and aid in improvement of their oral health quality of life. Treatment modalities include surgery to augment the alveolar ridge or increase vestibular depth, dental implants to provide anchorage for all implant supported prosthesis or mucosa and implant supported overdentures [1,2].
Osseointegration is a complex process and involves numerous factors. These include implant-related factors, such as material, shape, topography, and surface characteristics, mechanical loading, surgical technique, and patient variables such as bone quality and quantity [3,4].
Presurgical assessment of implant site by CBCT imaging technique thus allows for the accurate assessment of the amount of bone volume available, bone density, and proximity to anatomical structures [5-8].
The occlusion is the most critical component of implant prosthodontic. When occlusal factors are not properly controlled, bone loss, fracture of the prosthesis or failure of the implant may occur. Thus, the occlusal performances of an overdenture are more similar to a fixed prosthesis than a conventional denture. So that, the occlusion for the tissue-borne overdenture should include multiple bilateral, even contacts in centric relation and eccentric positions for proper distribution of force [9-12].
It has been speculated that occlusal load from excessive lateral loads arising from premature contact may cause bone loss and implant failure. Prior to the evaluation of occlusion on implant reconstruction, it should be evaluated and all occlusal prematurities should be eliminated during maximum intercuspation and centric relation [10,11].
Articulating paper has been established as the most commonly used diagnostic tool to identify contact points between the maxillary and mandibular teeth. The paper can readily highlight occlusal contacts, but cannot accurately quantify their intensity and measure the magnitude of the generated occlusal forces. The size of the mark area on the articulating paper is representative of how heavy the occlusal load is [13-15]?
To avoid the subjectivity in the interpretation of the articulating paper markings dental research introduced the T-scan computerized occlusal analysis system. Kerstein, et al. consider the T-scan III system to be a highly accurate technique to study and analyze the occlusal and articulation relations [16].
Masticatory efficiency can be evaluated by masticating a two-colored gum samples for a given number of chewing cycles and the resulting bolus is evaluated either visually on a reference scale or opto-electronically. These techniques evaluate both the color-mixing ability and the capacity to form a bolus [17,18].
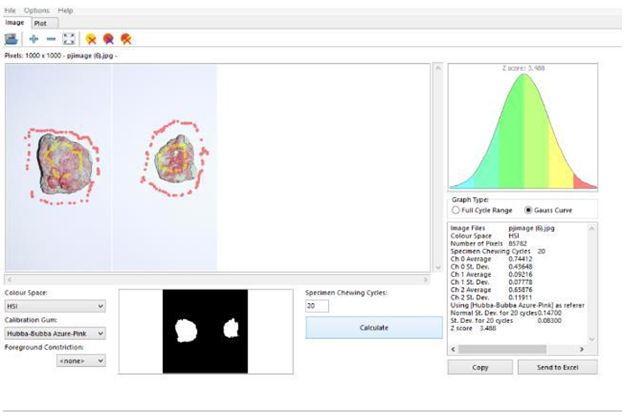
The specimens are folded and scanned from both sides with a high-resolution scanner or camera. The scanned image is copied into an image of fixed size and stored in JPG image form. Images are then uploaded on the ViewGum for the electronic assessment of the mixing ability of both chewing gums together giving a variance of hue (VOH) value [17].
The aim of this study was to evaluate the effect of computer guided occlusal adjustment of the implant-supported mandibular overdenture on marginal bone loss rate around the implants, bone density difference around the implants and masticatory efficiency evaluation using chewing gum mixing tests.
Fourteen edentulous male patients with age ranging from 45-60 years old were selected from the outpatient's clinic of the Prosthodontic Department, Faculty of Dentistry, Tanta University.
1. All patients were totally free from any systemic diseases that might cause unusual bone resorption or delayed healing.
2. The pre-measured and assessed bone height and width were acceptable for the selected implant length and diameter at the predicted implant site with cone beam computed tomography (CBCT) [19].
3. All patients were with class I Angle classification with sufficient inter arch space.
4. Good oral hygiene was confirmed.
1- Patients with parafunctional habits, (e.g: Clenching and bruxism).
2- Heavy smokers.
3- Patients with TMJ disorders.
4- Unco-operative patients.
1- Clinical visual and digital examination was done for the upper and lower ridges.
2- CBCT was done
3- Diagnostic casts were made for each patient
An acrylic conventional complete denture was fabricated for each patient using conventional technique. The finished mandibular denture was duplicated in two sections (top and bottom) polyvinyl siloxane flask using clear autopolymerized acrylic resin. The duplicated denture was then finished and polished into the finished surgical stent. Four radio-opaque landmarks using Gutta Percha inserted in the holes that was drilled at both premolar areas and both lateral areas. Holes containing Gutta Percha was sealed with pink wax. After CBCT examination, window-like openings in the areas of the proposed implant sites were done to aid in bone drilling procedures using #4 SL surgical round bur.
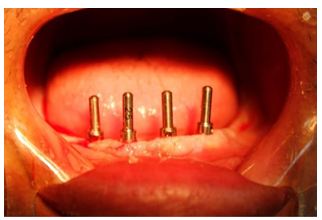
For each patient, four BioHorizons (Birmingham, AL, USA) implants of two pieces with 3.4 mm diameter and 12mm length were inserted at the interforaminal region with flapless technique to decrease the amount of the initial crestal bone loss with conventional flap technique (Figure 1).
Patients were recalled after 3 months of osseointegration. The cover screw was removed and the ball abutment was screwed into the fixture and firmly tightened with torque wrench at 30 Ncm. Direct pick up procedure by relieving areas of the fitting surface of the denture over the implant sites and were filled with self-cure acrylic resin. The denture was seated, and the patient was instructed to bite gently on it during the setting of the acrylic resin. After the resin sets the denture was removed and the metal housing inside the denture was examined. Mis-seating of the housing was expected so proper saeing of the housings were ensured. Engaging the acrylic resin to the ball abutment undercut was prevented by blocking with pink wax.
Selective grinding step was performed intraorally with ordinary articulating paper method with double sided Full arch articulating paper (Bausch®, Nashua, USA) with 40 microns thickness.
Selective grinding step was performed intraorally with ordinary articulating paper method besides checking the center of force (COF) and trajectory line by the T-scan III (Tesco, South Boston, USA).
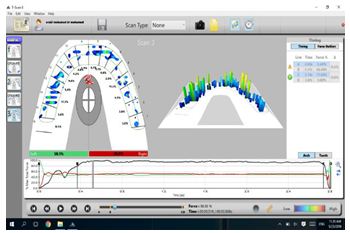
The occlusal forces was observed within the T-scan III desktop , which is organized into four panes; the 3-dimensional column view (upper right pane; force levels illustrated by color-coding and column height), the 2-dimensional contour view (upper left pane; force levels illustrated by color-coding and occlusal surface location) that houses the COF trajectory, its red and white diamond-shaped icon, and the white/gray COF ellipse, (the ellipse is a target that assesses overall prosthesis force balance), the force versus time graph (lower left pane) and the zoom graph (lower right pane) (Figure 2) [16].
Each patient was obtained a personal custom made bite sensor which can be fixed in the handle controller. Each bite block was solely used for each patient as it is disposable and can't be sterilized.
All CBCT images were scanned at the same imaging apparatus (Soredex®, Tuusula, Finland) with 15 mA, 15 kV, 40-second exposure time and isotropic voxel size of 0.25 x 0.25 x 0.25mm.
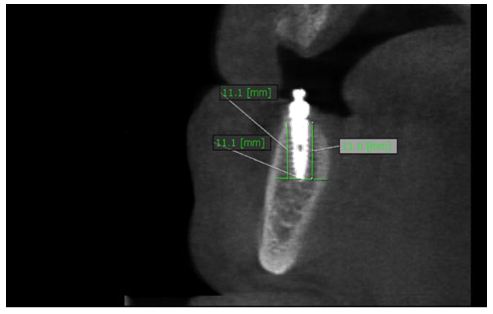
Evaluation of the marginal bone loss around all the implants and the using the linear measurement system supplied by the CBCT (Figure 3). The marginal bone height around the mesial, distal, buccal and lingual surfaces of the implants were evaluated for both groups, using the linear measurement system of the software (Ondemand 3D®, Cybermed Inc, Finland (with flat panel detector supplied by the CBCT. The marginal bone changes at different intervals were obtained by calculating the difference in bone height at that interval from the base line measurement at one week from loading the implant [20].
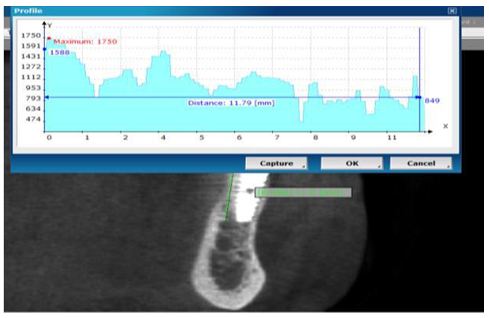
Ondemand 3D software contains the profile icon that will be used to measure the bone density around the implant buccally, lingually, mesially and distally (Figure 4). The profile icon releases a line that is drawn along the implant from its apex till the cervical end of the implant. A Hounsfield unit scale is drawn resulting in the numbers illustrating the bone density around the implant. Three values were taken from the scale which were at the cervical end (the top end of the implant), middle point (half the distance of the implant at 6 mm point) and the apex end (the bottom end of the implant). The bone quality changes at different intervals were obtained by calculating the difference in bone density at that interval from the base line measurement at 1 week from loading the implant [21].
Group I and group II were subjected to the masticatory efficiency test using Trident® (Mondelez International Inc, Turkey (chewing gums. Watermelon (pale red) and spearmint (light green) were used. Patients sat upright and chewed both gums for 5, 10, 20, 30 and 50 chewing cycles, respectively. The chewing cycles were counted by the operator. Between each chewing sequence a pause of 2-3 seconds was respected. The specimens were then retrieved from the oral cavity and subsequently flattened to be scanned.Both sides images were added to one jpg image. The image was uploaded to the ViewGum for analysis (Figure 5). Statistics were transferred to an excel file for statistical comparison of the variation of hue of each image which shows the degree of color homogenicity of the two gums and indicate the mixing ability. Patients from both groups were recalled every 1 week as a baseline, 6 months and 12 months to compare the chewing mixing ability of the two gums after 5, 10, 20, 30 and 50 chewing cycles.
All data from clinical and radiographic evaluation were collected, tabulated and statistically analysed using SPSS (Statistical Package for the Social Sciences) software version.22 package system. ANOVA test was used to find out significant differences between variables tested, T test was used to compare the two tested groups then Tukey test was performed if need. The level of significant was tested at 0.05.
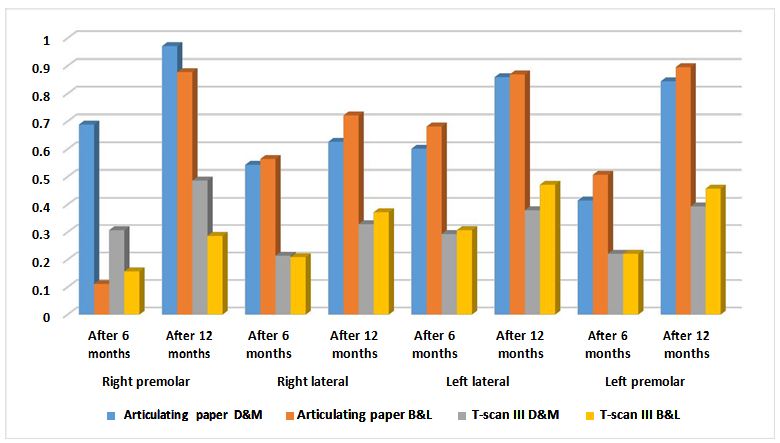
Both articulating paper group (Group I) and T-scan III group (Group II) showed significant bone loss from 6 months to 12 months except the sum of distal and mesial sides and the sum of the buccal and lingual side in the left lateral premolar of the T-scan III group (Group II). Comparing bone loss from the 1 week to up 6 months between both groups, T-scan III group (Group II) showed less bone loss than the articulating paper group (Group I) but with no statistical significant differences except in in the sum of the buccal and lingual sides of the right premolar implant. After 12 months of denture insertion comparing the bone loss rate from the 1 week baseline results in between both groups, bone loss showed to be less in the T-scan III group (Group II) than the articulating paper group (Group I) in all implant surfaces with great statistical significant differences (Table 1).
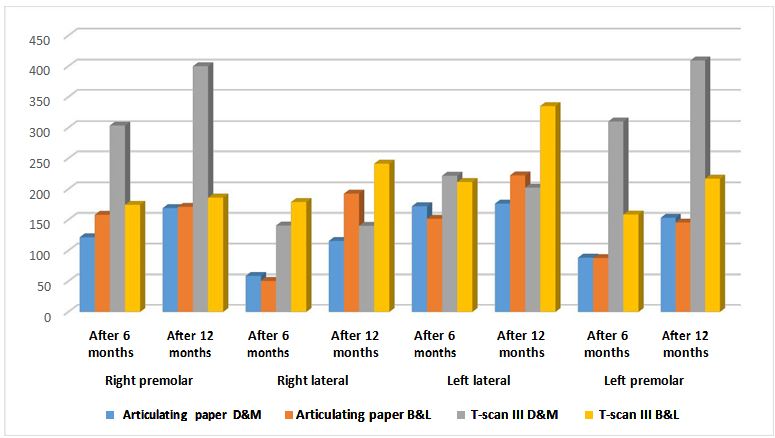
In Table 2 and Diagram 2, Comparing the bone density mean difference from the 1 week baseline to 6 months results between both groups, bone density showed to be more in the T-scan III group (Group II) than the articulating paper group (Group I) at most sides group but with no statistical significant differences except in the sum of the distal and mesial sides of the right premolar implant and the left premolar. After 12 months of denture insertion comparing the bone density difference from the 1 week baseline results in between both groups, bone density showed to be more in the T-scan III group (Group II) than the articulating paper group (Group I) at most sides group but with no statistical significant differences except in the sum of the distal and mesial sides of the right premolar implant and the left premolar.
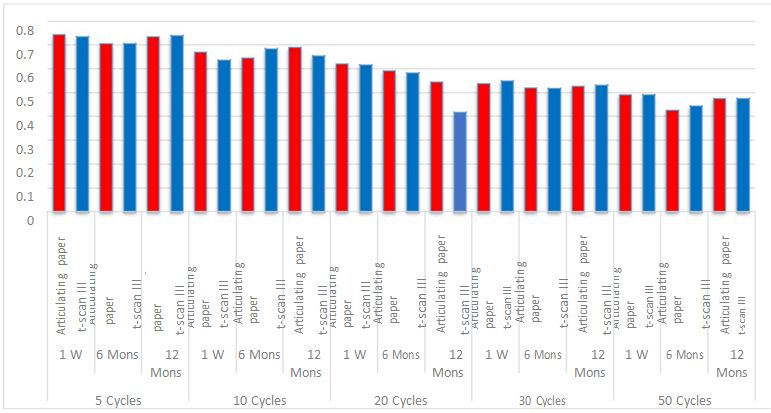
Table 3 and Diagrma 3 show that at 5 cycles and 10 cycles, no statistical significant differences were resulted at 1 week, 6 months and 12 months. At 20 cycles, VOH mean value was less in T-scan III group (Group II) than articulating paper group at (Group I) 1 week, 6 months and at 12 months. No statistical significant differences were resulted at 1 week, 6 months, however at 12 months, a statistical significant difference was recognized. At 30 cycles and 50 cycles, no statistical significant differences were resulted at 1week, 6 months and 12 months as well.
It was proven that during denture insertion, we can conduct the procedure of occlusal adjustment accurately using articulating paper with the aid of the T-scan III. Our study was able to confirm the great benefits of the T-scan III and its manual usage .When the software and the sensor were used in a right way, registering occlusal contacts showed high accurate display of the contact points on the teeth measuring the force and the time on occlusion [22].
The bone height loss was obvious and monitored carefully around the four implants in all the fourteen patients. Significant bone loss was observed from 1 week, 6 months till 12 months. As reported by previous study carried out by Pozzi, et al. Blahout, et al and Chung, et al. this may attributed to the routine bone loss following implant insertion as a natural response of the bone in addition to the surgical procedure and the forces applied on the implants throughout the whole year [23-25].
This opinion is supported by Darwish, et al. and Manfredini, et al. who reported that many factors can be implicated in the reduction of bone around dental implants [26,27]. These include surgical trauma during drilling, forced tightening of implants upon installation, covering the gingival margins around the implant, excessive functional and masticatory forces upon the implants, and faulty prosthetic superstructure.
The significant differences of the marginal bone loss in each group are also strongly related to an important feature in two piece implants. The microgap at the implant abutment junction provides bacteria with an open channel to penetrate into the implant system and also allows for micromovement of the abutment within the implant. This micro movement further creates movements and stresses on the abutment screw, which cause a loosening and micropumping effect that expels additional bacterial byproducts and toxins at implant soft tissue interface and eventually at the osseous crest [28-30].
Comparing both groups regarding the amount of marginal bone loss, significant reading that proved less bone loss rate in the T-scan III group (Group II) than the articulating paper group (Group I) after the whole 12 months of follow up.
These results confirmed previously by Hsu, et al. and Mahrous, et al. studies and results that accurate occlusal adjustment is paramount after a 1 year functional loading study on implant-supported overdentures [20,31]. They stated that occlusal overloading was thought to be the primary etiologic factor in biomechanical implant treatment complications, which commonly included marginal bone loss, or denture base fracture of implant-supported overdentures, loosening or fracture of abutment screws.
The bone loss rate in the T-scan III group (Group II) showed to be less with nearly equal rates around the 4 implants at buccal, lingual, mesial and distal sides. However, mesial and distal sides of the right implant placed at the premolar area of articulating paper group (Group showed to have the greatest amount of bone loss followed by the distal and mesial surfaces of the left implant placed at the premolar area of the same group which had significant rates too.
Significant values were resulted when comparing the implants placed in the same area in both groups for bone loss monitoring. The greatest significance appeared on most of the implants after 12 months, however there were some significant results after 6 months in some surfaces. Schincaglia, et al. Verma, et al. and Hsu, et al. reported that 12 months were the most appropriate time to asses and compare bone changes around the implants regarding the bone density measurement using CBCT, readings tended to increase significantly from 1 week, to 6 months and up to 12 months in both groups [31-33]. The most obvious increase was showed to be at 6 months. This was also reported by Temizel, et al. in their studies when they measured the bone density using Hounsfield units as it was applied in our study [34]. They confirmed that successful implants tend to acquire more bone minerals around the implants especially after 6 months of functional loading.
Comparing each implant placed in the same area in both groups, bone density tended to increase in the T-scan III group (Group II) more than the articulating paper (Group II) especially in the sum of mesial and distal surfaces of the right and the left implants placed in the premolar area.
These findings agree with the findings of the study performed by Li, et al. that concluded that the most areas that receive stresses in the implant-supported prostheses were the distal neck of the most distal implant [35]. Bone deposition occurs in these areas if the forces were within the bone remodeling threshold. If forces exceed the bone remodeling threshold, some bone resorption can occur. Therefore, accurate occlusal forces distribution is crucial for applying forces within the bone remodeling threshold to preserve the best peri-implant bone density.
The results of this study revealed that, T-scan was able to achieve accurate occlusal adjustment of the dentures resulting in a static coordinated occlusal contact of maximum number of teeth during maximum intercuspation leading to a simultaneous and equally distributed marginal bone loss around the implants preventing uneven forces and uneven bone loss in certain areas. It also aided in increasing the bone density and its stability around the implants preventing uneven forces and bone resorption reaction in certain areas.
Using ViewGum for the masticatory efficiency evaluation, the cycles were used as a factor to compare the variation of hue of both chewing gums in all the patients. Procedurally, the 50 chewing cycles showed the less amount of variation of hue (high homogencity of the hue). This fact was supported by Schimmel, et al. who said that the number of chewing cycles are inversely proportional with the variation of hue [17].
Focusing again on the number of cycles, the 20 cycles test seemed to be the most reasonable amount of cycles which can used for comparison. At 20 cycles, data seemed to become realistic. At the other chewing cycles, results tended not to show non-uniform pattern in the variation of hue from 1 week till 12 months. In the T-scan III group (Group II) and the articulating paper group (Group I), all the number of chewing cycles tests results confirmed the 20 cycles test can be the most reliable test for comparing both groups.
This fact was also confirmed by Schimmel, et al. who mentioned that the visual assessment scale was moderate to almost perfect at 20 chewing cycles while using their weighted kappa statistics [17]. Schimmel, et al. in another study confirmed the same fact which slight or moderate inter-examiner agreement was found for specimens chewed for five or 10 cycles, but moderate to substantial agreement occurred in the specimen which was chewed for 20 or 30 cycles [18]. All specimens who were chewed 50 times we judged as nearly the same variance of hue in all patients. For the examiner agreement, the 20 cycle specimens showed narrower confidence intervals than the 30 cycle samples.
Regarding the time factor in all patients at 20 cycles test, the variation of hue tended to decrease from 1 week till 12 weeks uniformly. In agreement with Muller, et al. test results confirmed this phenomenon that patients with mandibular implant-supported overdenture tend to acquire thicker and stronger masseter muscle than conventional denture wearers by time [16]. Masseter muscle in mandibular implant-supported overdenture patients provide more efficient mastication considering the time for complete muscle adaptation.
Comparing patients of both groups at 20 cycles test, at 1 week there were no significant differences and also after 6 months. After 12 months, significant differences were reported and T-scan III group (Group II) showed to have better mastication of both chewing gums with less variance of hue. A strong correlation can be documented with studies carried by Muller, et al. [16]. It was mentioned before the time factor in increasing the thickness of masseter muscle and its activity after muscle adaptation, in addition to the type of implant-supported prostheses confirming a proper occlusion in the prostheses can contribute to a better muscle of mastication performance and long term activity.
Based on the results of the present study, it was concluded that accurate occlusal adjustment using T-scan III aided in more forces distribution leading to less bone loss rate among particular areas in the marginal bone. T-scan III was also an important factor in causing increased bone minerals formation with less bone resorption rate as the forces applied didn’t exceed the bone remodeling threshold. Occlusal adjustment using T-scan III enhanced the performance of muscles of mastication leading to better masticatory efficiency.
Further researches and clinical trials over a longer period of time are needed to determine the long-term effect of T-scan III occlusal adjustment on mandibular implant-supported overdentures as a way to control marginal bone loss and to increase bone quality around the implants in addition to the ability to enhance the masticatory performance.