The Impact of Using Social Media Networks on Dental Treatment Marketing in Saudi Arabia: The Practitioners and Patient’s Perspectives
Introduction: With an increased ingress in the employment of social media for health communication, all over, in medical services settings, it is sensible to fundamentally depict the all-inclusive peculiarity of internet-based life. Hence our study aimed 1) to assess the patients and practitioners use of social media networks and to investigate the potential benefits of social media in marketing and communication strategies in dental practices among the Saudi market 2) to determine the preferable social media platform as well as posts contents for both (patients and practitioners).
Methods: Two matched surveys (questionnaires) were developed by Survey Monkey. One was directed to the practitioners (Consultants, GPs, specialists as well as clinical year students) and the other one directed to the patients to explore the use of social media in dental practices on many levels. Dental practitioners were asked to answer questions related to their use of social media and patients were asked about their perceptions of the use of social media in the dental practice.
Results: More than half of the dental professionals were females (54.9%) and practicing general dentist having less than 5 years of experience (27%). In addition, most of the dental professionals (89.4%) said that social media is the most important means of advertisement for attracting patients. Similarly, (82.3%) of the patients mentioned that advertisement in social media makes more patients visit dental clinics. When enquired about the commonly used social media platform, a majority of the dental professionals (23.6%) said Twitter and Instagram were the commonly used social media by the patients (45.5%).
Conclusion: Social media had become a commonly used marketing strategy in the dental practice especially for sharing and getting information's as well as to attract new patients. Females were more interested to use social media; Instagram was the most commonly used platform among patients while the practitioners used Twitter. Governmental practitioners were more interested to use different social media platforms in dental marketing than private ones. Photographs and videos of personal work were the most preferable type of posts among dental practitioners while awareness posts were most preferred by the patients.
Keywords: Dentistry; Marketing; Social Media
With a spiraling ingress in the employment of social media for health communication, the world over, in health care contexts, it is practical to primarily delineate the universal distinctiveness of social media [1]. Social media can be defined as online technologies and practices that people use to share opinions, experiences, and perspectives with each other, as a new way of communication that uses the internet to link people from all over the world whether by using computers or smartphones [2, 3]. However, the technology of social media involves the collaboration and interaction of many users, most of these interactions happen online via audio, visual and textual content, it involves a sense of community, rather than individuals and has made it through all the hardships of distance, lack of knowledge, and lack of resources. In modern societies, most providers of professional services compete for consumers, and dental health care services are no exception. Many social media tools are available for health care professionals, including social networking platforms, blogs, microblogs, wikis, and media-sharing sites. These tools can be used to improve or enhance professional networking and education, organizational promotion, patient care, patient education, and public health programs [4].
The use of newer communication technologies continues to exponentially increase, the health practitioner will inevitably expand out from the ‘old' media (TV, radio, billboards) and into the ‘new' (mobile telephones, social networking sites) [4]. However, the use of social media and social networking sites has become increasingly common by the current generation people [5].
The prologue of social media has brought a revolution in the way people interact through the social Web [4]. With the use of social media so frequent, it is not astonishing that hospitals, doctors, and other healthcare professionals are using social media to connect market, and communicate with their patients. Of late, dentistry has shown an interest in using social media to communicate and market to its patients. Coming into the world of social media is a taxing task that should not be taken frivolously. There are many ethical and legal issues associated with the use of social media in health-related fields [6]. The benefits of social media marketing are at present seen in the field of healthcare and social media as a chief tactic in dental marketing. Social media marketing is a cost- efficient way to reach hundreds of prospective new patients who search for a practitioner's services and proficiency [5].
Marketing can be a purpose, which a dentist uses social media for [6]. The purpose of healthcare marketing is to learn and understand the needs and desires of prospective patients in order to be able to meet those necessities at the highest standards. However, the benefits of social media marketing are currently seen in the field of healthcare and social media a major tactic in dental marketing. Social media marketing is a cost-effective means to reach hundreds of potential new patients who seek a practitioner's expertise and services [7,8]. In dental practice, social media can be used to communicate with patients, improve their knowledge, establish a reputation, and attract new patients. Social media can be taken as a modern word of mouth. Whatsoever occurs around us will soon emerge on social media. Through a wide variety of word-of-mouth messaging techniques such as recording voices and sharing live videos on different platforms can help the patient to see and hear the doctor at the same time [9]. However, Marketing can play a role in the retail industry, its primary purpose being to present products or services to potential consumers in a manner that increases their desirability [3]. This applies to dental practitioners, which can be regarded as a discretionary service. The main ways of acquiring dental patients are through patient referrals, staff referrals, and visibility through community involvement, offers by advertising, and insurance sources. Although the impact of social media in health care has been described, the literature on its use in Saudi Arabia is limited [10,11].
Advertising can provide relevant information and can foster communication between providers and recipients of a service. Advertising also transmits news of innovative technology and can stimulate demands and markets for new and existing services. Patients can benefit from social media by looking up the best doctors of recommendation and online review. They can share their experience with doctors to be evaluated by others online. We can say that social media helps in directing the market and the medical field, especially when it depends on fame and attitude in the doctor-patient interrelationship [12]. Also, they can share their experiences with a broader and more attentive audience through a wide variety of word-of-mouth messaging techniques by using different social media platforms such as Instagram, Snapchat, YouTube, Facebook, and Twitter. However, social media also present some potential risks to patients and healthcare professionals regarding the distribution of poor-quality information, damage to professional image, breaches of patient privacy, violation of personal–professional boundaries, and licensing or legal issues naturally, they are also interested in using social media to facilitate communication between themselves and their providers.
This article will portray the impact social media has on today's health care setting while stressing on various opportunities and hurdles that exist. Based on the shortage of professional discourse in the dental education literature concerning the use of social media, this article will propose a need to start a close assessment of the uses of social media in the dental education community. The article concludes with the suggestions for further research to be taken to explore the legal and ethical issues of using social media in dental practices on implementing it as part of marketing strategies in KSA.
Ethical review and approval were obtained from the IRB (institutional review board of Riyadh Elm University, Riyadh, KSA (Registration no RC/IRP/2016/574). Two matched surveys (questionnaires) were developed by Survey Monkey. One was directed to the practitioners (Consultants, GPs, specialists as well as clinical year students) and the other one directed to the patients to explore the use of social media in dental practices on many levels. A total number of 1,280 respondents (865 patients and 415 dental practitioners) have participated in this study during 5 weeks' period of time.
A particular Gmail, Instagram and Twitter accounts were initiated under the research name to distribute the questionnaires. Official emails included the practitioners’ questionnaire link has been sent to all Riyadh Elm University staff members as well as other practitioners randomly throughout Saudi Arabia, in government and private institutions. Random practitioners were mentioned through different social media platforms to fill up the questionnaire. An official email has been sent through the Saudi Dental Society (SDS) to all the members. Well-known social media influencers contributed to distribute the links through Snapchat. Multiple dental clinics were visited for more data collection. The same method was used to distribute the patient link.
Each questionnaire consisted of brief explanation about the research and its purposes and 20 questions included (sociodemographic information’s, living region, income level, definition of social media along with many examples of social media platforms were gathered for all participants, questions related to the patients/participant’s usage habits and perceptions of social media, usage for marketing/communication or attract new patients for dental practice as well as the perspectives toward the preferable and most helpful type of posts). Moreover, patients were asked about their use of social media to look after their dentist, factors influencing the selection of dental practitioner and perceptions of media advertising by dental care professionals.
All the data obtained from the dental practitioners and patients were transferred to the statistical software. A descriptive statistics of frequency distribution and percentages were calculated for the categorical variables. Cross-tabulation and chi-square tests were performed to know the relationship between the use of different social media among dental practitioners and dental patients. For statistical purposes, a p-value ≤0.05 was considered significant. All the statistical analysis was performed using SPSS version 21.
A total of 415 dental health professionals and 865 of patients participated in the study in which responded to similar surveys between Nov.15.2017, and Dec.20.2017. Most of the practitioners belonged to the age group of 25-34 years (40.2%) from different regions in Saudi Arabia. More than half of the dental professionals were females (54.9%) and practicing general dentist having less than 5 years of experience (27%). In addition, more than half of dental practitioner worked in the government sector in the central region (58.1%)-(55.9%) respectively. Nearly, (43.4%) had a monthly income of >20000SAR. Similarly, sociodemographic factors of patients expressed in Table 1 and 2.
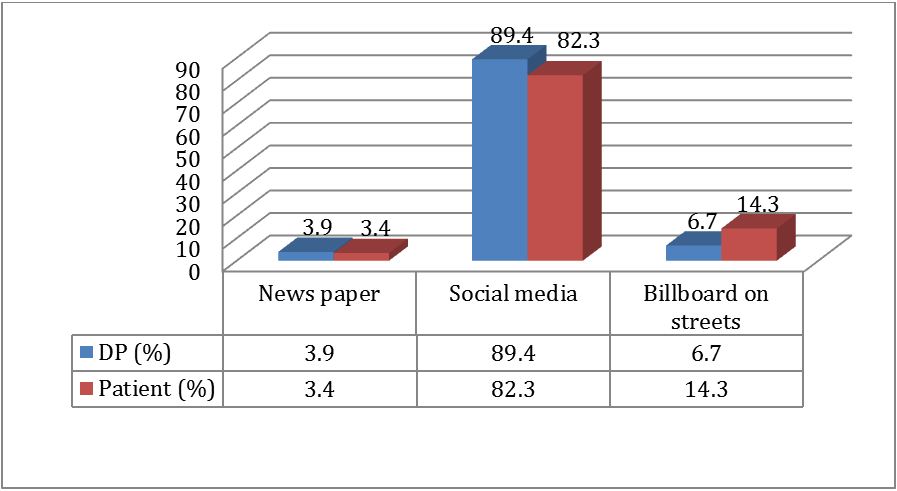
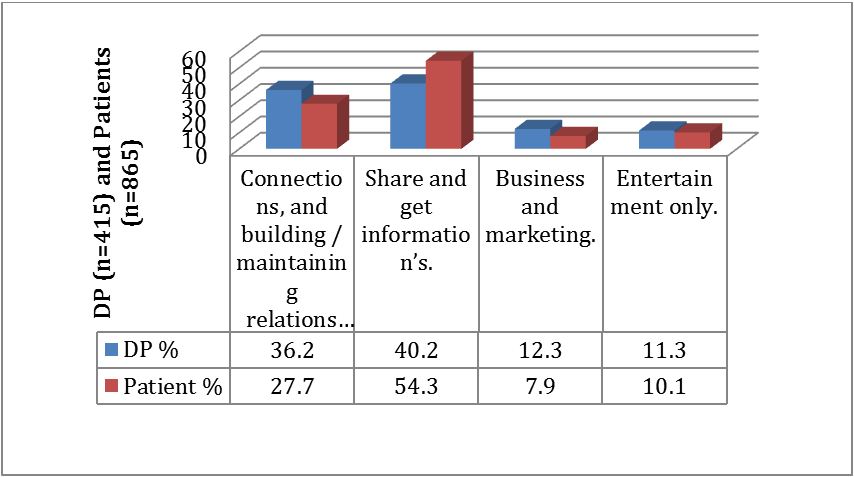
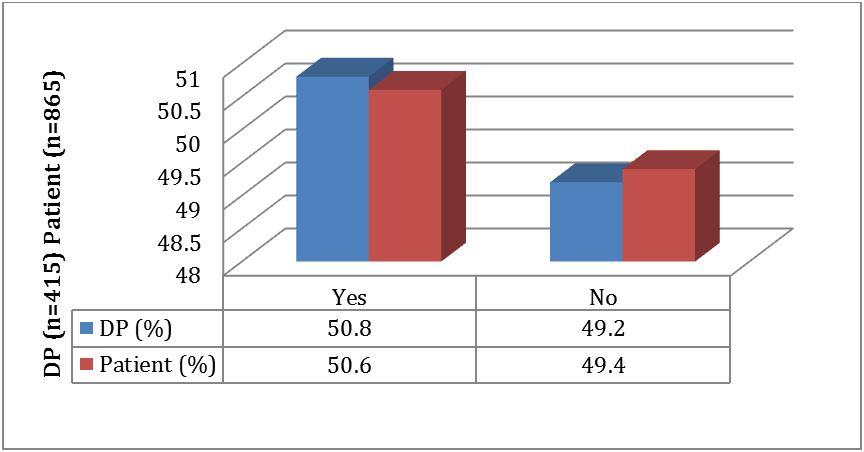
Most of the dental professionals (89.4%) said that social media is the most important means of advertisement for attracting patients. Similarly, (82.3%) of the patients mentioned that advertisement in social media makes more patients visit dental clinics, as shown in (Figure 1). Social media was the means of sharing and getting information for most of the dental professionals (40.2%) and patients (54.3%), as shown in Figure 2. More than half of the dental professionals (50.8%) and patients use social media (50.6%) as shown in Figure 3.
When enquired about the commonly used social media platform, a majority of the dental professionals (23.6%) said Twitter and Instagram were commonly used by the patients (45.5%). A significant difference was observed between government and private dental professionals (p ≤0.05) with regards the use of social media, as shown in Table 3. Similarly, a statistically significant difference was observed between male and female patients with regards to the use of different social media platforms (p ≤0.05), as shown in Table 4.
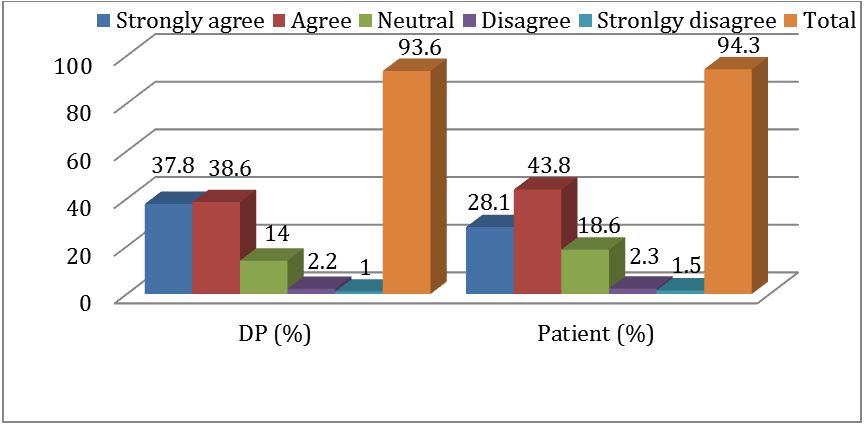
Nearly (38.6%) dental professionals and (43.8%) patients agreed that social media is used as a marketing tool as shown in Figure 4. Moreover, (46.3%) dental professionals, and (64.9%) patients mentioned that social media platforms could be mainly used for both marketing and community services. More than half of the dental professionals said that social media helped them to be more educated (54.9%), and a similar response was observed among the patients (66.7%) as shown in Table 5. Nearly (37.6%) of dental professionals clarify that sometimes they have the ability to answer the queries and consultation from their followers. On contrary, (72.7%) of the patients mentioned that they did not consult the dentist through social media, as shown in Table 6. Photographs and videos of personal work (40.3%) and dental awareness (40.3%) were the type of posts usually preferred by the dental professionals to share through social media. However, most of the patients prefer to utilize social media for dental awareness (41.2%) as shown in Table 7.
Nearly (75.9%) of the dental professionals spend less than 2 hours per day to share the posts on social media. Similarly, (80.3%) of patients spend less than 2 hours per day to review posts of dentists as shown in Table 8. Most of the dentists (34.9%) and patients (42.3%) viewed good reputation of the dentist is a factor that makes the patients visit the dentist for seeking care, as shown in Table 9.
Majority of the dentists (75.9%) strongly agreed with asking permission of their patients prior to sharing the photographs on social media. On contrary, most of the patients (31.8%) disagreed with giving permission to share their photographs on social media. About (43.9%) of dentists and (48.3%) of patients used an electronic website for dental booking an appointment. However, when asked about stopping the use of social media majority of the dentists (31.1%) and patients (41%) expressed their uncertainty as shown in Table 10.
Recently, social media has taken a significant role in healthcare as reported in numerous studies [10,11]. To our knowledge, this is the first study in the literature to report on social media usage and the perception of social media use in the dental practice among patients and practitioners in Saudi Arabia. Dental practitioners who wish to maximize their income potential must be capable to adapt to the shifting nature of modern dentistry as well as to changes in consumer demographics and attitudes. Effective marketing strategies are almost as important as good clinical skills in ensuring a successful practice. This study evaluated the factors consumers considered most important in their selection of a dental practitioner, assessed the patients and practitioners use of social media networks and investigated the potential benefit of social media in marketing and communication strategies in dental practices among Saudi market, and it also determined the preferable social media platform as well as posts content for both patients and practitioners, and the consumers towards social media usage.
The relationship amid personality characteristics and rendezvous with social media has been delineated. Gender is a factor in that outgoing men and woman are evenly expected to engage, but emotional volatility escalates the usage only for men [1]. In contrary, the results of the current study revealed that the majority of female patients (81.4 %) used social media when compared to that of male patients (18.6%). In a survey, Hanna Krasnova, et al. investigated how gender influences continuance intention to use social networking sites. They found that women are encouraged by the capability to sustain close ties and gain social information. And men are inspired by the skill to gain general information [13]. However, our results concur the study done in 2014, which reported that 79% of female patients use social media compared with 69% of male patients [14]. Also, the authors found 89% of adults between 18 to 29 years of age use social media and that usage decreased steadily with age, which is in agreement with our findings. The respondents, however, may have a social media platform without actively viewing posts. Thus, the difficulty in differentiating between a user and an active user may be viewed as a limitation to this study. Similarly, in the United States between 2006 and 2010, Lenhart and colleagues evaluated diverse types of Internet usage amongst young adults and teens. They found that the key swing in utilizing internet came at age 30 years with nearly twice the digit of teens and 18-29 years old using them as those 30 years and above (73% collated with 39%) [15]. Research by shivan et al. attempted to identify why elderly people do not use social media. They found that the elderly did not have the desire to personally connect themselves actively in technology to make use of the internet or social media due to physical and psychological hindrances related to age [16].
Over the years, marketing has been practiced via traditional means of media, such as television, billboards, pamphlets, radio, newspaper, and phone book ads. Social media marketing has allowed businesses to have more interaction with consumers. Many previous researchers have found that only 14% of people trust advertising compared with 78% who trust recommendations and referrals [17]. In 2015, Nelson, et al. found that 76% of the orthodontists used social media in their practice and about 89% of the patients/ parents are using it searching for a dental service [4]. In contrast, we found that the majority of practitioners/patients prefer social media as an advertisement attracting/ visiting patients to dental clinics respectively. Although, it is important to note that there is no proven cause and effect in the relationship between new patient’s start and the usage of social media. Moreover, engaging consumers on social media can build trusting relationships and give them an opportunity to read reviews from the general public. Nevertheless, successful practices usually have a more active presence on social media than any other marketing techniques.
In 2012 K Hanry, et al. found that the most common reasons for using social media were marketing (91%) and communicating with existing or prospective patients (73%) [6]. In the present study, dental practitioners and patients agreed to define social media, by communications and building relationship tool for sharing and getting information more than business, marketing, and entertainment. Social media helped (54.9%) of the practitioners and (66.7%) of the patients to improve their communication skills.
In a study, it was found that around 61% of adults in the United States explore online and 39% use Facebook for health information. While about 22% of Norwegian hospitals use Facebook, and 45% of Norwegian and Swedish hospitals are utilizing LinkedIn for health communication [18]. Marketing research has revealed that Facebook is the most popular used site [19]. In our results, dental practitioners preferred Twitter/ Instagram while patients preferred Instagram/ Facebook platforms respectively. Nelson, et al. showed that the different media platform among orthodontists, Facebook (74.6%) was the most commonly used platform, followed by YouTube (29.1%). Similarly, in another study, patients and parents used Facebook (80.3%) more than any other site, followed by YouTube (49.5%) and Pinterest (49.5%) [4].
Comparing the government and private sectors, practitioners in government institution showed significantly more use of social media platform. Interestingly, in a study done in Kuwait revealed that government hospitals are behind in adopting and maintaining well-designed websites [20]. Several researches have revealed that electronic communication enhances patient satisfaction by escalating the time spent communicating with and having queries answered by their doctors [21]. In the current study, the average time spent on sharing and reviewing posts for a business on social media website seems to be reasonable and not more than 2 hours per day and about 36.6% of the practitioners showed the ability to answer their followers' questions. In a study, Ventola et al noticed that about 60% of physicians were interacting with patients through social media for health monitoring and giving patient education [22]. In the present study, we noticed that the majority of the patients (72.7%) did not show much interest in consulting the dentists via social media. In contrast, 56% of the patients at an outpatient family practice clinic wanted their doctors to use social media for reminders, for fixing appointments, for prescription notifications, for diagnostic test results, and for answering general questions [23].
Type of posters may play an important role related to the preferences to share and find a dental practitioner through social media. Nelson, et al. discussed a statistically significant difference between the picture of patients, pictures of the orthodontist, information explaining new products and procedures, updates about the office, and involvement of the orthodontist in charitable programs and community service events [4]. Shuman and Friedman showed that patients’ appreciation was the most type of information communicated by practices via social networks [24]. However, in the current study, there was no discrepancy between practitioners and patients in the preferable posts to be sharing, in which, both of them preferred dental awareness posts, as well as photographs and videos of the procedures done rather than dental offers. Many previous researchers suggested that dental practices will be more successful with a strong online presence [7,25]. Also, recommended that the use of social media platform had become a standard for a dental practice to function nowadays [6] The outcomes of our study support these suggestions as they showed that most practitioners/ patients agreed to use electronic websites for dental appointment booking which may facilitate their practice management.
The role of social networking in the admission process is also subject to legal and ethical considerations. The capability of social media is both a curse and a blessing. It is a curse because content may differ dramatically from day to day, making it difficult for patients to assess the qualifications of the practitioners. As both contributors to and consumers of the information shared in social media, we can post information regarding the role of conflicts in the presentation of medical information. And, perhaps ironically, we can use social media platforms to promote the need for complete disclosure of conflicts of interest [26]. In a study which assessed medical students’ attitude on social media usage, authors noticed that students are unaware of ethical issues [27]. In contrary, the present study showed that the majority of the dental practitioners were aware of the ethical issues and agreed to take patients permission before sharing their photos. But unfortunately, patients' responses differed. The data presented in this study showed that social media was used by most of the practitioners as well as patients surveyed and that social media may be an effective marketing tool in a dental practice providing practitioners with information that may be useful in tailoring marketing strategies for the dental office. And based on those previous observations, the hypothesis of this study has been accepted. However, due to the lack of literature, we compared our outcomes with few previously done researches because we didn't come across many of them which cover the points that we aimed to look after in marketing use of social media among dental practice specializing in Saudi Arabia. A recommendation of more detailed studies with larger sample size especially among dental practitioners is advised.
Within the limitation of the current study, we concluded that:
• Social media became a commonly used marketing strategy in the dental practice especially for sharing and getting
information's as well as attracts new patients.
• Females were more interested to use social media; Instagram was the most commonly used platform among patients while
the practitioners used Twitter.
• Governmental practitioners were more interested to use different social media platforms in dental marketing than private ones.
• Photographs and videos of personal work were the most preferable type of posts among dental practitioners while
awareness posts were the most preferable by the patients.
• Further research and discussion should explore the legal and ethical issues of using social media in dental practices
on implementing it as part of marketing strategies in KSA.
The author(s) declared no potential conflicts of interest with respect to the research, authorship, and/or publication of this article.