The Study on the SWOT Analysis of Solar Energy in Ethiopia
Background: Due to geographical location all place of Ethiopia will harness much amount of solar energy. Solar irradiation of Ethiopia varies from 4.5 kWh/m2- 7.5 kWh/m2. The technology to convert this energy to electricity is also environmentally friendly.
Method: Solar energy SWOT analyses in Ethiopia have been labelled. The current state of art in utilization and promotion of solar energy is presented in this paper.
Results: The power shortage in the country drives the people to use solar energy for daily activity. In grid areas (towns and semi towns) barberry shop and mobile charging shops used small solar PV system when there is power shutdown. In the country from 7.01 PWh potentials of solar energy with rough estimation only 88.5MW can be utilized. Even though the people prefer to use solar energy, the SWOT analyses identify some gaps in solar energy development. That should be solved for easily market penetration and promotion and utilization of this energy.
Conclusions: The SWOT analyses solar energy in Ethiopia directs as to conclude as the following: to have interesting legal regulation (for investors, contractor, seller and user), actual financial support for investors, tax waiving and start national certificate agency for solar energy equipment’s, educating for the public, investor, contractor and decision makers in the field of solar energy development sector.
Keywords: Solar Energy; SWOT Analysis; Photovoltaic; Solar Energy Surveys; Tax; Solar Irradiation; Ethiopia
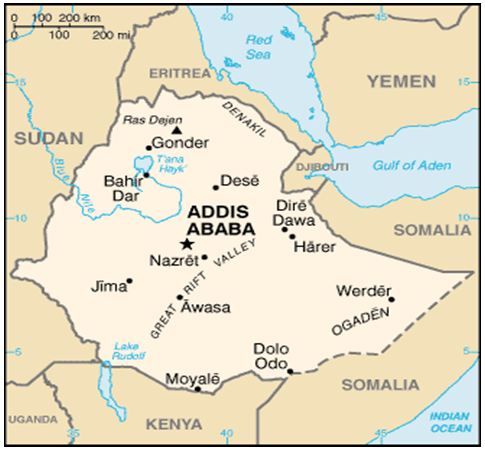
Ethiopia is located at 9.1450° N and 40.4897° E. Geographically, the country is located in horn of Africa. The Country is land locked and the second largest country in Africa. The economics is based on agricultural know a day it seems to shift to manufacturing. The country is poor in energy production and the mainly power source is from hydro power [1].
The minimum per capital energy consumption for subs - Saharan country and the world is 550 kWh/year. Whereas Ethiopian country per capital consumption is 25 kWh/year. The above Figure shows the country need to harness more energy source so as to reach the minimum standards. This small energy also produced from hydropower. But the country has huge energy sources from solar wind and other resources. Currently, energy is produced only from hydropower at low capacity Up to Know [3]. On the other side the country has 45,000MW potential from hydropower and this make Ethiopia the second biggest Potential in Subs –Saharan country [3].
Due to interruption of rain fall the country run-through famine and drought, this water shortage will affect the dams and in general it face power shortage. So energy security should be the priority agenda. The government nowadays are looking other renewable power sources like solar, wind and geothermal. This energy choice is environmental friendlies and cost effective once [4].
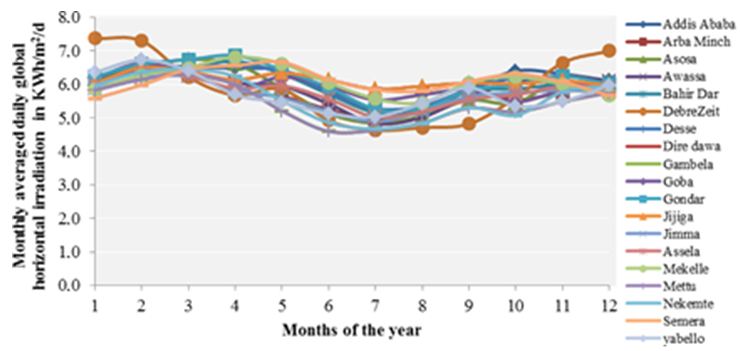
The country is located in tropical belt regions with 12 months and 5 days of sun shine (according to a local calendar). The solar radiation received in all the regions of Ethiopia is different but it the minimum from high land areas is 4.5 kWh/m2 and maximum is from low land areas in average 7.5kWh/m2 per day. The Figure 2 below shows global solar horizontal irradiation for selected cities of the Ethiopian.
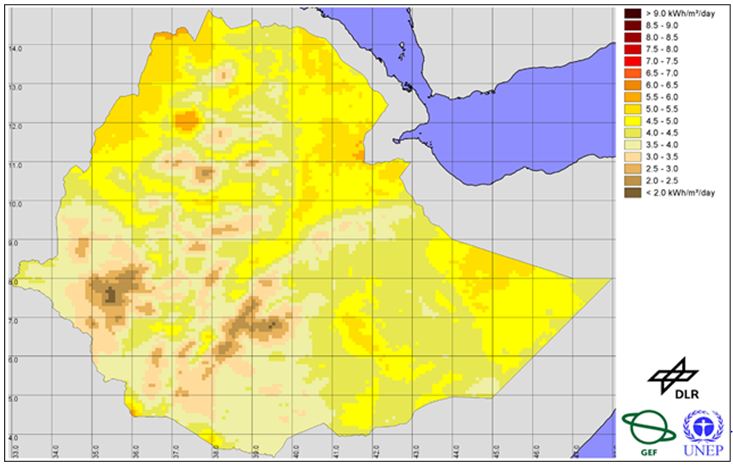
Below Figure 3 shows solar irradiation zones with minimum and maximum values. At average solar irradiation received in land is estimated around 6.0 kWh/m2 per day, which can be converted to 2200 kWh/m2 per year
Theoretical the country solar potential is estimated to 260 PWh. It is impossible to harness this value of energy from solar due geographical factors. But it is estimated to have potential to use 196 PWh from land and 0.1PWh in roof top areas. Though, geographical and environmental problems it is impossible to harness all the solar energy which reaches in land. But, for large solar farms 7 PWh and for standalone 0.04 PWh solar Potential is existed in the country. The rooftop is suitable for Social institutions (clinic, school and farmer training centers) and manufacturing buildings. The potential for standalone application of solar energy is about 7 fold more than the current country electric production. Whereas the potential in term of land used for large farms is 1000 times suitable [7].
In Ethiopia solar PV is utilized for off-grid areas and grid connected areas. The off-grid application of lighting and income generation activity. Solar PV for off-grid area to lighting social institutes like (health center, school and farmer training centers), Households (including to run TV, radio), for telecom towers (network tower) and for town water supply (water pumping). Currently is not practice by generating huge power and feed to national grid. Due to always black out people are practicing to use small scale solar for house hold light and charging mobiles. In Ethiopia people are using solar energy in off-grid areas due to the following reasons: scattered population, low investment cost, reliable power, create local jobs and incomes for distrusters [8].
The methodology used in this study was using SWOT Analyses. SWOT is denoted S for Strength, W for Weakness, O for Opportunity and T for Treat. SWOT is a common tool used for analysis to utilization and promotion of solar energy.
Many researchers were used this tool to analyses internal and external factors in development of solar (renewable energy) development and utilizations in the country or within the regions. The projects which strength the above ideas are as follow. A researcher used the tool for analyses of solar energy in India, renewable energy sources in Romania case of solar energy, the study on renewable energy sector on the example of the Pomorskie Voivodeship (Poland) [1-4].
This Paper examined the internal and external environment factors. Internal Factors for utilization of solar energy in Ethiopia is examined as Strength (S) or Weakness (W) and for those external factors can be examined under opportunities (O) and Threats (T). In this paper, the SWOT is developed for solar energy utilization and promotion using standard data collection method. In this paper data was collected from renewable energy sellers and stakeholders (survey), secondary data from published sources [9-11].
1. The political commitment of the state to harness solar energy, availability of the solar master plan and grid based Universalenergy access program (UEAP).
2. The Increasing trend of awareness and utilization of solar energy in off-grid and on grid areas of the country.
3. The energy security plan helps to increase the use of solar energy (main electrical energy source is from Hydro-power.).
4. The charge for electricity is low when compare to other east African country. The monthly energy bill will also reduce when compare to other energy source. The only cost of this system is investment cost. Also power interruption is low when we compared to other energy sources.
5. Proved technology available and local production proficiency
6. The resource availability all year round with high solar radiation. Since the country is located on solar belt zone.
7. For the country like Ethiopia the settlement of the people is far apart. Cable line is required to connect to the sources to the load, whereas for solar energy no need of long travel only putting the solar energy into load site. Line loss in Ethiopia encounter (30% loss) we will avoid such losses if we use solar energy.
8. Solar energy will install at anywhere and any place. The only thing is resource availability and area to locate, commonly unused area like roof top and window is a common area to put a solar panel. Whereas other energy source they need a suitable area for power generation.
9. Solar energy is environmentally friendly. During the operation, there is no Co2 emitting to the environment; Ethiopia is also a country which made a signature in the Kyoto Protocol to reduce environmental emission.
10. Ethiopia is located within a solar belt. Most areas are suitable for solar energy utilization. And electric coverage of the country is low, almost 80% the people live in rural areas without grid power.
11. In Ethiopia, solar lanterns and small solar system are creating jobs for the young technicians.
1. Even though Ethiopia is located on a solar belt, there also some area with snow, in such area solar energy is limited.
2. Except the panel, all solar equipment will import and the investment cost is when compared to the other sources.
3. The cost of production of energy from solar is high when we compare to the conventional once.
4. In Ethiopia, solar energy awareness is limited to academic institutions rather than the people.
5. High maintenance cost, high frequent breakdown this too well made serious problem for sites which are located in remote areas, difficulty in finding technician even.
6. In Ethiopia, solar energy sector, there are no subsidies to increase the access of the energy to the farmer and low incomes.
7. Many donors are donating solar energy, but there are no coordination and event quality control of the solar system.
8. Feed-in-tariffs law is not in place, low involving of financial institutes and private sectors in the development and utilization of solar energy technology.
9. Since the solar technology is imported abroad the Taxes and duties are imposed in these systems. That will increase the investment cost.
10. Lack of research and development office in the solar energy systems, on giving analysis information for the user and government on strategic outlook, supply and business models.
1. Ethiopia is a country which imports oil from the neighboring country using the ports of Djibouti and Sudan. Since the international barely price increased the government has been giving subsidies to the oil. Before 3 years (since 2015) the government avoids such subsidies to the oil and the oil price is increasing every month. On the other hand the country has a huge amount of solar energy, and the government should work to develop on power generation and on the appliance. 2. In Ethiopia it is possible to generalize the consumers as households, small business and institutions. The main institutions which use solar energy are Health centers, telecommunication for mobile stations and school. In overall country, 80% of the people are living in rural areas in this area we will find those consumers. 3. Currently, there are huge retailer shops and dealers in the Ethiopia solar energy market. Supplies have many outlets in every village in the country. But suppliers are limited only for lanterns, rather than small photovoltaic systems. 4. In Ethiopia their vast potential for off-grid for electricity generation and mobile charging. 5. Currently, Ethiopian Standard Agency (ESA) is preparing a document for Ethiopian standard and protocols for testing service for (imports produce, service providers and consumers). Now the Authorities are using Africa-lighting certified products to enter into the market. There is also lack to control the market; un-certified product is also entering into the market unknowingly. 6. In Ethiopia the demand for lighting, mobile charging, radio and television support solar systems in off-grid area of the country. 7. Solar Technology is maturing, solar lanterns. Solar home systems are user friendly, easier to disseminate and operate. By reading the manual and with some sort of training some young men/wen to install the system and also job creation medium and income generation areas.
1. The investment cost to install, maintain and distribution of solar energy, only high investors are involved in this area. 2. Ethiopian government didn’t subside for solar energy dealers, importers, and for the user also. 3. In Ethiopia the settlement of the people is sparse (low density) this makes huge investment for interring connecting of the load to a generation site. 4. Less priority is given to solar when compared to the other renewable resource like hydro. 5. Increasing of the populations
This research paper concerns the present status of Ethiopian solar energy sector by performing an SWOT analysis. The SWOT analysis has led to the conclusion of the fast growth solar energy development in Ethiopia strongly depends on education the public, investor, government and developers. The preference to use solar energy is rising and certainly the demand will increase the near future. The government should to work on two things. The first one is on developing skill man power, to maintain and install solar panels. Still in the country there are such schools. Secondly, the government should work to reduce the cost of solar panel. Generally it concludes that, if the government is takes attention on this sector, the government will be benefited by creating a job for youth and for clean development to country economy.